You are not logged in.
This means you
CAN ONLY VIEW reports that were published prior to Sunday, February 25, 2024.
You
MUST UPGRADE YOUR MEMBERSHIP if you want to see any current reports.
AFTER MARKET UPDATE - FRIDAY, AUGUST 23RD, 2019
Previous After Market Report Next After Market Report >>>
|
|
|
|
DOW |
-623.34 |
25,628.90 |
-2.37% |
|
Volume |
971,405,850 |
+42% |
|
Volume |
2,196,258,660 |
+24% |
|
NASDAQ |
-239.62 |
7,751.77 |
-3.00% |
|
Advancers |
402 |
15% |
|
Advancers |
487 |
16% |
|
S&P 500 |
-75.84 |
2,847.11 |
-2.59% |
|
Decliners |
2,352 |
85% |
|
Decliners |
2,592 |
84% |
|
Russell 2000 |
-46.52 |
1,459.49 |
-3.09% |
|
52 Wk Highs |
138 |
|
|
52 Wk Highs |
66 |
|
|
S&P 600 |
-28.85 |
896.50 |
-3.12% |
|
52 Wk Lows |
191 |
|
|
52 Wk Lows |
189 |
|
|
 |
Distributional Pressure Whacks Major Indices
Kenneth J. Gruneisen - Passed the CAN SLIM® Master's Exam
The major averages erased earlier gains to post a fourth straight weekly decline, with the S&P 500 sliding 1.4%. For the week, the Dow lost 1%, while the Nasdaq Composite declined 1.8%. On Friday the Dow fell 623 points, while the S&P 500 and Nasdaq Composite each lost 2.6% and 3% respectively. Volume totals reported were higher than the prior session totals on the NYSE and on the Nasdaq exchange, indicative of distributional pressure. Breadth was clearly on the negative side as decliners led advancers by nearly 6-1 on the NYSE and more than 5-1 on the Nasdaq exchange. There were 35 high-ranked companies from the Leaders List hit new 52-week highs and were listed on the BreakOuts Page, versus the total of 53 on the prior session. New 52-week lows outnumbered new 52-week highs on the NYSE and on the Nasdaq exchange. A follow-through day on 8/13/19 marked a bullish shift concerning the M criteria of the fact-based investment system. Investors have a green light to make carefully selected new buying efforts, however, subsequent losses below prior low for the Nasdaq Composite Index would technically kill the new rally. The Featured Stocks Page provides the most timely analysis on high-ranked leaders.Charts used courtesy of www.stockcharts.com
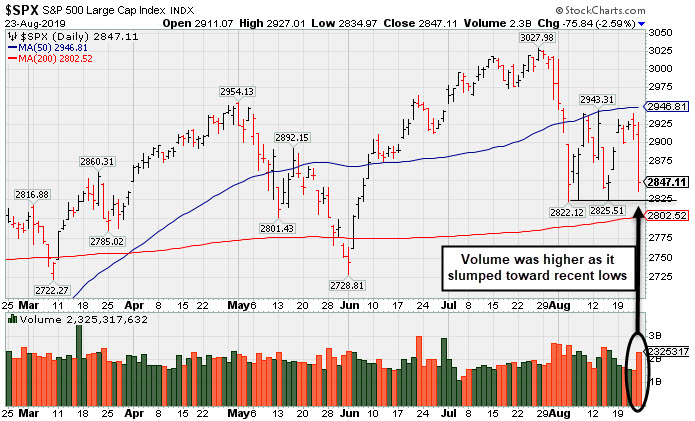
PICTURED: The S&P 500 Index dove toward its prior lows and 200-day moving average (DMA) line with a big loss on higher volume.
Stocks finished firmly lower Friday as disappointing trade headlines pressured investor sentiment. China announced retaliatory tariffs on 5% to 10% of another $75 billion worth of U.S. goods, including a resumption of a 25% levy on automobiles. President Trump responded by urging U.S. companies to “immediately start looking for an alternative to China,” saying he would officially respond as early as Friday afternoon.
In earnings, Salesforce.com (CRM -2.25%) slumped even after the cloud provider topped analyst revenue projections and raised its forward guidance. Treasuries rallied on Friday as perceived safe haven assets caught a bid. The yield on the 10-year note dropped nine basis points to 1.52%. In commodities, WTI crude slumped 2.1% to $54.17/barrel. COMEX gold jumped 2% to $1,526.60/ounce amid a weaker U.S. dollar. On the data front, new home sales slipped 12.8% in July, while the prior month’s figure was upwardly revised to reflect a 20.9% gain.
Fed commentary also remained in focus as the annual Jackson Hole central bank symposium was underway. Fed Chair Jerome Powell reaffirmed his belief that the U.S. economy remains in a “favorable place.” Amid the presence of “significant risks,” Powell reiterated the intention to “act as appropriate to sustain the expansion.”
|
 Kenneth J. Gruneisen started out as a licensed stockbroker in August 1987, a couple of months prior to the historic stock market crash that took the Dow Jones Industrial Average down -22.6% in a single day. He has published daily fact-based fundamental and technical analysis on high-ranked stocks online for two decades. Through FACTBASEDINVESTING.COM, Kenneth provides educational articles, news, market commentary, and other information regarding proven investment systems that work in good times and bad.
Comments contained in the body of this report are technical opinions only and are not necessarily those of Gruneisen Growth Corp. The material herein has been obtained from sources believed to be reliable and accurate, however, its accuracy and completeness cannot be guaranteed. Our firm, employees, and customers may effect transactions, including transactions contrary to any recommendation herein, or have positions in the securities mentioned herein or options with respect thereto. Any recommendation contained in this report may not be suitable for all investors and it is not to be deemed an offer or solicitation on our part with respect to the purchase or sale of any securities. |
|
 |
Financial, Retail, Tech, and Energy Linked Groups Fell
Kenneth J. Gruneisen - Passed the CAN SLIM® Master's Exam
The financial indexes suffered big losses as the Bank Index ($BKX -2.83%) and Broker/Dealer Index ($XBD -2.64%) both slumped badly, and the Retail Index ($RLX -2.75%) also was smacked with a large loss. The tech sector had a negative bias as the Semiconductor Index ($SOX -4.36%), Biotech Index ($BTK -2.59%) and the Networking Index ($NWX -2.83%) suffered big losses. Commodity-linked groups were mixed as the Integrated Oil Index ($XOI -3.41%) and Oil Services Index ($OSX -5.31%) both dove lower, meanwhile, the Gold & Silver Index ($XAU +4.02%) was a standout gainer.
Charts courtesy of www.stockcharts.com
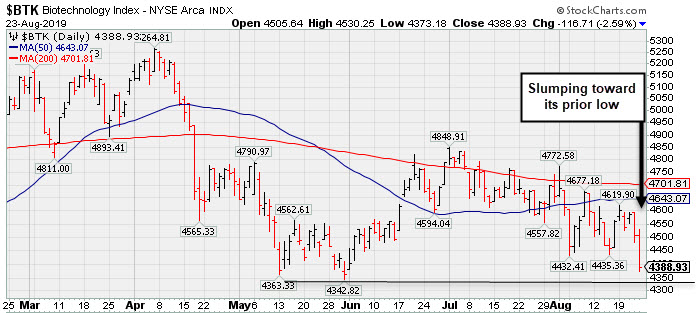
PICTURED: The Biotech Index ($BTK -2.59%) slumped toward its prior low.
| Oil Services |
$OSX |
60.37 |
-3.38 |
-5.30% |
-25.10% |
| Integrated Oil |
$XOI |
1,129.93 |
-39.95 |
-3.41% |
-2.52% |
| Semiconductor |
$SOX |
1,446.38 |
-65.87 |
-4.36% |
+25.21% |
| Networking |
$NWX |
536.42 |
-15.61 |
-2.83% |
+9.77% |
| Broker/Dealer |
$XBD |
247.61 |
-6.70 |
-2.64% |
+4.33% |
| Retail |
$RLX |
2,285.12 |
-64.59 |
-2.75% |
+17.10% |
| Gold & Silver |
$XAU |
97.78 |
+3.78 |
+4.02% |
+38.38% |
| Bank |
$BKX |
89.57 |
-2.61 |
-2.83% |
+4.41% |
| Biotech |
$BTK |
4,388.93 |
-116.71 |
-2.59% |
+3.98% |
|
|
|
 |
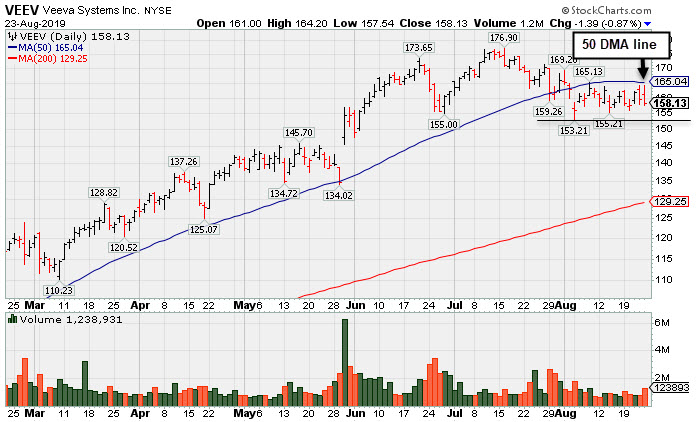
Met Resistance After Slumping Below 50-Day Moving Average
Kenneth J. Gruneisen - Passed the CAN SLIM® Master's Exam
Veeva Systems Inc Cl A (VEEV -$1.39 or -0.87% to $158.13) churned heavier volume while remaining below its 50-day moving average (DMA) line ($165). Near-term support is defined by the prior low ($153.21 on 8/05/19).
Keep in mind that it is due to report earnings news on 8/27/19. Volume and volatility often increase near earnings news. Bullish action came after it reported earnings +52% on +25% sales revenues for the Apr '19 quarter, marking its 5th strong quarter with earnings above the +25% minimum guideline (C criteria).
It was highlighted in yellow with pivot point cited based on its 5/16/19 high plus 10 cents in the 5/30/19 mid-day report (read here) and last shown in this FSU section on 8/01/19 with an annotated graph under the headline, "Recently Found Support Near 50-Day Moving Average" .
Its annual earnings (A criteria) history has been strong. It has the highest possible 99 Earnings Per Share (EPS) rank and it has a 97 Relative Strength (RS) rating. Both of those ratings must be above 80 for a stock to meet the guidelines for consideration.
The number of top-rated funds owning its shares rose from 814 in Jun '18 to 1,251 in Jun '19, a reassuring sign concerning the I criteria. Its current Up/Down Volume Ratio of 0.9 is an unbiased indication its shares have been under accumulation over the past 50 days.
|
|
|
Color Codes Explained :
Y - Better candidates highlighted by our
staff of experts.
G - Previously featured
in past reports as yellow but may no longer be buyable under the
guidelines.
***Last / Change / Volume data in this table is the closing quote data***
Symbol/Exchange
Company Name
Industry Group |
PRICE |
CHANGE
(%Change) |
Day High |
Volume
(% DAV)
(% 50 day avg vol) |
52 Wk Hi
% From Hi |
Featured
Date |
Price
Featured |
Pivot Featured |
|
Max Buy |
 SPSC
-
NASDAQ
SPSC
-
NASDAQ
S P S Commerce Inc
COMPUTER SOFTWARE and SERVICES - Application Software
|
$49.67
|
-1.69
-3.28% |
$52.25
|
324,113
261.59% of 50 DAV
50 DAV is 123,900
|
$59.14
-16.01%
|
6/7/2019
|
$53.86
|
PP = $57.55
|
|
MB = $60.43
|
 Most Recent Note - 8/23/2019 6:46:11 PM
Today it slumped near its 200 DMA line ($49.50). It will be dropped from the Featured Stocks list tonight. Do not be confused by a 2:1 share split which impacted share price (Featured Price, Pivot Point were adjusted). Its Relative Strength Rating is 64, below the 80+ minimum guideline for buy candidates. Reported earnings +20% on +12% sales revenues for the Jun '19 quarter, slightly under the +25% minimum earnings guideline (C criteria), raising fundamental concerns.
>>> FEATURED STOCK ARTICLE : Found Support at 50-Day Average - 8/8/2019 |
View all notes |
Set NEW NOTE alert |
Company Profile |
SEC
News |
Chart |
Request a new note
C
A
S
I |
EPAM
-
NYSE
Epam Systems Inc
COMPUTER SOFTWARE and SERVICES - Information Technology Service
|
$188.24
|
-7.26
-3.71% |
$195.89
|
324,810
79.03% of 50 DAV
50 DAV is 411,000
|
$201.00
-6.35%
|
5/9/2019
|
$169.25
|
PP = $180.55
|
|
MB = $189.58
|
Most Recent Note - 8/23/2019 6:31:38 PM
G - Pulled back toward its 50 DMA line ($186). It has not formed a new base of sufficient length and faces some resistance due to overhead supply up to the $201 level. Reported earnings +27% on +24% sales revenues for the Jun '19 quarter.
>>> FEATURED STOCK ARTICLE : Rebounded Above 50-Day Average Following Earnings Report - 8/12/2019 |
View all notes |
Set NEW NOTE alert |
Company Profile |
SEC
News |
Chart |
Request a new note
C
A
S
I |
AUDC
-
NASDAQ
Audiocodes Ltd
ELECTRONICS - Scientific and Technical Instrum
|
$17.29
|
-0.36
-2.04% |
$17.74
|
108,380
60.89% of 50 DAV
50 DAV is 178,000
|
$19.74
-12.41%
|
7/15/2019
|
$17.10
|
PP = $17.54
|
|
MB = $18.42
|
Most Recent Note - 8/23/2019 6:28:54 PM
Y - Support is defined by prior highs in the $17 area and its 50 DMA line ($17.01). More damaging losses would raise concerns and trigger technical sell signals. Reported earnings +57% on +14% sales revenues for the Jun '19 quarter, continuing its strong earnings track record.
>>> FEATURED STOCK ARTICLE : Volume Totals Cooling as Bullish Action Continues - 8/13/2019 |
View all notes |
Set NEW NOTE alert |
Company Profile |
SEC
News |
Chart |
Request a new note
C
A
S
I |
LHCG
-
NASDAQ
L H C Group Inc
HEALTH SERVICES - Home Health Care
|
$119.05
|
-1.20
-1.00% |
$121.45
|
192,739
86.04% of 50 DAV
50 DAV is 224,000
|
$129.37
-7.98%
|
7/1/2019
|
$110.94
|
PP = $122.20
|
|
MB = $128.31
|
Most Recent Note - 8/20/2019 5:23:38 PM
G - Quietly sputtering below its 50 DMA line ($120.59) and below its pivot point. Any breach of recent low ($116.67 on 8/13/19) would raise more serious concerns. See the latest FSU analysis for more details and a new annotated graph.
>>> FEATURED STOCK ARTICLE : Sputtering Below 50-Day Average and Below Pivot Point - 8/20/2019 |
View all notes |
Set NEW NOTE alert |
Company Profile |
SEC
News |
Chart |
Request a new note
C
A
S
I |
CHDN
-
NASDAQ
Churchill Downs Inc
LEISURE - Gaming Activities
|
$121.29
|
-2.71
-2.19% |
$123.18
|
259,743
113.42% of 50 DAV
50 DAV is 229,000
|
$132.73
-8.62%
|
7/22/2019
|
$118.45
|
PP = $118.89
|
|
MB = $124.83
|
Most Recent Note - 8/20/2019 5:25:36 PM
Y - Found support near its 50 DMA line ($111.17). Weak action came after it reported Jun '19 earnings rose +10% on +26% sales revenues versus the year ago period, below the +25% minimum earnings guideline (C criteria). The prior low ($113.88 on 8/05/19) defines the next important near-term support to watch.
>>> FEATURED STOCK ARTICLE : Recently Found Support at 50-Day Moving Average - 8/14/2019 |
View all notes |
Set NEW NOTE alert |
Company Profile |
SEC
News |
Chart |
Request a new note
C
A
S
I |
Symbol/Exchange
Company Name
Industry Group |
PRICE |
CHANGE
(%Change) |
Day High |
Volume
(% DAV)
(% 50 day avg vol) |
52 Wk Hi
% From Hi |
Featured
Date |
Price
Featured |
Pivot Featured |
|
Max Buy |
LULU
-
NASDAQ
Lululemon Athletica
MANUFACTURING - Textile Manufacturing
|
$180.03
|
-3.94
-2.14% |
$184.12
|
1,639,267
87.52% of 50 DAV
50 DAV is 1,873,000
|
$194.25
-7.32%
|
6/13/2019
|
$174.48
|
PP = $179.60
|
|
MB = $188.58
|
Most Recent Note - 8/21/2019 6:28:11 PM
G - Rebounded near its 50 DMA line ($183.47) with today's 5th consecutive small gain backed by light volume. A convincing rebound above the 50 DMA line can help its technical stance improve, but it faces near-term resistance up to the $194 level. Reported Apr '19 quarterly earnings +35% on +20% sales revenues versus the year ago period.
>>> FEATURED STOCK ARTICLE : Sputtering After Slump Below 50-Day Moving Average - 8/15/2019 |
View all notes |
Set NEW NOTE alert |
Company Profile |
SEC
News |
Chart |
Request a new note
C
A
S
I |
ULTA
-
NASDAQ
Ulta Beauty Inc
SPECIALTY RETAIL - Specialty Retail, Other
|
$322.10
|
-12.77
-3.81% |
$332.37
|
1,096,821
158.50% of 50 DAV
50 DAV is 692,000
|
$368.83
-12.67%
|
3/15/2019
|
$341.27
|
PP = $322.59
|
|
MB = $338.72
|
Most Recent Note - 8/23/2019 1:15:00 PM
G - Sputtering today and a rebound above its 50 DMA line ($345) is needed for its outlook to improve. Recently found support above its 200 DMA line ($319) following volume-driven losses, but more damaging losses would raise serious concerns. Due to report earnings on 8/29/19. Volume and volatility often increase near earnings news. The Apr '19 quarter was below the +25% minimum earnings guideline (C criteria) which already raised fundamental concerns.
>>> FEATURED STOCK ARTICLE : Ulta Beauty Sputtering Below 50-Day Moving Average - 8/7/2019 |
View all notes |
Set NEW NOTE alert |
Company Profile |
SEC
News |
Chart |
Request a new note
C
A
S
I |
CHGG
-
NYSE
Chegg Inc
Consumer Svcs-Education
|
$40.05
|
-0.81
-1.98% |
$41.19
|
1,181,075
76.94% of 50 DAV
50 DAV is 1,535,000
|
$48.22
-16.94%
|
7/8/2019
|
$44.11
|
PP = $41.79
|
|
MB = $43.88
|
Most Recent Note - 8/20/2019 5:26:54 PM
G - Remains below its 50 DMA line ($41.65) which acted as resistance after recent losses on higher volume. A prompt rebound above the 50 DMA line is needed for its outlook to improve. Reported earnings +92% on +26% sales revenues for the Jun '19 quarter.
>>> FEATURED STOCK ARTICLE : Consolidating Above Prior Highs and 50-Day Average - 8/6/2019 |
View all notes |
Set NEW NOTE alert |
Company Profile |
SEC
News |
Chart |
Request a new note
C
A
S
I |
VEEV
-
NYSE
Veeva Systems Inc Cl A
Computer Sftwr-Medical
|
$158.13
|
-1.39
-0.87% |
$164.20
|
1,236,787
94.92% of 50 DAV
50 DAV is 1,303,000
|
$176.90
-10.61%
|
5/30/2019
|
$154.32
|
PP = $145.80
|
|
MB = $153.09
|
Most Recent Note - 8/23/2019 6:27:19 PM
G - Its 50 DMA line ($165) acted as resistance after volume-driven losses. A rebound above the 50 DMA line is needed for its outlook to improve. Fundamentals remain strong. See the latest FSU analysis for more details and a new annotated graph.
>>> FEATURED STOCK ARTICLE : Met Resistance After Slumping Below 50-Day Moving Average - 8/23/2019 |
View all notes |
Set NEW NOTE alert |
Company Profile |
SEC
News |
Chart |
Request a new note
C
A
S
I |
PAYC
-
NYSE
Paycom Software Inc
COMPUTER SOFTWARE and SERVICES - Application Software
|
$248.91
|
+0.31
0.12% |
$256.57
|
721,221
117.65% of 50 DAV
50 DAV is 613,000
|
$256.84
-3.09%
|
8/20/2019
|
$246.97
|
PP = $246.95
|
|
MB = $259.30
|
Most Recent Note - 8/20/2019 5:32:35 PM
Y - Color code is changed to yellow with new pivot point cited based on its 7/11/19 high plus 10 cents. Quietly hit a new all-time high with today's 4th consecutive gain with below average volume. Gains above a stock's pivot must have at least +40% above average volume to trigger a proper new (or add-on) technical buy signal. Its 50 DMA line ($232.63) defines support above the recent low ($216.55 on 8/05/19). Reported earnings +27% on +31% sales revenues for the Jun '19 quarter, continuing its strong earnings track record.
>>> FEATURED STOCK ARTICLE : Found Support and Gapped Up Following Earnings Report - 8/2/2019 |
View all notes |
Set NEW NOTE alert |
Company Profile |
SEC
News |
Chart |
Request a new note
C
A
S
I |
Symbol/Exchange
Company Name
Industry Group |
PRICE |
CHANGE
(%Change) |
Day High |
Volume
(% DAV)
(% 50 day avg vol) |
52 Wk Hi
% From Hi |
Featured
Date |
Price
Featured |
Pivot Featured |
|
Max Buy |
BLD
-
NYSE
Topbuild Corp
Bldg-Constr Prds/Misc
|
$88.71
|
-3.63
-3.93% |
$92.96
|
262,961
84.28% of 50 DAV
50 DAV is 312,000
|
$93.59
-5.21%
|
5/17/2019
|
$82.19
|
PP = $87.31
|
|
MB = $91.68
|
Most Recent Note - 8/23/2019 6:30:20 PM
G - Pulled back from its all-time high. Stubbornly held its ground following bullish action after it reported earnings +39% on +9% sales revenues for the Jun '19 quarter versus the year ago period, continuing its strong earnings track record. Its prior highs in the $86 area define initial support to watch above 50 DMA line ($83.89) on pullbacks.
>>> FEATURED STOCK ARTICLE : Topbuild Has 4 Consecutive Weekly Gains and Stubbornly Held Ground - 8/19/2019 |
View all notes |
Set NEW NOTE alert |
Company Profile |
SEC
News |
Chart |
Request a new note
C
A
S
I |
TEAM
-
NASDAQ
Atlassian Corp Plc Cl A
Comp Sftwr-Spec Enterprs
|
$141.05
|
-2.39
-1.67% |
$146.70
|
868,887
70.81% of 50 DAV
50 DAV is 1,227,000
|
$149.80
-5.84%
|
5/24/2019
|
$129.52
|
PP = $132.09
|
|
MB = $138.69
|
Most Recent Note - 8/21/2019 6:07:59 PM
G - Found support above its pivot point and at its 50 DMA line ($136.79) in recent weeks but did not form a sound base. Prior low ($130.78 on 7/23/19) defines the next important near-term support to watch where a violation would raise serious concerns and trigger a more worrisome technical sell signal. Reported earnings +43% on +36% sales revenues for the Jun '19 quarter, continuing its strong earnings track record. See the latest FSU analysis for more details and a new annotated graph.
>>> FEATURED STOCK ARTICLE : Consolidating Near High After Recently Finding Support - 8/21/2019 |
View all notes |
Set NEW NOTE alert |
Company Profile |
SEC
News |
Chart |
Request a new note
C
A
S
I |
TTD
-
NASDAQ
The Trade Desk Inc Cl A
Comml Svcs-Advertising
|
$246.43
|
-13.46
-5.18% |
$265.65
|
1,473,176
102.02% of 50 DAV
50 DAV is 1,444,000
|
$289.51
-14.88%
|
7/18/2019
|
$240.61
|
PP = $258.10
|
|
MB = $271.01
|
Most Recent Note - 8/23/2019 6:34:19 PM
G - Undercut its 50 DMA line ($248) with a loss raising concerns and its color code is changed to green. The recent low ($239.01 on 8/21/19) defines important near-term support to watch. Violations would raise concerns and trigger technical sell signals. Reported Jun '19 quarterly earnings +58% on +42% sales revenues.
>>> FEATURED STOCK ARTICLE : Consolidating Near 50-Day Moving Average Line - 8/16/2019 |
View all notes |
Set NEW NOTE alert |
Company Profile |
SEC
News |
Chart |
Request a new note
C
A
S
I |
PAGS
-
NYSE
Pagseguro Digital Cl A
Finance-CrdtCard/PmtPr
|
$50.96
|
-1.38
-2.64% |
$52.78
|
1,141,911
48.93% of 50 DAV
50 DAV is 2,334,000
|
$53.43
-4.62%
|
6/25/2019
|
$37.69
|
PP = $40.07
|
|
MB = $42.07
|
Most Recent Note - 8/21/2019 6:25:06 PM
G - Posted a gain today with light volume for its 2nd best close. Noted in prior mid-day reports - "Reported earnings +35% on +39% sales revenues for the quarter ended June 30,2019 versus the year ago period. Recent low and 50 DMA line coincide in the $42 area defining important near-term support to watch on pullbacks."
>>> FEATURED STOCK ARTICLE : Brazil-Based Digital Payments Firm Perched at All-Time High - 8/22/2019 |
View all notes |
Set NEW NOTE alert |
Company Profile |
SEC
News |
Chart |
Request a new note
C
A
S
I |
|
|
|
THESE ARE NOT BUY RECOMMENDATIONS!
Comments contained in the body of this report are technical
opinions only. The material herein has been obtained
from sources believed to be reliable and accurate, however,
its accuracy and completeness cannot be guaranteed.
This site is not an investment advisor, hence it does
not endorse or recommend any securities or other investments.
Any recommendation contained in this report may not
be suitable for all investors and it is not to be deemed
an offer or solicitation on our part with respect to
the purchase or sale of any securities. All trademarks,
service marks and trade names appearing in this report
are the property of their respective owners, and are
likewise used for identification purposes only.
This report is a service available
only to active Paid Premium Members.
You may opt-out of receiving report notifications
at any time. Questions or comments may be submitted
by writing to Premium Membership Services 665 S.E. 10 Street, Suite 201 Deerfield Beach, FL 33441-5634 or by calling 1-800-965-8307
or 954-785-1121.
|
|
|