***Last / Change / Volume data in this table is the closing quote data***
Symbol/Exchange
Company Name
Industry Group |
PRICE |
CHANGE
(%Change) |
Day High |
Volume
(% DAV)
(% 50 day avg vol) |
52 Wk Hi
% From Hi |
Featured
Date |
Price
Featured |
Pivot Featured |
|
Max Buy |
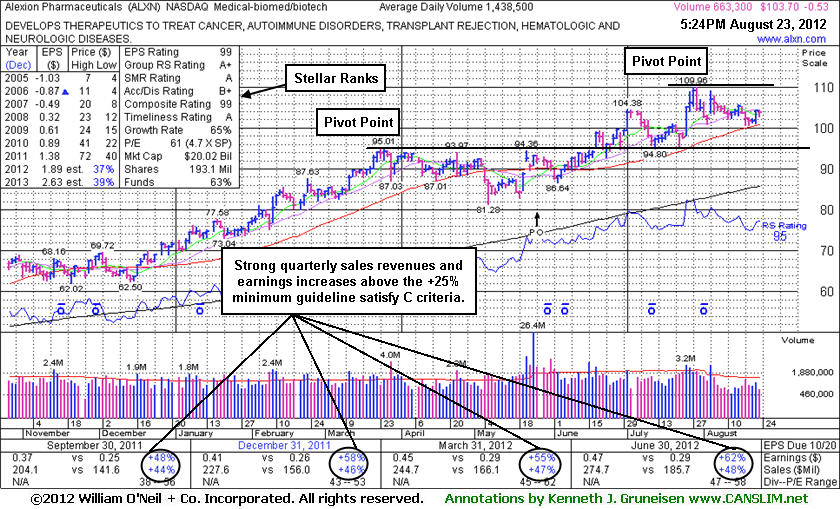
ALXN
-
NASDAQ
Alexion Pharmaceuticals
DRUGS - Drug Manufacturers - Other
|
$103.70
|
-0.53
-0.51% |
$104.50
|
671,877
46.71% of 50 DAV
50 DAV is 1,438,500
|
$109.96
-5.69%
|
8/23/2012
|
$103.70
|
PP = $110.06
|
|
MB = $115.56
|
 Most Recent Note - 8/23/2012 5:50:10 PM
Y - Color code is changed to yellow with new pivot point cited based on its 7/27/12 high plus 10 cents. Volume totals have been cooling in recent weeks while consolidating above support defined by its 50 DMA line. Subsequent volume-driven gains above its pivot point may trigger a new (or add-on) technical sell signal. See the latest FSU analysis for more details and a new annotated graph.
>>> The latest Featured Stock Update with an annotated graph appeared on 8/23/2012. Click here.
View all notes |
Alert me of new notes |
CANSLIM.net Company Profile |
SEC |
Zacks Reports |
StockTalk |
News |
Chart |
Request a new note
C
A N
S L
I M


|
ASPS
-
NASDAQ
Altisource Ptf Sltns Sa
REAL ESTATE - Property Management/Developmen
|
$84.12
|
-0.83
-0.98% |
$85.01
|
160,028
116.98% of 50 DAV
50 DAV is 136,800
|
$92.29
-8.85%
|
6/5/2012
|
$60.01
|
PP = $63.00
|
|
MB = $66.15
|
Most Recent Note - 8/22/2012 11:54:04 AM
G - Down a little more today following 2 consecutive losses with above average volume, retreating from its all-time high. It has been repeatedly noted - "Extended from its prior base, and its 50 DMA line defines near-term support to watch."
>>> The latest Featured Stock Update with an annotated graph appeared on 8/3/2012. Click here.
View all notes |
Alert me of new notes |
CANSLIM.net Company Profile |
SEC |
Zacks Reports |
StockTalk |
News |
Chart |
Request a new note
C
A N
S L
I M
|
CFNL
-
NASDAQ
Cardinal Financial Corp
BANKING - Regional - Southeast Banks
|
$12.83
|
-0.18
-1.38% |
$13.00
|
39,576
55.58% of 50 DAV
50 DAV is 71,200
|
$13.30
-3.53%
|
8/17/2012
|
$12.84
|
PP = $13.31
|
|
MB = $13.98
|
Most Recent Note - 8/21/2012 5:10:25 PM
Y - Challenged its pivot point with today's 5th consecutive gain backed by below average volume. Subsequent volume-driven gains above its pivot point may trigger a new (or add-on) technical buy signal. See the latest FSU analysis for more details and a new annotated graph.
>>> The latest Featured Stock Update with an annotated graph appeared on 8/21/2012. Click here.
View all notes |
Alert me of new notes |
CANSLIM.net Company Profile |
SEC |
Zacks Reports |
StockTalk |
News |
Chart |
Request a new note
C
A N
S L
I M
|
CMCSA
-
NASDAQ
Comcast Corp Cl A
MEDIA - CATV Systems
|
$33.95
|
-0.03
-0.07% |
$34.02
|
7,694,096
57.51% of 50 DAV
50 DAV is 13,379,600
|
$35.16
-3.46%
|
6/11/2012
|
$29.94
|
PP = $30.98
|
|
MB = $32.53
|
Most Recent Note - 8/22/2012 5:26:06 PM
G - Consolidating just -3.4% off its 52-week high today with volume totals below average in recent weeks indicating that few investors are exiting. Recently reported earnings +19% on +6% sales revenues for the Jun '12 quarter, below the fact-based investment system's +25% minimum guideline for the C criteria.
>>> The latest Featured Stock Update with an annotated graph appeared on 8/15/2012. Click here.
View all notes |
Alert me of new notes |
CANSLIM.net Company Profile |
SEC |
Zacks Reports |
StockTalk |
News |
Chart |
Request a new note
C
A N
S L
I M
|
DG
-
NYSE
Dollar General Corp
RETAIL - Discount, Variety Stores
|
$49.71
|
-0.83
-1.64% |
$50.03
|
4,561,076
148.20% of 50 DAV
50 DAV is 3,077,600
|
$56.04
-11.30%
|
7/16/2012
|
$54.68
|
PP = $56.14
|
|
MB = $58.95
|
Most Recent Note - 8/23/2012 2:44:46 PM
G - Up from the session's lows, it undercut its prior low ($49.42) after gapping down today for a damaging 4th consecutive loss. A rebound above its 50 DMA line is needed for its technical stance and outlook to improve.
>>> The latest Featured Stock Update with an annotated graph appeared on 8/16/2012. Click here.
View all notes |
Alert me of new notes |
CANSLIM.net Company Profile |
SEC |
Zacks Reports |
StockTalk |
News |
Chart |
Request a new note
C
A N
S L
I M
|
Symbol/Exchange
Company Name
Industry Group |
PRICE |
CHANGE
(%Change) |
Day High |
Volume
(% DAV)
(% 50 day avg vol) |
52 Wk Hi
% From Hi |
Featured
Date |
Price
Featured |
Pivot Featured |
|
Max Buy |
ECPG
-
NASDAQ
Encore Capital Group Inc
FINANCIAL SERVICES - Credit Services
|
$28.03
|
-0.17
-0.60% |
$28.26
|
143,846
96.03% of 50 DAV
50 DAV is 149,800
|
$30.47
-8.01%
|
8/3/2012
|
$29.91
|
PP = $30.45
|
|
MB = $31.97
|
Most Recent Note - 8/21/2012 5:18:23 PM
Y - Pulled back today with above average volume, yet it remains just above its 50 DMA line and perched only -4.8% off its 52-week high. Completed a Secondary Offering on 8/08/12. Subsequent volume-driven gains for a close above its pivot point would trigger a technical buy signal.
>>> The latest Featured Stock Update with an annotated graph appeared on 8/6/2012. Click here.
View all notes |
Alert me of new notes |
CANSLIM.net Company Profile |
SEC |
Zacks Reports |
StockTalk |
News |
Chart |
Request a new note
C
A N
S L
I M
|
EXPE
-
NASDAQ
Expedia Inc
INTERNET - Internet Information Providers
|
$52.42
|
+0.70
1.35% |
$52.49
|
3,071,038
81.07% of 50 DAV
50 DAV is 3,788,200
|
$59.50
-11.90%
|
4/27/2012
|
$41.80
|
PP = $35.57
|
|
MB = $37.35
|
Most Recent Note - 8/20/2012 2:37:46 PM
G - Consolidating above prior highs and its 50 DMA line defining important near-term chart support in the $50 area.
>>> The latest Featured Stock Update with an annotated graph appeared on 8/14/2012. Click here.
View all notes |
Alert me of new notes |
CANSLIM.net Company Profile |
SEC |
Zacks Reports |
StockTalk |
News |
Chart |
Request a new note
C
A N
S L
I M
|
GPX
-
NYSE
G P Strategies Corp
DIVERSIFIED SERVICES - Education and Training Services
|
$19.70
|
-0.10
-0.51% |
$19.90
|
59,133
78.01% of 50 DAV
50 DAV is 75,800
|
$20.30
-2.96%
|
6/29/2012
|
$18.01
|
PP = $18.15
|
|
MB = $19.06
|
Most Recent Note - 8/21/2012 5:21:27 PM
G - Perched near its 52-week high today, slightly extended from its prior base. Churning above average volume recently without making much meaningful price progress. Prior highs and its 50 DMA line define chart support in the $18 area.
>>> The latest Featured Stock Update with an annotated graph appeared on 8/7/2012. Click here.
View all notes |
Alert me of new notes |
CANSLIM.net Company Profile |
SEC |
Zacks Reports |
StockTalk |
News |
Chart |
Request a new note
C
A N
S L
I M
|
HMSY
-
NASDAQ
H M S Holdings Corp
COMPUTER SOFTWARE and SERVICES - Healthcare Information Service
|
$35.26
|
+0.18
0.51% |
$35.29
|
765,466
85.63% of 50 DAV
50 DAV is 893,900
|
$37.19
-5.19%
|
7/27/2012
|
$33.91
|
PP = $34.83
|
|
MB = $36.57
|
Most Recent Note - 8/22/2012 5:27:45 PM
Y - Pulled back with higher volume today indicative of distributional pressure. Still hovering near its pivot point and perched just -5.7% off its 52-week high. See the latest FSU analysis for more details and a new annotated graph. As previously noted - "Gains above a stock's pivot point must have at least +40% above average volume, preferably greater, to trigger a proper technical buy signal."
>>> The latest Featured Stock Update with an annotated graph appeared on 8/22/2012. Click here.
View all notes |
Alert me of new notes |
CANSLIM.net Company Profile |
SEC |
Zacks Reports |
StockTalk |
News |
Chart |
Request a new note
C
A N
S L
I M
|
LKQ
-
NASDAQ
L K Q Corp
WHOLESALE - Auto Parts
|
$38.97
|
+0.15
0.39% |
$39.20
|
928,140
121.55% of 50 DAV
50 DAV is 763,600
|
$39.19
-0.56%
|
8/9/2012
|
$37.93
|
PP = $37.44
|
|
MB = $39.31
|
Most Recent Note - 8/22/2012 5:29:12 PM
Y - Holding its ground today perched at its 52-week high yet still trading below its "max buy" level. Prior highs in the $37 area define initial support to watch above its 50 DMA line.
>>> The latest Featured Stock Update with an annotated graph appeared on 8/10/2012. Click here.
View all notes |
Alert me of new notes |
CANSLIM.net Company Profile |
SEC |
Zacks Reports |
StockTalk |
News |
Chart |
Request a new note
C
A N
S L
I M
|
Symbol/Exchange
Company Name
Industry Group |
PRICE |
CHANGE
(%Change) |
Day High |
Volume
(% DAV)
(% 50 day avg vol) |
52 Wk Hi
% From Hi |
Featured
Date |
Price
Featured |
Pivot Featured |
|
Max Buy |
MIDD
-
NASDAQ
Middleby Corp
MANUFACTURING - Diversified Machinery
|
$112.10
|
-1.33
-1.17% |
$113.78
|
51,043
51.51% of 50 DAV
50 DAV is 99,100
|
$119.74
-6.38%
|
8/9/2012
|
$118.60
|
PP = $104.92
|
|
MB = $110.17
|
Most Recent Note - 8/20/2012 2:39:34 PM
G - Quietly consolidating, holding its ground today near its 52-week high. Prior highs in the $104 area define initial support to watch on pullbacks.
>>> The latest Featured Stock Update with an annotated graph appeared on 8/13/2012. Click here.
View all notes |
Alert me of new notes |
CANSLIM.net Company Profile |
SEC |
Zacks Reports |
StockTalk |
News |
Chart |
Request a new note
C
A N
S L
I M
|
N
-
NYSE
Netsuite Inc
DIVERSIFIED SERVICES - Business/Management Services
|
$55.58
|
-0.61
-1.09% |
$56.23
|
263,211
35.84% of 50 DAV
50 DAV is 734,400
|
$59.22
-6.15%
|
8/20/2012
|
$55.88
|
PP = $59.32
|
|
MB = $62.29
|
Most Recent Note - 8/20/2012 6:06:22 PM
Y - Color code is changed to yellow with new pivot point cited based on its 8/07/12 high plus 10 cents after several tight weekly closes. Consolidating -5.6% off its 52-week high today with volume totals cooling in recent weeks. See latest FSU analysis for more details and a new annotated graph.
>>> The latest Featured Stock Update with an annotated graph appeared on 8/20/2012. Click here.
View all notes |
Alert me of new notes |
CANSLIM.net Company Profile |
SEC |
Zacks Reports |
StockTalk |
News |
Chart |
Request a new note
C
A N
S L
I M
|
NSM
-
NYSE
Nationstar Mtg Hldgs Inc
FINANCIAL SERVICES - Credit Services
|
$25.86
|
-0.54
-2.05% |
$26.40
|
950,330
117.69% of 50 DAV
50 DAV is 807,500
|
$28.75
-10.05%
|
6/27/2012
|
$20.29
|
PP = $20.46
|
|
MB = $21.48
|
Most Recent Note - 8/22/2012 3:56:49 PM
G - Down today for a 4th consecutive loss since hitting its 52-week high. It is extended from any sound base pattern. Prior highs in the $25 area define near-term support to watch on pullbacks.
>>> The latest Featured Stock Update with an annotated graph appeared on 8/1/2012. Click here.
View all notes |
Alert me of new notes |
CANSLIM.net Company Profile |
SEC |
Zacks Reports |
StockTalk |
News |
Chart |
Request a new note
C
A N
S L
I M
|
OSIS
-
NASDAQ
O S I Systems Inc
ELECTRONICS - Semiconductor Equipment and Mate
|
$73.43
|
+0.53
0.73% |
$73.76
|
49,764
43.50% of 50 DAV
50 DAV is 114,400
|
$75.00
-2.09%
|
8/9/2012
|
$67.71
|
PP = $67.48
|
|
MB = $70.85
|
Most Recent Note - 8/22/2012 5:30:52 PM
G - Hovering near its 52-week high with volume totals cooling. It is slightly extended from its previous base, and prior highs in the $67-68 area define initial support to watch on pullbacks.
>>> The latest Featured Stock Update with an annotated graph appeared on 8/9/2012. Click here.
View all notes |
Alert me of new notes |
CANSLIM.net Company Profile |
SEC |
Zacks Reports |
StockTalk |
News |
Chart |
Request a new note
C
A N
S L
I M
|
RNF
-
NYSE
Rentech Nitrogen Ptnr Lp
CHEMICALS - Agricultural Chemicals
|
$33.25
|
-0.34
-1.01% |
$34.21
|
272,445
62.13% of 50 DAV
50 DAV is 438,500
|
$34.75
-4.32%
|
7/27/2012
|
$29.58
|
PP = $30.60
|
|
MB = $32.13
|
Most Recent Note - 8/21/2012 5:15:12 PM
G - Finished near the session low today with a loss on lighter volume. Encountered distributional pressure after its prior breakout yet found support above prior highs in the $30-31 and then wedged higher.
>>> The latest Featured Stock Update with an annotated graph appeared on 7/31/2012. Click here.
View all notes |
Alert me of new notes |
CANSLIM.net Company Profile |
SEC |
Zacks Reports |
StockTalk |
News |
Chart |
Request a new note
C
A N
S L
I M
|
Symbol/Exchange
Company Name
Industry Group |
PRICE |
CHANGE
(%Change) |
Day High |
Volume
(% DAV)
(% 50 day avg vol) |
52 Wk Hi
% From Hi |
Featured
Date |
Price
Featured |
Pivot Featured |
|
Max Buy |
SWI
-
NYSE
Solarwinds Inc
COMPUTER SOFTWARE and SERVICES - Application Software
|
$54.77
|
-0.51
-0.92% |
$55.37
|
509,703
41.87% of 50 DAV
50 DAV is 1,217,400
|
$56.94
-3.81%
|
7/25/2012
|
$47.82
|
PP = $47.89
|
|
MB = $50.28
|
Most Recent Note - 8/20/2012 4:20:00 PM
G - Volume totals have been cooling in recent weeks while still hovering near its all-time high. Prior highs in the $48 area define initial support to watch on pullbacks.
>>> The latest Featured Stock Update with an annotated graph appeared on 7/30/2012. Click here.
View all notes |
Alert me of new notes |
CANSLIM.net Company Profile |
SEC |
Zacks Reports |
StockTalk |
News |
Chart |
Request a new note
C
A N
S L
I M
|
TDG
-
NYSE
Transdigm Group Inc
AEROSPACE/DEFENSE - Aerospace/Defense Products and; Services
|
$136.58
|
+0.31
0.23% |
$137.05
|
329,905
78.57% of 50 DAV
50 DAV is 419,900
|
$139.37
-2.00%
|
8/16/2012
|
$132.23
|
PP = $136.44
|
|
MB = $143.26
|
Most Recent Note - 8/23/2012 2:49:14 PM
Y - Holding its ground today perched just above its pivot point and only -1.9% off its 52-week high. Volume totals have cooled since its gain on 8/17/12 triggered a technical buy signal. Disciplined investors limit losses if ever any stock falls -7% from their purchase price.
>>> The latest Featured Stock Update with an annotated graph appeared on 8/17/2012. Click here.
View all notes |
Alert me of new notes |
CANSLIM.net Company Profile |
SEC |
Zacks Reports |
StockTalk |
News |
Chart |
Request a new note
C
A N
S L
I M
|
TNGO
-
NASDAQ
Tangoe Inc
COMPUTER SOFTWARE and SERVICES - Technical and System Software
|
$19.87
|
-0.30
-1.49% |
$20.14
|
154,461
36.82% of 50 DAV
50 DAV is 419,500
|
$23.05
-13.80%
|
8/9/2012
|
$21.30
|
PP = $23.10
|
|
MB = $24.26
|
Most Recent Note - 8/23/2012 2:50:30 PM
G - Still quietly slumping below its 50 DMA line, and it faces resistance up to the $23 level which has been a stubborn resistance area in recent months. Volume-driven gains above its pivot point are needed to trigger a proper technical buy signal.
>>> The latest Featured Stock Update with an annotated graph appeared on 7/24/2012. Click here.
View all notes |
Alert me of new notes |
CANSLIM.net Company Profile |
SEC |
Zacks Reports |
StockTalk |
News |
Chart |
Request a new note
C
A N
S L
I M
|
VSI
-
NYSE
Vitamin Shoppe Inc
SPECIALTY RETAIL - Specialty Retail, Other
|
$53.32
|
-1.35
-2.47% |
$54.70
|
418,621
102.05% of 50 DAV
50 DAV is 410,200
|
$61.83
-13.76%
|
6/29/2012
|
$54.93
|
PP = $55.03
|
|
MB = $57.78
|
Most Recent Note - 8/23/2012 2:53:36 PM
G - Slumping below its 50 DMA line this week with a spurt of damaging losses triggering technical sell signals. Its prior low ($52.41 on 7/23/12) defines a near-term support level where any further deterioration would raise more serious concerns.
>>> The latest Featured Stock Update with an annotated graph appeared on 8/2/2012. Click here.
View all notes |
Alert me of new notes |
CANSLIM.net Company Profile |
SEC |
Zacks Reports |
StockTalk |
News |
Chart |
Request a new note
C
A N
S L
I M
|