You are not logged in.
This means you
CAN ONLY VIEW reports that were published prior to Tuesday, March 25, 2025.
You
MUST UPGRADE YOUR MEMBERSHIP if you want to see any current reports.
AFTER MARKET UPDATE - TUESDAY, AUGUST 23RD, 2011
Previous After Market Report Next After Market Report >>>
|
|
|
|
DOW |
+322.11 |
11,176.76 |
+2.97% |
|
Volume |
1,235,805,510 |
+4% |
|
Volume |
2,103,864,800 |
+9% |
|
NASDAQ |
+100.68 |
2,446.06 |
+4.29% |
|
Advancers |
2,581 |
83% |
|
Advancers |
2,151 |
80% |
|
S&P 500 |
+38.53 |
1,162.35 |
+3.43% |
|
Decliners |
473 |
15% |
|
Decliners |
462 |
17% |
|
Russell 2000 |
+31.73 |
683.07 |
+4.87% |
|
52 Wk Highs |
13 |
|
|
52 Wk Highs |
7 |
|
|
S&P 600 |
+17.61 |
374.22 |
+4.94% |
|
52 Wk Lows |
170 |
|
|
52 Wk Lows |
146 |
|
|
 |
Majors Averages Rally With Higher Volume and Better Breadth
Kenneth J. Gruneisen - Passed the CAN SLIM® Master's Exam
Dow Jones Industrial Average, S&P 500 Index, and Nasdaq Composite Index tallied big gains on Tuesday. The indices finished near their session highs with higher volume totals reported on the NYSE and on the Nasdaq exchange, a clear sign of institutional accumulation. Breadth was positive as advancers led decliners by more than 5-1 on the NYSE and by more than 4-1 on the Nasdaq exchange. On the NYSE and on the Nasdaq exchange new 52-week lows totals still solidly outnumbered the new 52-week highs totals. There were 5 high-ranked companies from the CANSLIM.net Leaders List that made new 52-week highs and appeared on the CANSLIM.net BreakOuts Page, down from the prior session total of 8 stocks. Any sustainable rally requires a healthy crop of strong leaders hitting new 52-week highs, so it is of concern when leadership remains scant! There were gains for all of the 6 high-ranked leaders currently included on the Featured Stocks Page.
An earthquake rattled buildings in New York, but could not shake the stock market from striding sharply higher. A report from China got the ball rolling. Data signaled moderate economic growth, not contraction as some had feared. Weak U.S. reports may have raised expectations the Federal Reserve will act later this week to spur the economy. New home sales dropped for the fourth straight month in July, and the Fed Bank of Richmond's business activity index declined to the weakest since June 2009.
Bank stocks had mixed results, even though the FDIC reported its list of "problem" banks declined in the second quarter, the first drop since 2006. Bank of America Corp (BAC -1.9%) fell on persistent concerns the bank will need to raise more capital. Treasuries lost ground after the sale of $35 billion of two-year notes at a record low yield of 0.22%. The 10-year Treasury note was down 12/32 to yield 2.15%.
International Business Machines Corp (IBM +3.4%) added 40 points to the Dow, and Chevron Corp (CVX +4.31%) was also among the big gainers.
Gold prices dropped for the first time in seven sessions, retreating from a new record near $1,900 per ounce.. Newmont Mining Corp (NEM -2.56%) pulled back after challenging multi-year highs As previously noted, in Monday's Mid-Day BreakOuts Report 10 of the 20 high-ranked stocks that met the screening criteria hailed from the Mining - Gold/Silver/Gems industry group.
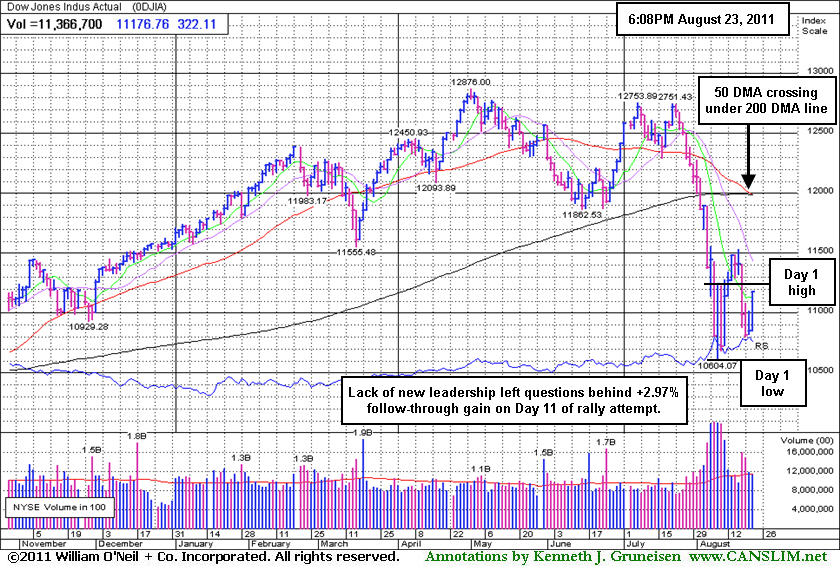
The market environment (M criteria) still calls for patience and great caution, since there were some shortcomings to the follow-through day (FTD) of big gains on higher volume. Despite the major averages' big gains, the dearth of leadership (few stocks hitting new 52-week highs) suggests that there may not be a healthy crop of leaders showing sufficient strength to allow the major averages to sustain a meaningful advance. One may note that the major averages failed to finish higher than their respective closes after Day 1 (8/09/11) of the current rally attempt, so the late FTD arriving on Day 11 was hardly a very reassuring sign of the market building great upward momentum. The indices also remain well below their respective 200-day moving average (DMA) lines, and to be considered truly "healthy" they would need to rebound above their long-term averages.
The August 2011 issue of CANSLIM.net News is now available (click here). Links to all prior reports are available on the Premium Member Homepage.
PICTURED: The Dow closed at its high for the day, up 322 points at 11,176 as buyers piled on in late trading.
|
 Kenneth J. Gruneisen started out as a licensed stockbroker in August 1987, a couple of months prior to the historic stock market crash that took the Dow Jones Industrial Average down -22.6% in a single day. He has published daily fact-based fundamental and technical analysis on high-ranked stocks online for two decades. Through FACTBASEDINVESTING.COM, Kenneth provides educational articles, news, market commentary, and other information regarding proven investment systems that work in good times and bad.
Comments contained in the body of this report are technical opinions only and are not necessarily those of Gruneisen Growth Corp. The material herein has been obtained from sources believed to be reliable and accurate, however, its accuracy and completeness cannot be guaranteed. Our firm, employees, and customers may effect transactions, including transactions contrary to any recommendation herein, or have positions in the securities mentioned herein or options with respect thereto. Any recommendation contained in this report may not be suitable for all investors and it is not to be deemed an offer or solicitation on our part with respect to the purchase or sale of any securities. |
|
 |
Most Groups Enjoyed Rebound From 2011 Lows
Kenneth J. Gruneisen - Passed the CAN SLIM® Master's Exam
The Gold & Silver Index ($XAU -2.54%) backpedaled and gave up most of the prior session's gains while investors showed a stronger appetite for stocks in most other industry groups. The Broker/Dealer Index ($XBD +3.82%), Bank Index ($BKX +4.02%), and Retail Index ($RLX +4.30%) provided a lot of positive influence on the major averages. The tech sector also rallied sharply as the Networking Index ($NWX +4.84%), and Internet Index ($IIX +5.06%), Semiconductor Index ($SOX +5.21%), and the Biotechnology Index ($BTK +3.95%) unanimously charged up from their 2011 lows. Energy-related shares also enjoyed big gains as the Oil Services Index ($OSX +4.89%) and Integrated Oil Index ($XOI +3.98%) rebounded, and the Healthcare Index ($HMO +5.01%) rounded out a widely positive session with a solid gain.
Charts courtesy www.stockcharts.com
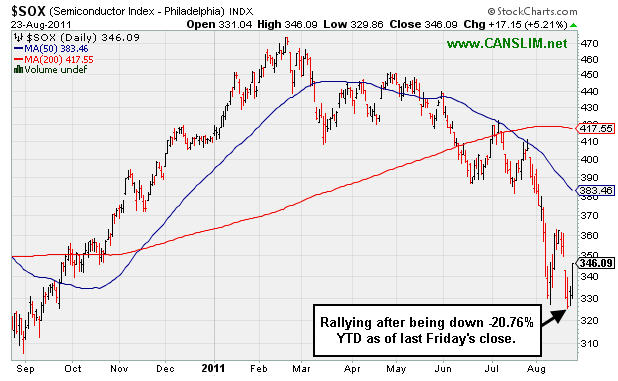
PICTURED: The Semiconductor Index ($SOX +5.21%) is rebounding after being down -20.76% YTD as of last Friday's close. It is disconcerting that semiconductor stocks reached the Bear Market threshold, since the tech sector is typically a key contributor in bullish markets.
| Oil Services |
$OSX |
222.08 |
+10.36 |
+4.89% |
-9.40% |
| Healthcare |
$HMO |
1,943.13 |
+92.72 |
+5.01% |
+14.84% |
| Integrated Oil |
$XOI |
1,123.15 |
+43.00 |
+3.98% |
-7.42% |
| Semiconductor |
$SOX |
346.09 |
+17.15 |
+5.21% |
-15.96% |
| Networking |
$NWX |
227.86 |
+10.52 |
+4.84% |
-18.78% |
| Internet |
$IIX |
268.48 |
+12.93 |
+5.06% |
-12.75% |
| Broker/Dealer |
$XBD |
87.03 |
+3.21 |
+3.82% |
-28.38% |
| Retail |
$RLX |
489.64 |
+20.19 |
+4.30% |
-3.69% |
| Gold & Silver |
$XAU |
211.60 |
-5.52 |
-2.54% |
-6.61% |
| Bank |
$BKX |
36.51 |
+1.41 |
+4.02% |
-30.07% |
| Biotech |
$BTK |
1,135.60 |
+43.11 |
+3.95% |
-12.49% |
|
|
|
 |
Outlier's Gains Have Distanced It From Prior Base
Kenneth J. Gruneisen - Passed the CAN SLIM® Master's Exam
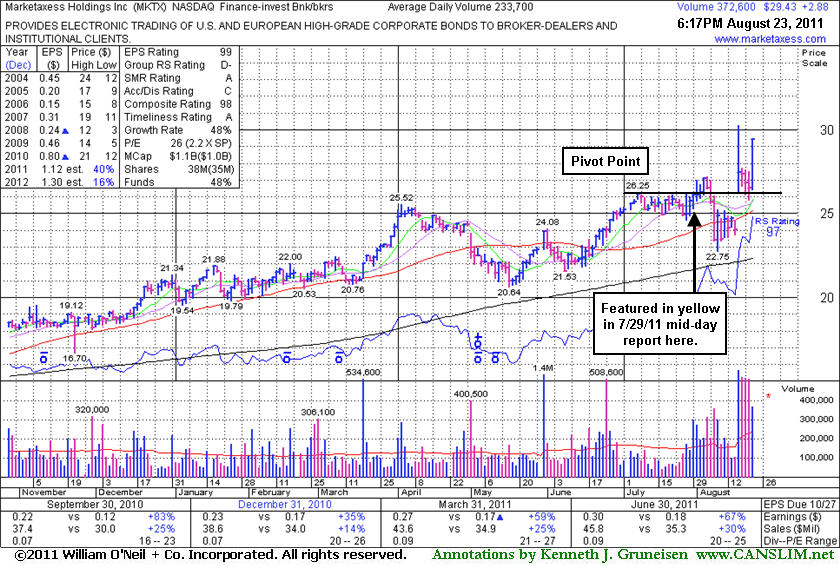
Marketaxess Holdings Inc (MKTX +$2.88 or +10.85% to $29.43) rallied considerably higher with above average volume for a new high close today after 3 consecutive small losses with above average volume. It held its ground stubbornly while consolidating since a considerable gain with heavy volume on 8/17/11 for a new 52-week high on news this operator of an electronic trading system for fixed-income securities is exploring a sale of the company. Its last appearance was in this FSU section on 8/10/11 with an annotated graph under the headline, "Distributional Action Followed Half-Hearted Breakout Attempt", as it slumped under its 50-day moving average (DMA) line. It proved resilient near that short-term average, although concerned were raised because healthy stocks do not often dip -7% below their pivot point. No overhead supply exists to hinder its progress, but it is quickly getting extended more than +5% above its prior highs. The M criteria has also been arguing against new buying efforts, with MKTX's exceptional strength making it a strong outlier in a market not offering investors favorable odds.
In an earlier appearance in this FSU section on 7/29/11 an annotated graph was included under the headline, "Potential Candidate in Tight Consolidation After Cup", and on 8/01/11 it posted a small gain after churning heavy volume and touching a new 52-week high, but didn't clear its pivot point. On 8/03/11 it posted a solid gain today for a new high with only +25% above average volume, below the volume threshold for a proper technical buy signal. Damaging distributional losses then followed and were noted. All prior notes can be reviewed on the Company Profile page under the "View All Notes" tab. The "Featured Articles and Daily Graphs" tab on the Company Profile page allows members to view all of the previous detailed analysis and annotated graphs published on any stocks we have covered.
MKTX has earned high ranks and reasonably satisfies the guidelines concerning quarterly and annual earnings (C and A criteria), however a downturn in FY '08 was previously noted as a flaw. Additionally, the Finance - Investment Bankers industry group currently has a Relative Strength rating of D- which indicates the group has been a poor performer rather than a strong leader (L criteria). The number of top-rated funds owning its shares rose from 195 in Dec '10 to 227 in Jun '11, a reassuring sign concerning the I criteria.
|
|
|
Color Codes Explained :
Y - Better candidates highlighted by our
staff of experts.
G - Previously featured
in past reports as yellow but may no longer be buyable under the
guidelines.
***Last / Change / Volume data in this table is the closing quote data***
Symbol/Exchange
Company Name
Industry Group |
PRICE |
CHANGE
(%Change) |
Day High |
Volume
(% DAV)
(% 50 day avg vol) |
52 Wk Hi
% From Hi |
Featured
Date |
Price
Featured |
Pivot Featured |
|
Max Buy |
EXLS
-
NASDAQ
Exlservice Holdings Inc
DIVERSIFIED SERVICES - Business/Management Services
|
$24.86
|
+1.21
5.12% |
$24.93
|
104,797
120.18% of 50 DAV
50 DAV is 87,200
|
$26.46
-6.05%
|
8/2/2011
|
$24.85
|
PP = $24.85
|
|
MB = $26.09
|
 Most Recent Note - 8/23/2011 5:42:55 PM
Y - Rallied up from its 50 DMA line and closed near the session high today with a solid gain on higher volume, finishing a penny above its pivot point. Recent low and 50 DMA line define important support to watch above its 200 DMA line.
>>> The latest Featured Stock Update with an annotated graph appeared on 8/15/2011. Click here.
View all notes |
Alert me of new notes |
CANSLIM.net Company Profile |
SEC |
Zacks Reports |
StockTalk |
News |
Chart |
Request a new note
C
A N
S L
I M


|
FCFS
-
NASDAQ
First Cash Financial Svs
SPECIALTY RETAIL - Specialty Retail, Other
|
$43.29
|
+1.19
2.83% |
$43.39
|
600,949
198.46% of 50 DAV
50 DAV is 302,800
|
$47.80
-9.44%
|
5/31/2011
|
$42.00
|
PP = $40.23
|
|
MB = $42.24
|
Most Recent Note - 8/23/2011 5:44:25 PM
G - Rebounded for a solid gain on higher volume today, finding support at its 50 DMA line after 6 consecutive losses. Prior chart lows near $37-38 define support to watch.
>>> The latest Featured Stock Update with an annotated graph appeared on 8/22/2011. Click here.
View all notes |
Alert me of new notes |
CANSLIM.net Company Profile |
SEC |
Zacks Reports |
StockTalk |
News |
Chart |
Request a new note
C
A N
S L
I M
|
JCOM
-
NASDAQ
J 2 Global Communication
INTERNET - Internet Software and Services
|
$29.59
|
+1.65
5.91% |
$29.65
|
382,224
117.72% of 50 DAV
50 DAV is 324,700
|
$31.72
-6.72%
|
8/8/2011
|
$30.38
|
PP = $29.31
|
|
MB = $30.78
|
Most Recent Note - 8/23/2011 5:46:34 PM
G - Posted a considerable gain today and closed near the session high after rebounding well above its 50 and 200 DMA lines, helping its outlook. It marked its 3rd best close since its 8/03/11 gap up.
>>> The latest Featured Stock Update with an annotated graph appeared on 8/19/2011. Click here.
View all notes |
Alert me of new notes |
CANSLIM.net Company Profile |
SEC |
Zacks Reports |
StockTalk |
News |
Chart |
Request a new note
C
A N
S L
I M
|
MA
-
NYSE
Mastercard Inc Cl A
DIVERSIFIED SERVICES - Business/Management Services
|
$322.39
|
+16.39
5.36% |
$322.49
|
1,071,845
72.11% of 50 DAV
50 DAV is 1,486,300
|
$340.42
-5.30%
|
8/3/2011
|
$324.82
|
PP = $322.38
|
|
MB = $338.50
|
Most Recent Note - 8/23/2011 5:48:07 PM
Y - Posted a big gain on lighter than average volume today and finished -5.3% off its 8/03/11 all-time high after consolidating and finding support near its 50 DMA line.
>>> The latest Featured Stock Update with an annotated graph appeared on 8/16/2011. Click here.
View all notes |
Alert me of new notes |
CANSLIM.net Company Profile |
SEC |
Zacks Reports |
StockTalk |
News |
Chart |
Request a new note
C
A N
S L
I M
|
MG
-
NYSE
Mistras Group Inc
DIVERSIFIED SERVICES - Bulding and Faci;ity Management Services
|
$19.37
|
+1.53
8.58% |
$19.43
|
358,772
257.55% of 50 DAV
50 DAV is 139,300
|
$19.85
-2.42%
|
8/10/2011
|
$17.89
|
PP = $17.58
|
|
MB = $18.46
|
Most Recent Note - 8/23/2011 5:49:34 PM
G - Considerable gain today with higher volume, rising near its all-time high. Previous resistance in the $17-18 area defined important chart support after encountering mild distributional pressure.
>>> The latest Featured Stock Update with an annotated graph appeared on 8/11/2011. Click here.
View all notes |
Alert me of new notes |
CANSLIM.net Company Profile |
SEC |
Zacks Reports |
StockTalk |
News |
Chart |
Request a new note
C
A N
S L
I M
|
Symbol/Exchange
Company Name
Industry Group |
PRICE |
CHANGE
(%Change) |
Day High |
Volume
(% DAV)
(% 50 day avg vol) |
52 Wk Hi
% From Hi |
Featured
Date |
Price
Featured |
Pivot Featured |
|
Max Buy |
MKTX
-
NASDAQ
Marketaxess Holdings Inc
FINANCIAL SERVICES - Investment Brokerage - Nationa
|
$29.43
|
+2.88
10.85% |
$29.48
|
386,416
165.35% of 50 DAV
50 DAV is 233,700
|
$30.25
-2.71%
|
7/29/2011
|
$25.87
|
PP = $26.35
|
|
MB = $27.67
|
Most Recent Note - 8/23/2011 6:31:10 PM
G - Rallied with above average volume today for a new high close after 3 consecutive small losses with above average volume. Extended from its prior base. See the latest FSU analysis for more details and a new annotated graph.
>>> The latest Featured Stock Update with an annotated graph appeared on 8/23/2011. Click here.
View all notes |
Alert me of new notes |
CANSLIM.net Company Profile |
SEC |
Zacks Reports |
StockTalk |
News |
Chart |
Request a new note
C
A N
S L
I M
|
|
|
|
THESE ARE NOT BUY RECOMMENDATIONS!
Comments contained in the body of this report are technical
opinions only. The material herein has been obtained
from sources believed to be reliable and accurate, however,
its accuracy and completeness cannot be guaranteed.
This site is not an investment advisor, hence it does
not endorse or recommend any securities or other investments.
Any recommendation contained in this report may not
be suitable for all investors and it is not to be deemed
an offer or solicitation on our part with respect to
the purchase or sale of any securities. All trademarks,
service marks and trade names appearing in this report
are the property of their respective owners, and are
likewise used for identification purposes only.
This report is a service available
only to active Paid Premium Members.
You may opt-out of receiving report notifications
at any time. Questions or comments may be submitted
by writing to Premium Membership Services 665 S.E. 10 Street, Suite 201 Deerfield Beach, FL 33441-5634 or by calling 1-800-965-8307
or 954-785-1121.
|
|
|

