***Last / Change / Volume data in this table is the closing quote data***
Symbol/Exchange
Company Name
Industry Group |
PRICE |
CHANGE
(%Change) |
Day High |
Volume
(% DAV)
(% 50 day avg vol) |
52 Wk Hi
% From Hi |
Featured
Date |
Price
Featured |
Pivot Featured |
|
Max Buy |
ABV
-
NYSE
Comp De Bebidas Adr
FOOD and BEVERAGE - Beverages - Brewers
|
$109.02
|
-1.00
-0.91% |
$111.10
|
918,337
141.85% of 50 DAV
50 DAV is 647,400
|
$112.60
-3.18%
|
6/29/2010
|
$104.74
|
PP = $109.33
|
|
MB = $114.80
|
 Most Recent Note - 8/23/2010 12:32:25 PM
G - This Brazil-based beverage firm is perched near its all-time high. Color code was changed to green despite its recent resilience, as fundamental concerns were raised as for the quarter ended June 30, 2010 it reported +19% earnings on +16% sales revenues, below the +25% guidelines.
>>> The latest Featured Stock Update with an annotated graph appeared on 8/18/2010. Click here.
View all notes |
Alert me of new notes |
CANSLIM.net Company Profile |
SEC |
Zacks Reports |
StockTalk |
News |
Chart |
Request a new note
C
A N
S L
I M


|
BIDU
-
NASDAQ
Baidu Inc Ads
INTERNET - Internet Information Providers
|
$79.37
|
-2.80
-3.41% |
$81.39
|
10,218,533
92.07% of 50 DAV
50 DAV is 11,098,600
|
$88.32
-10.13%
|
7/14/2010
|
$75.03
|
PP = $78.59
|
|
MB = $82.52
|
Most Recent Note - 8/23/2010 5:04:03 PM
G - Loss today on near average volume, slumping further below its "max buy" level, however more time is needed for it to form a sound new base. Volume totals have been cooling while it consolidates above prior highs that define technical support along with its 50 DMA line.
>>> The latest Featured Stock Update with an annotated graph appeared on 8/13/2010. Click here.
View all notes |
Alert me of new notes |
CANSLIM.net Company Profile |
SEC |
Zacks Reports |
StockTalk |
News |
Chart |
Request a new note
C
A N
S L
I M
|
CACC
-
NASDAQ
Credit Acceptance Corp
FINANCIAL SERVICES - Credit Services
|
$59.13
|
+0.01
0.02% |
$60.34
|
13,021
24.02% of 50 DAV
50 DAV is 54,200
|
$61.41
-3.71%
|
7/29/2010
|
$52.04
|
PP = $54.07
|
|
MB = $56.77
|
Most Recent Note - 8/20/2010 4:39:44 PM
G - Rebounded and closed near the session high today. Extended from its prior base, previous resistance near $54 defines initial chart support to watch.
>>> The latest Featured Stock Update with an annotated graph appeared on 8/2/2010. Click here.
View all notes |
Alert me of new notes |
CANSLIM.net Company Profile |
SEC |
Zacks Reports |
StockTalk |
News |
Chart |
Request a new note
C
A N
S L
I M
|
CRM
-
NYSE
Salesforce.Com Inc
INTERNET - Internet Software and Services
|
$112.28
|
-0.47
-0.42% |
$113.40
|
6,783,707
281.93% of 50 DAV
50 DAV is 2,406,200
|
$112.99
-0.63%
|
6/2/2010
|
$88.44
|
PP = $89.60
|
|
MB = $94.08
|
Most Recent Note - 8/23/2010 12:36:57 PM
G - Pulling back today after a gap up on 8/20/10 for a considerable gain and new all-time high. It reported sales +25% and earnings +0% versus the year ago period ended July 31st, marking its second consecutive quarterly comparison with earnings per share below the +25% guideline.
>>> The latest Featured Stock Update with an annotated graph appeared on 8/16/2010. Click here.
View all notes |
Alert me of new notes |
CANSLIM.net Company Profile |
SEC |
Zacks Reports |
StockTalk |
News |
Chart |
Request a new note
C
A N
S L
I M
|
EGO
-
NYSE
Eldorado Gold Corp
METALS and MINING - Gold
|
$18.29
|
-0.13
-0.71% |
$18.47
|
1,921,727
46.06% of 50 DAV
50 DAV is 4,172,600
|
$19.07
-4.09%
|
8/19/2010
|
$18.25
|
PP = $19.17
|
|
MB = $20.13
|
Most Recent Note - 8/20/2010 4:44:55 PM
Y - Quietly consolidating, this Canada-based mining firm has built a longer base-on-base type pattern. It was featured in the 8/19/10 mid-day report (read here) in yellow with a pivot point based on its 52-week high plus ten cents. EGO reported great sales and earnings increases in Mar and Jun '10 quarterly comparisons.
>>> The latest Featured Stock Update with an annotated graph appeared on 8/19/2010. Click here.
View all notes |
Alert me of new notes |
CANSLIM.net Company Profile |
SEC |
Zacks Reports |
StockTalk |
News |
Chart |
Request a new note
C
A N
S L
I M
|
Symbol/Exchange
Company Name
Industry Group |
PRICE |
CHANGE
(%Change) |
Day High |
Volume
(% DAV)
(% 50 day avg vol) |
52 Wk Hi
% From Hi |
Featured
Date |
Price
Featured |
Pivot Featured |
|
Max Buy |
FFIV
-
NASDAQ
F 5 Networks Inc
INTERNET - Internet Software and Services
|
$89.27
|
-1.77
-1.94% |
$91.60
|
1,271,534
74.87% of 50 DAV
50 DAV is 1,698,300
|
$92.70
-3.70%
|
6/16/2010
|
$74.50
|
PP = $74.10
|
|
MB = $77.81
|
Most Recent Note - 8/20/2010 4:48:24 PM
G - Closed at a new high on its weekly chart with this week's gain on light volume. Recently noted as -"extended from any sound base after recent volume-driven gains, it could go on to produce more climactic gains."
>>> The latest Featured Stock Update with an annotated graph appeared on 8/4/2010. Click here.
View all notes |
Alert me of new notes |
CANSLIM.net Company Profile |
SEC |
Zacks Reports |
StockTalk |
News |
Chart |
Request a new note
C
A N
S L
I M
|
FOSL
-
NASDAQ
Fossil Inc
CONSUMER DURABLES - Recreational Goods, Other
|
$44.36
|
+0.21
0.48% |
$45.04
|
731,214
86.65% of 50 DAV
50 DAV is 843,900
|
$46.30
-4.19%
|
8/10/2010
|
$45.54
|
PP = $42.69
|
|
MB = $44.82
|
Most Recent Note - 8/20/2010 4:56:18 PM
Y - Consolidating quietly in a tight range since its considerable "breakaway gap" on 8/10/10 for a new 52-week high and all-time high.
>>> The latest Featured Stock Update with an annotated graph appeared on 8/11/2010. Click here.
View all notes |
Alert me of new notes |
CANSLIM.net Company Profile |
SEC |
Zacks Reports |
StockTalk |
News |
Chart |
Request a new note
C
A N
S L
I M
|
GMCR
-
NASDAQ
Green Mtn Coffee Roastrs
FOOD and BEVERAGE - Processed and Packaged Goods
|
$32.75
|
+0.29
0.89% |
$33.17
|
1,618,366
68.78% of 50 DAV
50 DAV is 2,352,800
|
$33.98
-3.62%
|
8/17/2010
|
$33.62
|
PP = $33.30
|
|
MB = $34.97
|
Most Recent Note - 8/20/2010 4:58:27 PM
Y - Quietly consolidating since featured in yellow again in the 8/17/10 mid-day report as it hit a new 52-week high, rising from a 19-week cup shaped pattern without forming a handle. It showed great resilience in rebounding from lows since it was dropped from the Featured Stocks list on 4/28/10. The number of top-rated funds owning its shares rose to 124 in Jun '10 from 111 in Mar '10. GMCR rallied more than 5-fold from its November '08 low.
>>> The latest Featured Stock Update with an annotated graph appeared on 8/17/2010. Click here.
View all notes |
Alert me of new notes |
CANSLIM.net Company Profile |
SEC |
Zacks Reports |
StockTalk |
News |
Chart |
Request a new note
C
A N
S L
I M
|
MELI
-
NASDAQ
Mercadolibre Inc
INTERNET - Internet Software and; Services
|
$68.09
|
-1.57
-2.25% |
$70.80
|
688,163
65.60% of 50 DAV
50 DAV is 1,049,000
|
$70.32
-3.17%
|
5/13/2010
|
$54.21
|
PP = $55.85
|
|
MB = $58.64
|
Most Recent Note - 8/23/2010 5:06:31 PM
G - Hit a new 52-week high today after a gap up, then negatively reversed. It has been noted - "Extended from any sound base. Prior highs in the $62 area define initial chart support."
>>> The latest Featured Stock Update with an annotated graph appeared on 7/23/2010. Click here.
View all notes |
Alert me of new notes |
CANSLIM.net Company Profile |
SEC |
Zacks Reports |
StockTalk |
News |
Chart |
Request a new note
C
A N
S L
I M
|
MRX
-
NYSE
Medicis Pharmaceut Cl A
DRUGS - Biotechnology
|
$26.88
|
-0.18
-0.67% |
$27.44
|
649,308
57.89% of 50 DAV
50 DAV is 1,121,700
|
$28.15
-4.51%
|
8/12/2010
|
$26.88
|
PP = $26.71
|
|
MB = $28.05
|
Most Recent Note - 8/23/2010 5:07:46 PM
Y - Small gap up today was erased as it reversed and ended with a loss on light volume. The high-ranked Medical - Ethical Drugs firm is holding its ground above prior chart highs since its 8/06/10 breakout from a sound base.
>>> The latest Featured Stock Update with an annotated graph appeared on 8/12/2010. Click here.
View all notes |
Alert me of new notes |
CANSLIM.net Company Profile |
SEC |
Zacks Reports |
StockTalk |
News |
Chart |
Request a new note
C
A N
S L
I M
|
Symbol/Exchange
Company Name
Industry Group |
PRICE |
CHANGE
(%Change) |
Day High |
Volume
(% DAV)
(% 50 day avg vol) |
52 Wk Hi
% From Hi |
Featured
Date |
Price
Featured |
Pivot Featured |
|
Max Buy |
MWIV
-
NASDAQ
M W I Veterinary Supply
HEALTH SERVICES - Medical Instruments and; Supplies
|
$53.21
|
+0.95
1.82% |
$53.74
|
90,789
118.52% of 50 DAV
50 DAV is 76,600
|
$54.48
-2.33%
|
7/29/2010
|
$52.05
|
PP = $52.09
|
|
MB = $54.69
|
Most Recent Note - 8/23/2010 5:09:16 PM
Y - Gapped up for a gain today with above average volume and very little resistance remains. Repaired its 50 DMA line violation with solid gains on volume last week, bringing an impressive technical improvement. Recent lows in the $46 area define an important chart support level.
>>> The latest Featured Stock Update with an annotated graph appeared on 7/30/2010. Click here.
View all notes |
Alert me of new notes |
CANSLIM.net Company Profile |
SEC |
Zacks Reports |
StockTalk |
News |
Chart |
Request a new note
C
A N
S L
I M
|
NEM
-
NYSE
Newmont Mining Corp
METALS and MINING - Gold
|
$57.58
|
-0.44
-0.76% |
$58.05
|
3,688,866
47.93% of 50 DAV
50 DAV is 7,696,100
|
$63.38
-9.15%
|
6/22/2010
|
$59.60
|
PP = $59.67
|
|
MB = $62.65
|
Most Recent Note - 8/20/2010 5:11:34 PM
Y - Near its 50 DMA line now after a few weeks of consolidation with volume totals cooling since it was hit with heavy distribution in late July.
>>> The latest Featured Stock Update with an annotated graph appeared on 8/6/2010. Click here.
View all notes |
Alert me of new notes |
CANSLIM.net Company Profile |
SEC |
Zacks Reports |
StockTalk |
News |
Chart |
Request a new note
C
A N
S L
I M
|
NEOG
-
NASDAQ
Neogen Corp
DRUGS - Diagnostic Substances
|
$28.56
|
+0.19
0.67% |
$28.92
|
78,624
94.96% of 50 DAV
50 DAV is 82,800
|
$30.39
-6.02%
|
7/22/2010
|
$27.19
|
PP = $27.87
|
|
MB = $29.26
|
Most Recent Note - 8/20/2010 5:14:11 PM
Y- Color code is changed to yellow while consolidating in a healthy fashion just above its 50 DMA line and prior highs in the $27 area defining important technical support.
>>> The latest Featured Stock Update with an annotated graph appeared on 8/20/2010. Click here.
View all notes |
Alert me of new notes |
CANSLIM.net Company Profile |
SEC |
Zacks Reports |
StockTalk |
News |
Chart |
Request a new note
C
A N
S L
I M
|
NFLX
-
NASDAQ
Netflix Inc
SPECIALTY RETAIL - Music and Video Stores
|
$126.90
|
-3.06
-2.35% |
$132.44
|
3,838,349
86.72% of 50 DAV
50 DAV is 4,426,300
|
$140.90
-9.94%
|
8/10/2010
|
$124.05
|
PP = $124.00
|
|
MB = $130.20
|
Most Recent Note - 8/23/2010 5:11:22 PM
Y- After a small gap up today it reversed into the red for a loss on below average volume. Last week it found support near its prior high of $124 noted as an important support level to watch.
>>> The latest Featured Stock Update with an annotated graph appeared on 8/10/2010. Click here.
View all notes |
Alert me of new notes |
CANSLIM.net Company Profile |
SEC |
Zacks Reports |
StockTalk |
News |
Chart |
Request a new note
C
A N
S L
I M
|
ROVI
-
NASDAQ
Rovi Corp
COMPUTER SOFTWARE andamp; SERVICES - Security Software andamp; Services
|
$43.30
|
+0.21
0.49% |
$43.81
|
668,469
59.56% of 50 DAV
50 DAV is 1,122,300
|
$44.96
-3.69%
|
6/3/2010
|
$38.70
|
PP = $40.16
|
|
MB = $42.17
|
Most Recent Note - 8/20/2010 5:18:50 PM
G - Today it gapped down then managed a positive reversal and closed at the session high. Prior highs in the $40 area and its 50 DMA line define chart support.
>>> The latest Featured Stock Update with an annotated graph appeared on 7/21/2010. Click here.
View all notes |
Alert me of new notes |
CANSLIM.net Company Profile |
SEC |
Zacks Reports |
StockTalk |
News |
Chart |
Request a new note
C
A N
S L
I M
|
Symbol/Exchange
Company Name
Industry Group |
PRICE |
CHANGE
(%Change) |
Day High |
Volume
(% DAV)
(% 50 day avg vol) |
52 Wk Hi
% From Hi |
Featured
Date |
Price
Featured |
Pivot Featured |
|
Max Buy |
SHOO
-
NASDAQ
Steven Madden Limited
CONSUMER NON-DURABLES - Textile - Apparel Footwear
|
$35.73
|
-0.60
-1.65% |
$37.03
|
263,179
61.39% of 50 DAV
50 DAV is 428,700
|
$40.98
-12.81%
|
8/5/2010
|
$39.55
|
PP = $41.08
|
|
MB = $43.13
|
Most Recent Note - 8/20/2010 5:21:28 PM
G -Consolidating just above its 50 DMA line with volume totals cooling, finishing -11.5% off its 52-week high.
>>> The latest Featured Stock Update with an annotated graph appeared on 8/5/2010. Click here.
View all notes |
Alert me of new notes |
CANSLIM.net Company Profile |
SEC |
Zacks Reports |
StockTalk |
News |
Chart |
Request a new note
C
A N
S L
I M
|
VIT
-
NYSE
Vanceinfo Tech Inc Ads
COMPUTER SOFTWARE and SERVICES - Business Software and Services
|
$27.77
|
+0.43
1.57% |
$28.12
|
640,802
121.11% of 50 DAV
50 DAV is 529,100
|
$27.96
-0.68%
|
7/8/2010
|
$25.20
|
PP = $26.58
|
|
MB = $27.91
|
Most Recent Note - 8/23/2010 5:17:53 PM
Y - Hit a new 52-week high today with its gain backed by +21% above average volume. No resistance remains due to overhead supply. Found support near its 50 DMA line last week after enduring distributional pressure.
>>> The latest Featured Stock Update with an annotated graph appeared on 7/26/2010. Click here.
View all notes |
Alert me of new notes |
CANSLIM.net Company Profile |
SEC |
Zacks Reports |
StockTalk |
News |
Chart |
Request a new note
C
A N
S L
I M
|
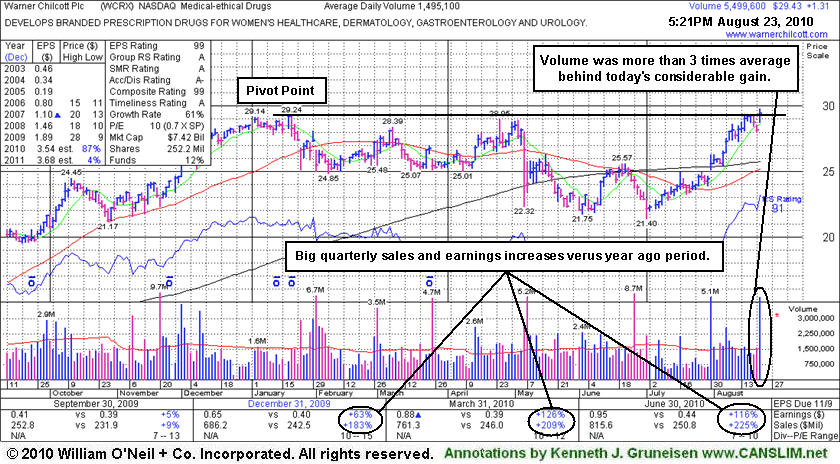
WCRX
-
NASDAQ
Warner Chilcott Plc
DRUGS - Drug Manufacturers - Other
|
$29.43
|
+1.31
4.66% |
$29.81
|
5,536,810
370.33% of 50 DAV
50 DAV is 1,495,100
|
$29.40
0.10%
|
8/23/2010
|
$29.54
|
PP = $29.34
|
|
MB = $30.81
|
Most Recent Note - 8/23/2010 4:57:00 PM
Y - Reported huge sales revenues and earnings increases in the Mar and Jun '10 quarters, so fundamentals are currently strong. It was featured in yellow in the mid-day report while hitting a new all-time high today (read here), rising from a cup shaped base formed since it was noted in the 5/06/10 mid-day report - "Earnings and sales revenues history has been below guidelines of the fact-based system, yet showed drastic increases in the quarter ended Dec 31, 2010. It encountered stubborn resistance in the $29 area since the high-ranked firm hailing from the Medical - Ethical Drugs industry was noted in a handful of Q4 2009 mid-day reports after announcing plans to buy Procter & Gamble Co's prescription drug business in a deal first announced 8/24/09."
>>> The latest Featured Stock Update with an annotated graph appeared on 8/23/2010. Click here.
View all notes |
Alert me of new notes |
CANSLIM.net Company Profile |
SEC |
Zacks Reports |
StockTalk |
News |
Chart |
Request a new note
C
A N
S L
I M
|