You are not logged in.
This means you
CAN ONLY VIEW reports that were published prior to Monday, April 14, 2025.
You
MUST UPGRADE YOUR MEMBERSHIP if you want to see any current reports.
AFTER MARKET UPDATE - FRIDAY, AUGUST 22ND, 2014
Previous After Market Report Next After Market Report >>>
|
|
|
|
DOW |
-38.27 |
17,001.22 |
-0.22% |
|
Volume |
509,193,170 |
-8% |
|
Volume |
1,215,991,740 |
-7% |
|
NASDAQ |
+6.45 |
4,538.55 |
+0.14% |
|
Advancers |
1,125 |
36% |
|
Advancers |
1,412 |
49% |
|
S&P 500 |
-3.96 |
1,988.41 |
-0.20% |
|
Decliners |
1,884 |
60% |
|
Decliners |
1,327 |
47% |
|
Russell 2000 |
+0.31 |
1,160.34 |
+0.03% |
|
52 Wk Highs |
108 |
|
|
52 Wk Highs |
82 |
|
|
S&P 600 |
-0.45 |
667.71 |
-0.07% |
|
52 Wk Lows |
15 |
|
|
52 Wk Lows |
35 |
|
|
 |
Major Averages Paused After Tallying Solid Weekly Gains
Kenneth J. Gruneisen - Passed the CAN SLIM® Master's Exam
Overall, the major averages finished higher for a third consecutive week. The Dow Jones Industrial Average posted a weekly advance of +2%, while the S&P 500 Index and Nasdaq Composite Index each rose +1.7%. Volume totals were lighter on the NYSE and on the Nasdaq exchange on Friday. Decliners led advancers by a 3-2 margin on the NYSE while advancers narrowly led decliners on the NASDAQ exchange. There were 38 high-ranked companies from the CANSLIM.net Leaders List that made new 52-week highs and appeared on the CANSLIM.net BreakOuts Page, down from the prior session total of 53 stocks. New 52-week highs outnumbered new 52-week lows on the NYSE and on the Nasdaq exchange. There were gains for 9 of the 12 of the high-ranked companies currently included on the Featured Stocks Page. The improved action in the broader market (M criteria) has been considered significant enough to shift back to a "confirmed uptrend" while leadership (stocks hitting new 52-week highs) has remained healthy. Remember that disciplined investors buy stocks with superior fundamentals only after they have triggered a proper technical buy signal.
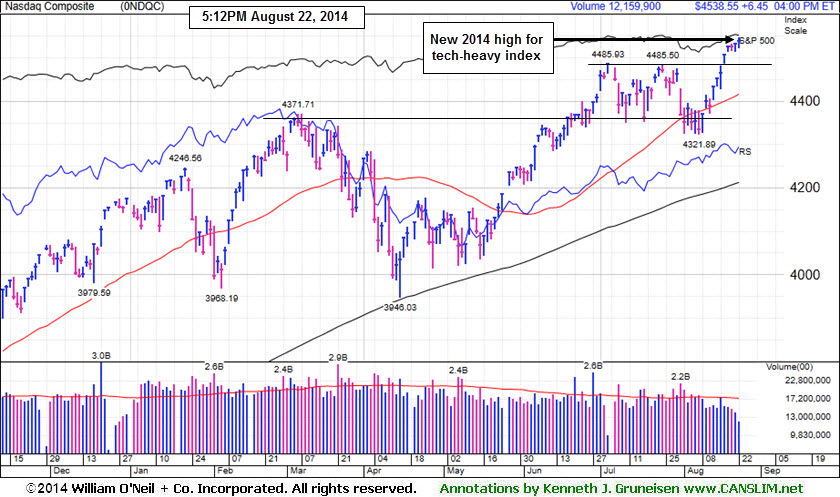
PICTURED: The tech-heavy Nasdaq Composite Index rose 6 points to 4,538 to a new 2014 high.
Stocks took a breather on Friday. The Dow declined 38 points to 17,001. The S&P 500 Index fell 4 points from a fresh record high to close at 1,988.
Equities searched for direction as investors weighed comments from the Fed's annual symposium in Jackson Hole and renewed geopolitical tensions. Fed Chair Janet Yellen said the labor market hasn't fully recovered but officials have begun debating when to raise its key interest rates. In a separate speech ECB President Mario Draghi said he stands ready to further adjust the bank’s policy to help stimulate growth. Meanwhile, geopolitical concerns resurfaced after NATO reported an "alarming build-up" of Russian forces near Ukraine’s border.
Overall, seven of the 10 S&P 500 sectors declined. Transocean (RIG -1.8%) fell while energy was the worst performing group as WTI crude posted its fifth-straight week of losses. Industrials also retreated, led by General Electric's (GE -1.1%) loss. Gains in consumer discretionary helped limit losses. Ross Stores (ROST +7.3%) and The Gap (GPS +5.2%) rallied after both retailers posted better-than-expected earnings results.
Treasuries advanced for a second day. The 10-year note rose 2/32 to yield 2.40%.
The CANSLIM.net Featured Stocks Page shows the most action-worthy candidates and their latest notes and a Headline Link directs members to the latest detailed analysis with data-packed graphs annotated by a Certified expert along with links to additional resources. The Premium Member Homepage includes "dynamic archives" to all prior pay reports published.
|
 Kenneth J. Gruneisen started out as a licensed stockbroker in August 1987, a couple of months prior to the historic stock market crash that took the Dow Jones Industrial Average down -22.6% in a single day. He has published daily fact-based fundamental and technical analysis on high-ranked stocks online for two decades. Through FACTBASEDINVESTING.COM, Kenneth provides educational articles, news, market commentary, and other information regarding proven investment systems that work in good times and bad.
Comments contained in the body of this report are technical opinions only and are not necessarily those of Gruneisen Growth Corp. The material herein has been obtained from sources believed to be reliable and accurate, however, its accuracy and completeness cannot be guaranteed. Our firm, employees, and customers may effect transactions, including transactions contrary to any recommendation herein, or have positions in the securities mentioned herein or options with respect thereto. Any recommendation contained in this report may not be suitable for all investors and it is not to be deemed an offer or solicitation on our part with respect to the purchase or sale of any securities. |
|
 |
Biotech, Retail, and Broker/Dealer Indexes Led Gainers
Kenneth J. Gruneisen - Passed the CAN SLIM® Master's Exam
The Retail Index ($RLX +0.56%) and the Broker/Dealer Index ($XBD +0.40%) helped underpin the major averages' gains while the Bank Index ($BKX -0.15%) edged lower. The Biotechnology Index ($BTK +0.59%) led the tech sector while the Semiconductor Index ($SOX +0.10%) and the Networking Index ($NWX -0.03%) finished flat. Commodity-linked groups had a negative bias as the Oil Services Index ($OSX -0.75%) and the Integrated Oil Index ($XOI -0.70%) lost ground and the Gold & Silver Index ($XAU -0.20%) edged lower.
Charts courtesy www.stockcharts.com
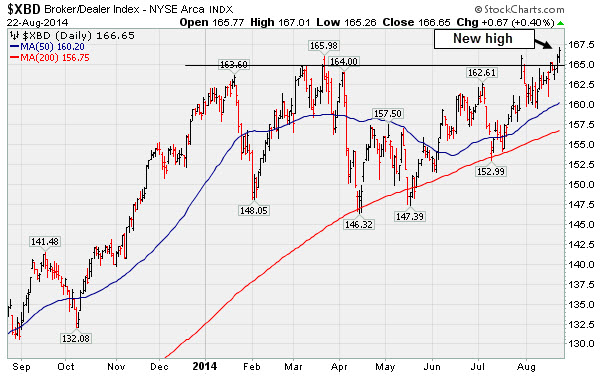
PICTURED: The Broker/Dealer Index ($XBD +0.40%) rallied to a new 2014 high. Regular readers know that strength in financial shares is a very reassuring sign because the financial group has been recognized as a reliable "leading indicator" for the broader market outlook.
| Oil Services |
$OSX |
287.16 |
-2.18 |
-0.75% |
+2.18% |
| Integrated Oil |
$XOI |
1,656.38 |
-11.65 |
-0.70% |
+10.19% |
| Semiconductor |
$SOX |
639.72 |
+0.61 |
+0.10% |
+19.57% |
| Networking |
$NWX |
332.08 |
-0.11 |
-0.03% |
+2.51% |
| Broker/Dealer |
$XBD |
166.65 |
+0.67 |
+0.40% |
+3.79% |
| Retail |
$RLX |
948.95 |
+5.27 |
+0.56% |
+0.97% |
| Gold & Silver |
$XAU |
99.45 |
-0.20 |
-0.20% |
+18.18% |
| Bank |
$BKX |
71.09 |
-0.11 |
-0.15% |
+2.64% |
| Biotech |
$BTK |
2,952.22 |
+17.40 |
+0.59% |
+26.68% |
|
|
|
 |
Small Supply of Shares and Perched Near All-Time Highs
Kenneth J. Gruneisen - Passed the CAN SLIM® Master's Exam
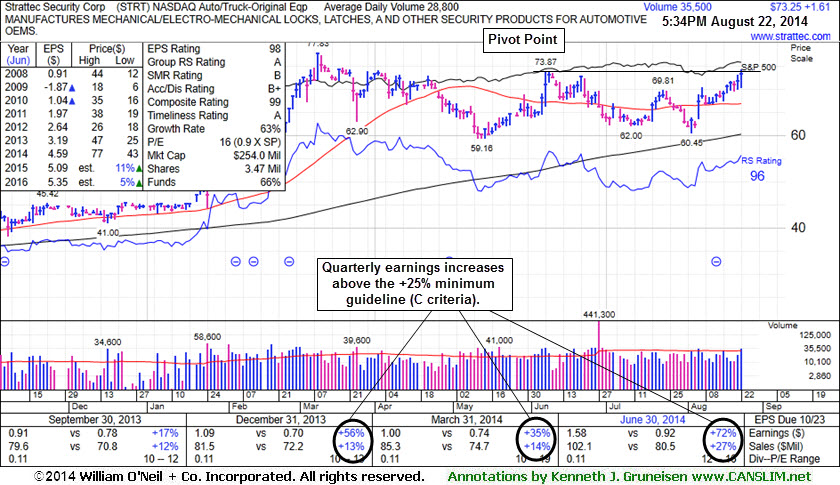
Strattec Security Corp (STRT +$1.61 or +2.25% to $73.25) finished strong after highlighted in yellow with pivot point based on its 6/06/14 high plus 10 cents in the earlier mid-day report (read here). Disciplined investors may watch for subsequent volume-driven gains above the pivot to trigger a proper technical buy signal. It is also perched within close striking distance of a new highs (N criteria) with very little overhead supply to act as resistance.
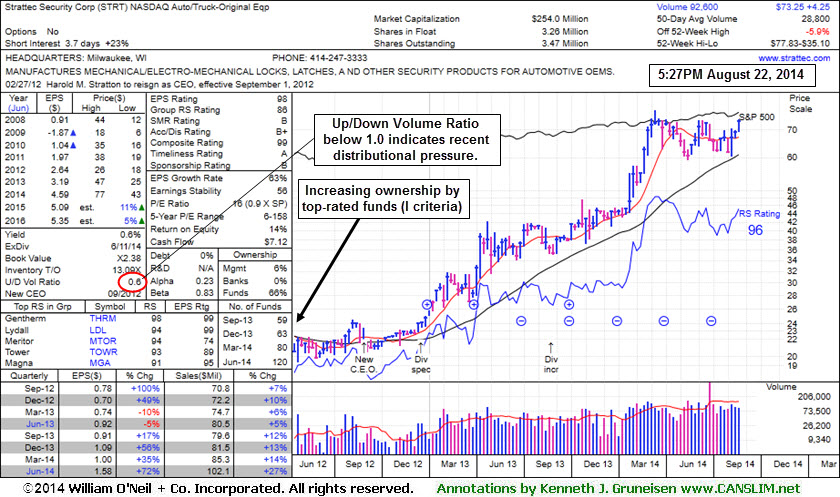
Quarterly earnings increases through Jun '14 above the +25% minimum guideline satisfy the C criteria and its annual earnings (A criteria) history has been strong. Increasing ownership by top-rated funds (I criteria) is a reassuring sign. The number of top-rated funds owning its shares rose from 59 in Sep '14 to 120 in Jun '14, a very reassuring sign concerning the I criteria. However, its current Up/Down Volume Ratio of 0.6 is an unbiased indication its shares have endured distributional pressure over the past 50 days. The Auto/Truck - Original Equipment group's strong Group Relative Strength rank is a reassuring sign concerning the L criteria. The thinly-traded stock has a small supply (S criteria) of only 3.26 million shares in the public float which can contribute to greater price volatility in the event of institutional buying or selling.
|
|
|
Color Codes Explained :
Y - Better candidates highlighted by our
staff of experts.
G - Previously featured
in past reports as yellow but may no longer be buyable under the
guidelines.
***Last / Change / Volume data in this table is the closing quote data***
Symbol/Exchange
Company Name
Industry Group |
PRICE |
CHANGE
(%Change) |
Day High |
Volume
(% DAV)
(% 50 day avg vol) |
52 Wk Hi
% From Hi |
Featured
Date |
Price
Featured |
Pivot Featured |
|
Max Buy |
ACT
-
NYSE
Actavis plc
Medical-Generic Drugs
|
$227.31
|
+1.06
0.47% |
$227.85
|
1,122,008
43.67% of 50 DAV
50 DAV is 2,569,000
|
$230.77
-1.50%
|
6/20/2014
|
$216.53
|
PP = $230.87
|
|
MB = $242.41
|
Most Recent Note - 8/18/2014 7:01:15 PM
G - Inched higher today for as 5th consecutive gain on light volume, rebounding above its 50 DMA line helping its outlook to improve. Reported earnings +70% on +34% sales revenues for the Jun '14 quarter.
>>> FEATURED STOCK ARTICLE : Enduring Distributional Pressure While Sputtering Near 50-Day Average - 8/5/2014
View all notes |
Set NEW NOTE alert |
CANSLIM.net Company Profile |
SEC
News |
Chart |
Request a new note
C
A N
S L
I M


|
AFSI
-
NASDAQ
Amtrust Financial Svcs
INSURANCE - Property and; Casualty Insurance
|
$43.88
|
+0.73
1.69% |
$44.21
|
632,834
142.24% of 50 DAV
50 DAV is 444,900
|
$47.10
-6.84%
|
5/21/2014
|
$44.85
|
PP = $44.85
|
|
MB = $47.09
|
 Most Recent Note - 8/22/2014 5:59:19 PM
G - Consolidating above support at its 50 DMA line, still only -6.8% off its 52-week high, however its Relative Strength Rating has slumped to 66, well below the 80+ minimum for buy candidates. Faces resistance due to overhead supply up through the $47 level.
>>> FEATURED STOCK ARTICLE : Relative Strength Rating Slumped While Building Longer Base - 8/18/2014
View all notes |
Set NEW NOTE alert |
CANSLIM.net Company Profile |
SEC
News |
Chart |
Request a new note
C
A N
S L
I M
|
BITA
-
NYSE
Bitauto Hldgs Ltd Ads
Internet-Content
|
$81.71
|
+3.98
5.12% |
$82.20
|
1,288,992
123.47% of 50 DAV
50 DAV is 1,044,000
|
$84.99
-3.86%
|
6/26/2014
|
$46.20
|
PP = $47.03
|
|
MB = $49.38
|
Most Recent Note - 8/22/2014 12:21:01 PM
G - Trading up today following a streak of 3 consecutive small losses on heavy volume. Has the look of a "climax run" yet it is very extended from its prior base. Its 50 DMA line ($56.54) defines important near-term support to watch on pullbacks.
>>> FEATURED STOCK ARTICLE : Perched at High After 3 Consecutive Volume-Driven Gains - 8/8/2014
View all notes |
Set NEW NOTE alert |
CANSLIM.net Company Profile |
SEC
News |
Chart |
Request a new note
C
A N
S L
I M
|
EQM
-
NYSE
E Q T Midstream Partners
ENERGY - Oil and Gas Pipelines
|
$92.18
|
-1.05
-1.13% |
$94.42
|
139,380
40.52% of 50 DAV
50 DAV is 344,000
|
$102.51
-10.08%
|
12/12/2013
|
$53.17
|
PP = $56.51
|
|
MB = $59.34
|
Most Recent Note - 8/18/2014 7:05:44 PM
G - Its 50 DMA line acted as a resistance level. Subsequent gains above that important short-term average are needed to help its technical stance improve. Reported earnings +37% on +21% sales revenues for the Jun '14 quarter, an improvement after 2 sub par quarterly earnings comparisons.
>>> FEATURED STOCK ARTICLE : Following 50-Day Moving Average Violation Gains Lacked Volume - 8/7/2014
View all notes |
Set NEW NOTE alert |
CANSLIM.net Company Profile |
SEC
News |
Chart |
Request a new note
C
A N
S L
I M
|
FB
-
NASDAQ
Facebook Inc Cl A
INTERNET
|
$74.57
|
+0.00
0.00% |
$74.73
|
20,833,080
50.60% of 50 DAV
50 DAV is 41,170,000
|
$76.74
-2.83%
|
7/24/2014
|
$76.00
|
PP = $72.69
|
|
MB = $76.32
|
Most Recent Note - 8/18/2014 7:06:52 PM
Y - Volume totals have generally been cooling while consolidating near its pivot point, stubbornly holding its ground after gapping up on 7/24/14. Prior highs in the $72 area define initial support above its 50 DMA line ($68.91).
>>> FEATURED STOCK ARTICLE : Making Limited Headway But Holding Ground Since Gap Up - 8/20/2014
View all notes |
Set NEW NOTE alert |
CANSLIM.net Company Profile |
SEC
News |
Chart |
Request a new note
C
A N
S L
I M
|
Symbol/Exchange
Company Name
Industry Group |
PRICE |
CHANGE
(%Change) |
Day High |
Volume
(% DAV)
(% 50 day avg vol) |
52 Wk Hi
% From Hi |
Featured
Date |
Price
Featured |
Pivot Featured |
|
Max Buy |
PANW
-
NYSE
Palo Alto Networks
Computer Sftwr-Security
|
$85.01
|
+0.07
0.08% |
$85.98
|
1,083,663
74.94% of 50 DAV
50 DAV is 1,446,000
|
$87.79
-3.17%
|
7/30/2014
|
$84.21
|
PP = $85.88
|
|
MB = $90.17
|
Most Recent Note - 8/19/2014 5:57:55 PM
Y - Reversed into the red today while hovering near its 52-week high. Volume should be at least +40% above average behind gains above a stock's pivot point to trigger a proper technical buy signal. Its 50 DMA line ($80.50) defines important near-term support.
>>> FEATURED STOCK ARTICLE : Building on New Base Pattern Above 50-Day Average - 8/11/2014
View all notes |
Set NEW NOTE alert |
CANSLIM.net Company Profile |
SEC
News |
Chart |
Request a new note
C
A N
S L
I M
|
STRT
-
NASDAQ
Strattec Security Corp
AUTOMOTIVE - Auto Parts
|
$73.25
|
+1.61
2.25% |
$74.21
|
35,530
126.89% of 50 DAV
50 DAV is 28,000
|
$77.83
-5.88%
|
8/22/2014
|
$71.47
|
PP = $73.97
|
|
MB = $77.67
|
Most Recent Note - 8/22/2014 5:53:35 PM
Y - Finished strong after highlighted in yellow with pivot point based on its 6/06/14 high plus 10 cents in the earlier mid-day report (read here). Disciplined investors may watch for subsequent volume-driven gains above the pivot to trigger a proper technical buy signal. Quarterly earnings increases through Jun '14 above the +25% minimum guideline satisfy the C criteria and its annual earnings (A criteria) history has been strong. Increasing ownership by top-rated funds (I criteria) is a reassuring sign. See the latest FSU analysis for more details and new annotated graphs.
>>> FEATURED STOCK ARTICLE : Small Supply of Shares and Perched Near All-Time Highs - 8/22/2014
View all notes |
Set NEW NOTE alert |
CANSLIM.net Company Profile |
SEC
News |
Chart |
Request a new note
C
A N
S L
I M
|
TARO
-
NYSE
Taro Pharmaceutical Inds
DRUGS - Drug Manufacturers - Other
|
$161.48
|
+6.87
4.44% |
$161.93
|
112,944
141.18% of 50 DAV
50 DAV is 80,000
|
$158.25
2.04%
|
7/30/2014
|
$144.24
|
PP = $149.99
|
|
MB = $157.49
|
Most Recent Note - 8/22/2014 5:55:47 PM
G - Rallied for a new 52-week high with today's volume-driven gain. Recently reported earnings for the Jun '14 quarter below the +25% minimum earnings guideline (C criteria) raising fundamental concerns.
>>> FEATURED STOCK ARTICLE : Still Building on an Advanced Base Pattern - 8/6/2014
View all notes |
Set NEW NOTE alert |
CANSLIM.net Company Profile |
SEC
News |
Chart |
Request a new note
C
A N
S L
I M
|
TRN
-
NYSE
Trinity Industries Inc
TRANSPORTATION - Railroads
|
$48.18
|
+0.65
1.37% |
$48.65
|
2,416,021
88.96% of 50 DAV
50 DAV is 2,716,000
|
$47.84
0.71%
|
4/30/2014
|
$37.79
|
PP = $38.03
|
|
MB = $39.93
|
Most Recent Note - 8/19/2014 12:48:08 PM
G - Poised for a best-ever close with today's small gap up gain but it has not formed a sound base and its color code is changed to green. Promptly rebounded above its 50 DMA line following a brief violation, a sign of encouraging support. Reported earnings +91% on +39% sales for the Jun '14 quarter.
>>> FEATURED STOCK ARTICLE : Earnings News Due Following Tuesday's Close - 7/28/2014
View all notes |
Set NEW NOTE alert |
CANSLIM.net Company Profile |
SEC
News |
Chart |
Request a new note
C
A N
S L
I M
|
UA
-
NYSE
Under Armour Inc Cl A
CONSUMER NON-DURABLES - Textile - Apparel Clothing
|
$70.62
|
+1.18
1.70% |
$70.89
|
1,682,100
69.22% of 50 DAV
50 DAV is 2,430,000
|
$71.79
-1.63%
|
7/10/2014
|
$58.50
|
PP = $60.79
|
|
MB = $63.83
|
Most Recent Note - 8/18/2014 7:11:08 PM
G - Recently reported earnings +0% on +34% sales revenues for the Jun '14 quarter, below the +25% minimum earnings guideline (C criteria), yet the company raised its guidance. Finished at a new all-time high close today and no resistance remains due to overhead supply.
>>> FEATURED STOCK ARTICLE : Bullish Action Despite Latest Earnings Below +25% Minimum Guideline - 7/30/2014
View all notes |
Set NEW NOTE alert |
CANSLIM.net Company Profile |
SEC
News |
Chart |
Request a new note
C
A N
S L
I M
|
Symbol/Exchange
Company Name
Industry Group |
PRICE |
CHANGE
(%Change) |
Day High |
Volume
(% DAV)
(% 50 day avg vol) |
52 Wk Hi
% From Hi |
Featured
Date |
Price
Featured |
Pivot Featured |
|
Max Buy |
WLK
-
NYSE
Westlake Chemical Corp
CHEMICALS - Specialty Chemicals
|
$93.56
|
-0.44
-0.47% |
$93.77
|
303,270
58.43% of 50 DAV
50 DAV is 519,000
|
$94.01
-0.48%
|
4/29/2014
|
$72.79
|
PP = $69.31
|
|
MB = $72.78
|
Most Recent Note - 8/21/2014 6:00:18 PM
G - Technical strength has continued despite having reported earnings +11% on +6% sales revenues for the Jun '14 quarter, below the +25% minimum earnings guideline (C criteria), raising fundamental concerns. Hit a new 52-week high with today's 6th consecutive gain. Its 50 DMA line defines support where a subsequent violation would raise greater concerns and trigger a technical sell signal. See the latest FSU analysis for more details and new annotated graphs.
>>> FEATURED STOCK ARTICLE : Technically Strong Despite Fundamental Concerns Raised By Most Current Quarterly Earnings - 8/21/2014
View all notes |
Set NEW NOTE alert |
CANSLIM.net Company Profile |
SEC
News |
Chart |
Request a new note
C
A N
S L
I M
|
YY
-
NASDAQ
YY Inc Ads
INTERNET - Internet Service Providers
|
$87.51
|
+1.76
2.05% |
$87.92
|
936,069
60.24% of 50 DAV
50 DAV is 1,554,000
|
$90.93
-3.76%
|
8/19/2014
|
$85.81
|
PP = $91.03
|
|
MB = $95.58
|
Most Recent Note - 8/21/2014 6:03:23 PM
Y - Volume totals have been cooling while consolidating near its 52-week high. Finished weak when highlighted in yellow in the 8/19/14 mid-day report (read here). The Chinese Internet - Content firm needs subsequent volume-driven gains for new highs to trigger a new technical buy signal. See the latest FSU analysis for more details and annotated graphs.
>>> FEATURED STOCK ARTICLE : Encountered Distributional Peressure Near Prior High - 8/19/2014
View all notes |
Set NEW NOTE alert |
CANSLIM.net Company Profile |
SEC
News |
Chart |
Request a new note
C
A N
S L
I M
|
|
|
|
THESE ARE NOT BUY RECOMMENDATIONS!
Comments contained in the body of this report are technical
opinions only. The material herein has been obtained
from sources believed to be reliable and accurate, however,
its accuracy and completeness cannot be guaranteed.
This site is not an investment advisor, hence it does
not endorse or recommend any securities or other investments.
Any recommendation contained in this report may not
be suitable for all investors and it is not to be deemed
an offer or solicitation on our part with respect to
the purchase or sale of any securities. All trademarks,
service marks and trade names appearing in this report
are the property of their respective owners, and are
likewise used for identification purposes only.
This report is a service available
only to active Paid Premium Members.
You may opt-out of receiving report notifications
at any time. Questions or comments may be submitted
by writing to Premium Membership Services 665 S.E. 10 Street, Suite 201 Deerfield Beach, FL 33441-5634 or by calling 1-800-965-8307
or 954-785-1121.
|
|
|

