You are not logged in.
This means you
CAN ONLY VIEW reports that were published prior to Friday, October 25, 2024.
You
MUST UPGRADE YOUR MEMBERSHIP if you want to see any current reports.
AFTER MARKET UPDATE - THURSDAY, AUGUST 21ST, 2014
Previous After Market Report Next After Market Report >>>
|
|
|
|
DOW |
+60.36 |
17,039.49 |
+0.36% |
|
Volume |
554,406,190 |
+5% |
|
Volume |
1,309,492,200 |
-6% |
|
NASDAQ |
+5.62 |
4,532.10 |
+0.12% |
|
Advancers |
1,833 |
58% |
|
Advancers |
1,509 |
53% |
|
S&P 500 |
+5.86 |
1,992.37 |
+0.29% |
|
Decliners |
1,206 |
38% |
|
Decliners |
1,231 |
43% |
|
Russell 2000 |
+2.52 |
1,160.03 |
+0.22% |
|
52 Wk Highs |
184 |
|
|
52 Wk Highs |
76 |
|
|
S&P 600 |
+2.56 |
668.16 |
+0.38% |
|
52 Wk Lows |
17 |
|
|
52 Wk Lows |
45 |
|
|
 |
Benchmark S&P 500 Index Hits New Record High
Kenneth J. Gruneisen - Passed the CAN SLIM® Master's Exam
The major averages rose again on Thursday, advancing for the fourth time this week. The Dow rose 60 points to 17,039. The S&P 500 closed at a fresh all-time high of 1,992 as it gained 5 points. The NASDAQ also climbed 5 points to 4532. Volume totals were mixed, higher on the NYSE and lower on the Nasdaq exchange. Advancers led decliners by a 3-2 margin on the NYSE and a 5-4 margin on the NASDAQ exchange. There were 53 high-ranked companies from the CANSLIM.net Leaders List that made new 52-week highs and appeared on the CANSLIM.net BreakOuts Page, up from the prior session total of 48 stocks. New 52-week highs outnumbered new 52-week lows on the NYSE and on the Nasdaq exchange. There were gains for 4 of the 11 of the high-ranked companies currently included on the Featured Stocks Page. The improved action in the broader market (M criteria) has been considered significant enough to shift back to a "confirmed uptrend" while leadership (stocks hitting new 52-week highs) has remained healthy. Remember that disciplined investors buy stocks with superior fundamentals only after they have triggered a proper technical buy signal.
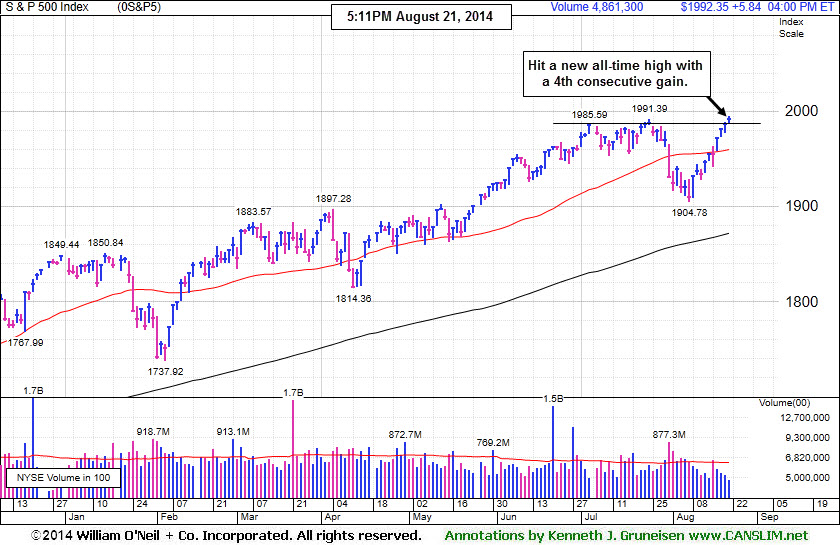
PICTURED: The benchmark S&P 500 Index hit a new all-time high with its 4th consecutive gain.
The recent winning streak continued thanks to a batch of encouraging economic data. Claims for unemployment benefits fell more than expected last week to 298,000 while existing home sales unexpectedly jumped in July to a 10-month high. Separate reports revealed factory activity expanded at the fastest pace since April 2010 while the Philly Fed index rose to more than a three-year high.
As a result, six of the 10 S&P 500 sectors finished higher. Financials and technology paced the advance. Bank of America (BAC +4.3%) rallied following news that it will pay a record settlement to end federal and state probes into its 2008 mortgage bond sales. Hewlett-Packard (HPQ +5.7%) rallied as a rise in PC sales led to a surprise increase in quarterly revenue. Shares of Salesforce.com (CRM ) were little changed before the company's profit tally after the close. On the downside, materials closed in negative territory. Monsanto (MON -2.7%) fell after it warned that its profit growth may slow next year.
Treasuries snapped a three-day losing streak. The 10-year note gained 6/32 to yield 2.41%.
The CANSLIM.net Featured Stocks Page shows the most action-worthy candidates and their latest notes and a Headline Link directs members to the latest detailed analysis with data-packed graphs annotated by a Certified expert along with links to additional resources. The Premium Member Homepage includes "dynamic archives" to all prior pay reports published.
|
 Kenneth J. Gruneisen started out as a licensed stockbroker in August 1987, a couple of months prior to the historic stock market crash that took the Dow Jones Industrial Average down -22.6% in a single day. He has published daily fact-based fundamental and technical analysis on high-ranked stocks online for two decades. Through FACTBASEDINVESTING.COM, Kenneth provides educational articles, news, market commentary, and other information regarding proven investment systems that work in good times and bad.
Comments contained in the body of this report are technical opinions only and are not necessarily those of Gruneisen Growth Corp. The material herein has been obtained from sources believed to be reliable and accurate, however, its accuracy and completeness cannot be guaranteed. Our firm, employees, and customers may effect transactions, including transactions contrary to any recommendation herein, or have positions in the securities mentioned herein or options with respect thereto. Any recommendation contained in this report may not be suitable for all investors and it is not to be deemed an offer or solicitation on our part with respect to the purchase or sale of any securities. |
|
 |
Influential Financial Groups Underpinned Major Averages' Rally
Kenneth J. Gruneisen - Passed the CAN SLIM® Master's Exam
Financial shares helped underpin the major averages' rally as the Broker/Dealer Index ($XBD +1.01%) and the Bank Index ($BKX +1.54%) both rose. The Gold & Silver Index ($XAU -2.14%) was clearly a laggard as it fell. The Biotechnology Index ($BTK -0.92%) also fell, meanwhile the Semiconductor Index ($SOX +0.39%) and the Networking Index ($NWX +0.87%) both posted gains. Energy-related shares had a slightly positive bias as the Oil Services Index ($OSX +0.13%) and the Integrated Oil Index ($XOI +0.26%) both edged higher.
Charts courtesy www.stockcharts.com
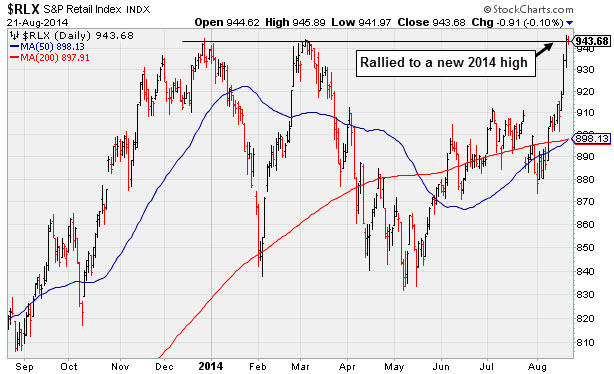
PICTURED: The Retail Index ($RLX -0.10%) edged lower, however its prior gain helped it hit a new 2014 high.
| Oil Services |
$OSX |
289.34 |
+0.39 |
+0.13% |
+2.96% |
| Integrated Oil |
$XOI |
1,668.03 |
+4.27 |
+0.26% |
+10.97% |
| Semiconductor |
$SOX |
639.11 |
+2.49 |
+0.39% |
+19.45% |
| Networking |
$NWX |
332.18 |
+2.88 |
+0.87% |
+2.54% |
| Broker/Dealer |
$XBD |
165.98 |
+1.66 |
+1.01% |
+3.37% |
| Retail |
$RLX |
943.68 |
-0.91 |
-0.10% |
+0.41% |
| Gold & Silver |
$XAU |
99.65 |
-2.18 |
-2.14% |
+18.42% |
| Bank |
$BKX |
71.20 |
+1.08 |
+1.54% |
+2.80% |
| Biotech |
$BTK |
2,934.81 |
-27.38 |
-0.92% |
+25.93% |
|
|
|
 |
Technically Strong Despite Fundamental Concerns Raised By Most Current Quarterly Earnings
Kenneth J. Gruneisen - Passed the CAN SLIM® Master's Exam
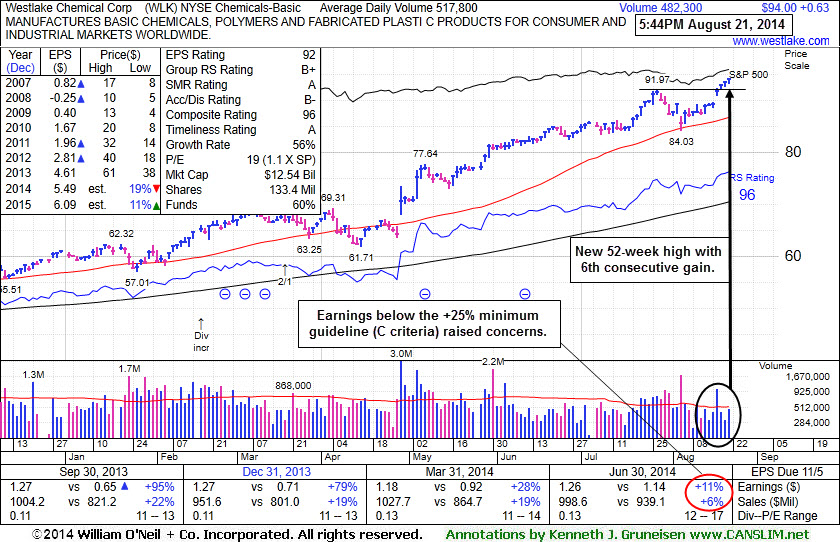
Westlake Chemical Corp (WLK +$0.63 or +0.67% to $94.00) hit yet another new 52-week high with today's 6th consecutive gain, still showing technical strength. It recently reported earnings +11% on +6% sales revenues for the Jun '14 quarter, below the +25% minimum earnings guideline (C criteria), raising fundamental concerns. For investors who may be continuing to give it the benefit of the doubt despite the fundamental flaw its 50-day moving average (DMA) line ($86.67) defines near-term support where a subsequent violation would raise greater concerns and trigger a technical sell signal. Its 50 DMA line acted as support during its consolidation since last shown in this FSU section on 7/25/14 under the headline, "Extended From Prior Base After Streak of 8 Consecutive Gains", hitting another new 52-week high but noted with caution - "Getting more extended from any sound base pattern."
WLK is up +29.1% from when it was first featured in yellow at $72.79 rallying from a "double bottom" base in the 4/29/14 mid-day report (read here). The Chemicals - Basic industry group has a Group Relative Strength rating of 75 and strong action and leadership from others in the group is a reassuring sign concerning the L criteria.
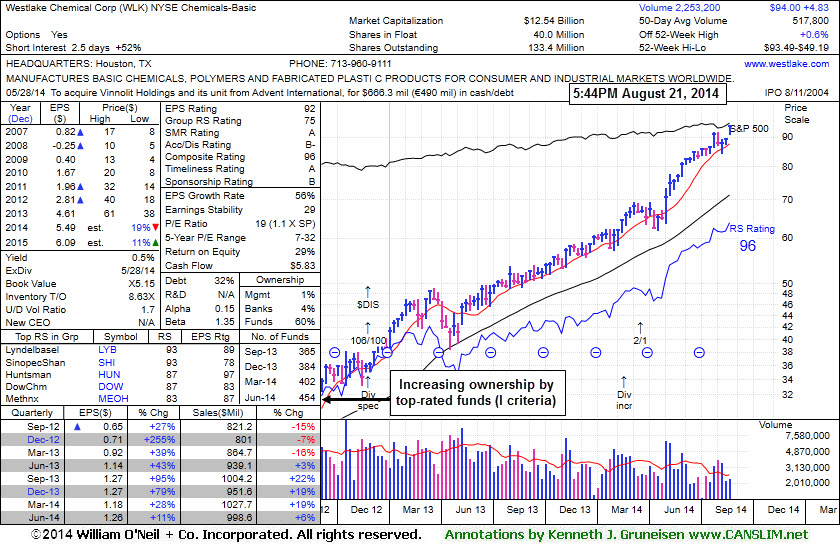
Its annual earnings growth rate (A criteria) has been strong after a downturn in FY '08 and '09. The number of top-rated funds owning its shares rose from 381 in Sep '13 to 454 in Jun '14, a reassuring trend concerning the I criteria. The small supply of only 40 million shares (S criteria) in the public float is ideal, while it can contribute to greater price volatility in the event of new institutional buying or selling.
|
|
|
Color Codes Explained :
Y - Better candidates highlighted by our
staff of experts.
G - Previously featured
in past reports as yellow but may no longer be buyable under the
guidelines.
***Last / Change / Volume data in this table is the closing quote data***
Symbol/Exchange
Company Name
Industry Group |
PRICE |
CHANGE
(%Change) |
Day High |
Volume
(% DAV)
(% 50 day avg vol) |
52 Wk Hi
% From Hi |
Featured
Date |
Price
Featured |
Pivot Featured |
|
Max Buy |
ACT
-
NYSE
Actavis plc
Medical-Generic Drugs
|
$226.25
|
+2.89
1.29% |
$228.12
|
2,144,052
83.46% of 50 DAV
50 DAV is 2,569,000
|
$230.77
-1.96%
|
6/20/2014
|
$216.53
|
PP = $230.87
|
|
MB = $242.41
|
Most Recent Note - 8/18/2014 7:01:15 PM
G - Inched higher today for as 5th consecutive gain on light volume, rebounding above its 50 DMA line helping its outlook to improve. Reported earnings +70% on +34% sales revenues for the Jun '14 quarter.
>>> FEATURED STOCK ARTICLE : Enduring Distributional Pressure While Sputtering Near 50-Day Average - 8/5/2014
View all notes |
Set NEW NOTE alert |
CANSLIM.net Company Profile |
SEC
News |
Chart |
Request a new note
C
A N
S L
I M


|
AFSI
-
NASDAQ
Amtrust Financial Svcs
INSURANCE - Property and; Casualty Insurance
|
$43.15
|
-0.60
-1.37% |
$44.35
|
525,256
118.06% of 50 DAV
50 DAV is 444,900
|
$47.10
-8.39%
|
5/21/2014
|
$44.85
|
PP = $44.85
|
|
MB = $47.09
|
Most Recent Note - 8/19/2014 12:01:51 PM
G - Down considerably today testing support at its 50 DMA line. Reversed into the red after challenging its 52-week high on the prior session. Reported +79% earnings on +56% sales for the Jun '14 quarter. Faces resistance due to overhead supply up through the $47 level. See the latest FSU analysis for more details and new annotated graphs.
>>> FEATURED STOCK ARTICLE : Relative Strength Rating Slumped While Building Longer Base - 8/18/2014
View all notes |
Set NEW NOTE alert |
CANSLIM.net Company Profile |
SEC
News |
Chart |
Request a new note
C
A N
S L
I M
|
BITA
-
NYSE
Bitauto Hldgs Ltd Ads
Internet-Content
|
$77.73
|
-0.70
-0.89% |
$78.98
|
1,878,031
179.89% of 50 DAV
50 DAV is 1,044,000
|
$84.99
-8.54%
|
6/26/2014
|
$46.20
|
PP = $47.03
|
|
MB = $49.38
|
 Most Recent Note - 8/21/2014 12:07:17 PM
G - Pulling back for a 3rd consecutive loss on heavy volume following a streak of 9 consecutive gains. Has the look of a "climax run" after getting very extended from its prior base. Its 50 DMA line ($55.09) defines important near-term support to watch on pullbacks.
>>> FEATURED STOCK ARTICLE : Perched at High After 3 Consecutive Volume-Driven Gains - 8/8/2014
View all notes |
Set NEW NOTE alert |
CANSLIM.net Company Profile |
SEC
News |
Chart |
Request a new note
C
A N
S L
I M
|
EQM
-
NYSE
E Q T Midstream Partners
ENERGY - Oil and Gas Pipelines
|
$93.23
|
-0.01
-0.01% |
$94.76
|
208,914
60.73% of 50 DAV
50 DAV is 344,000
|
$102.51
-9.05%
|
12/12/2013
|
$53.17
|
PP = $56.51
|
|
MB = $59.34
|
Most Recent Note - 8/18/2014 7:05:44 PM
G - Its 50 DMA line acted as a resistance level. Subsequent gains above that important short-term average are needed to help its technical stance improve. Reported earnings +37% on +21% sales revenues for the Jun '14 quarter, an improvement after 2 sub par quarterly earnings comparisons.
>>> FEATURED STOCK ARTICLE : Following 50-Day Moving Average Violation Gains Lacked Volume - 8/7/2014
View all notes |
Set NEW NOTE alert |
CANSLIM.net Company Profile |
SEC
News |
Chart |
Request a new note
C
A N
S L
I M
|
FB
-
NASDAQ
Facebook Inc Cl A
INTERNET
|
$74.57
|
-0.24
-0.32% |
$75.19
|
20,043,520
48.68% of 50 DAV
50 DAV is 41,170,000
|
$76.74
-2.83%
|
7/24/2014
|
$76.00
|
PP = $72.69
|
|
MB = $76.32
|
Most Recent Note - 8/18/2014 7:06:52 PM
Y - Volume totals have generally been cooling while consolidating near its pivot point, stubbornly holding its ground after gapping up on 7/24/14. Prior highs in the $72 area define initial support above its 50 DMA line ($68.91).
>>> FEATURED STOCK ARTICLE : Making Limited Headway But Holding Ground Since Gap Up - 8/20/2014
View all notes |
Set NEW NOTE alert |
CANSLIM.net Company Profile |
SEC
News |
Chart |
Request a new note
C
A N
S L
I M
|
Symbol/Exchange
Company Name
Industry Group |
PRICE |
CHANGE
(%Change) |
Day High |
Volume
(% DAV)
(% 50 day avg vol) |
52 Wk Hi
% From Hi |
Featured
Date |
Price
Featured |
Pivot Featured |
|
Max Buy |
PANW
-
NYSE
Palo Alto Networks
Computer Sftwr-Security
|
$84.94
|
-0.03
-0.04% |
$85.45
|
588,387
40.69% of 50 DAV
50 DAV is 1,446,000
|
$87.79
-3.25%
|
7/30/2014
|
$84.21
|
PP = $85.88
|
|
MB = $90.17
|
Most Recent Note - 8/19/2014 5:57:55 PM
Y - Reversed into the red today while hovering near its 52-week high. Volume should be at least +40% above average behind gains above a stock's pivot point to trigger a proper technical buy signal. Its 50 DMA line ($80.50) defines important near-term support.
>>> FEATURED STOCK ARTICLE : Building on New Base Pattern Above 50-Day Average - 8/11/2014
View all notes |
Set NEW NOTE alert |
CANSLIM.net Company Profile |
SEC
News |
Chart |
Request a new note
C
A N
S L
I M
|
TARO
-
NYSE
Taro Pharmaceutical Inds
DRUGS - Drug Manufacturers - Other
|
$154.61
|
+2.60
1.71% |
$154.61
|
53,785
67.23% of 50 DAV
50 DAV is 80,000
|
$158.25
-2.30%
|
7/30/2014
|
$144.24
|
PP = $149.99
|
|
MB = $157.49
|
Most Recent Note - 8/19/2014 12:43:28 PM
G - Recently churning above average volume while remaining perched at its 52-week high, enduring distributional pressure. Found support at its 50 DMA line while building on its latest base pattern. Reported earnings -18% on -15% sales revenues for the Jun '14 quarter, below the +25% minimum earnings guideline (C criteria) raising fundamental concerns and its color code was changed to green.
>>> FEATURED STOCK ARTICLE : Still Building on an Advanced Base Pattern - 8/6/2014
View all notes |
Set NEW NOTE alert |
CANSLIM.net Company Profile |
SEC
News |
Chart |
Request a new note
C
A N
S L
I M
|
TRN
-
NYSE
Trinity Industries Inc
TRANSPORTATION - Railroads
|
$47.53
|
+0.27
0.57% |
$47.84
|
2,556,838
94.14% of 50 DAV
50 DAV is 2,716,000
|
$47.83
-0.63%
|
4/30/2014
|
$37.79
|
PP = $38.03
|
|
MB = $39.93
|
Most Recent Note - 8/19/2014 12:48:08 PM
G - Poised for a best-ever close with today's small gap up gain but it has not formed a sound base and its color code is changed to green. Promptly rebounded above its 50 DMA line following a brief violation, a sign of encouraging support. Reported earnings +91% on +39% sales for the Jun '14 quarter.
>>> FEATURED STOCK ARTICLE : Earnings News Due Following Tuesday's Close - 7/28/2014
View all notes |
Set NEW NOTE alert |
CANSLIM.net Company Profile |
SEC
News |
Chart |
Request a new note
C
A N
S L
I M
|
UA
-
NYSE
Under Armour Inc Cl A
CONSUMER NON-DURABLES - Textile - Apparel Clothing
|
$69.44
|
-1.12
-1.59% |
$70.89
|
1,680,267
69.15% of 50 DAV
50 DAV is 2,430,000
|
$71.79
-3.27%
|
7/10/2014
|
$58.50
|
PP = $60.79
|
|
MB = $63.83
|
Most Recent Note - 8/18/2014 7:11:08 PM
G - Recently reported earnings +0% on +34% sales revenues for the Jun '14 quarter, below the +25% minimum earnings guideline (C criteria), yet the company raised its guidance. Finished at a new all-time high close today and no resistance remains due to overhead supply.
>>> FEATURED STOCK ARTICLE : Bullish Action Despite Latest Earnings Below +25% Minimum Guideline - 7/30/2014
View all notes |
Set NEW NOTE alert |
CANSLIM.net Company Profile |
SEC
News |
Chart |
Request a new note
C
A N
S L
I M
|
WLK
-
NYSE
Westlake Chemical Corp
CHEMICALS - Specialty Chemicals
|
$94.00
|
+0.63
0.67% |
$94.01
|
482,313
92.93% of 50 DAV
50 DAV is 519,000
|
$93.49
0.55%
|
4/29/2014
|
$72.79
|
PP = $69.31
|
|
MB = $72.78
|
Most Recent Note - 8/21/2014 6:00:18 PM
G - Technical strength has continued despite having reported earnings +11% on +6% sales revenues for the Jun '14 quarter, below the +25% minimum earnings guideline (C criteria), raising fundamental concerns. Hit a new 52-week high with today's 6th consecutive gain. Its 50 DMA line defines support where a subsequent violation would raise greater concerns and trigger a technical sell signal. See the latest FSU analysis for more details and new annotated graphs.
>>> FEATURED STOCK ARTICLE : Technically Strong Despite Fundamental Concerns Raised By Most Current Quarterly Earnings - 8/21/2014
View all notes |
Set NEW NOTE alert |
CANSLIM.net Company Profile |
SEC
News |
Chart |
Request a new note
C
A N
S L
I M
|
Symbol/Exchange
Company Name
Industry Group |
PRICE |
CHANGE
(%Change) |
Day High |
Volume
(% DAV)
(% 50 day avg vol) |
52 Wk Hi
% From Hi |
Featured
Date |
Price
Featured |
Pivot Featured |
|
Max Buy |
YY
-
NASDAQ
YY Inc Ads
INTERNET - Internet Service Providers
|
$85.75
|
-0.56
-0.65% |
$86.82
|
877,978
56.50% of 50 DAV
50 DAV is 1,554,000
|
$90.93
-5.70%
|
8/19/2014
|
$85.81
|
PP = $91.03
|
|
MB = $95.58
|
Most Recent Note - 8/21/2014 6:03:23 PM
Y - Volume totals have been cooling while consolidating near its 52-week high. Finished weak when highlighted in yellow in the 8/19/14 mid-day report (read here). The Chinese Internet - Content firm needs subsequent volume-driven gains for new highs to trigger a new technical buy signal. See the latest FSU analysis for more details and annotated graphs.
>>> FEATURED STOCK ARTICLE : Encountered Distributional Peressure Near Prior High - 8/19/2014
View all notes |
Set NEW NOTE alert |
CANSLIM.net Company Profile |
SEC
News |
Chart |
Request a new note
C
A N
S L
I M
|
|
|
|
THESE ARE NOT BUY RECOMMENDATIONS!
Comments contained in the body of this report are technical
opinions only. The material herein has been obtained
from sources believed to be reliable and accurate, however,
its accuracy and completeness cannot be guaranteed.
This site is not an investment advisor, hence it does
not endorse or recommend any securities or other investments.
Any recommendation contained in this report may not
be suitable for all investors and it is not to be deemed
an offer or solicitation on our part with respect to
the purchase or sale of any securities. All trademarks,
service marks and trade names appearing in this report
are the property of their respective owners, and are
likewise used for identification purposes only.
This report is a service available
only to active Paid Premium Members.
You may opt-out of receiving report notifications
at any time. Questions or comments may be submitted
by writing to Premium Membership Services 665 S.E. 10 Street, Suite 201 Deerfield Beach, FL 33441-5634 or by calling 1-800-965-8307
or 954-785-1121.
|
|
|

