You are not logged in.
This means you
CAN ONLY VIEW reports that were published prior to Monday, April 14, 2025.
You
MUST UPGRADE YOUR MEMBERSHIP if you want to see any current reports.
AFTER MARKET UPDATE - WEDNESDAY, AUGUST 20TH, 2014
Previous After Market Report Next After Market Report >>>
|
|
|
|
DOW |
+59.54 |
16,979.13 |
+0.35% |
|
Volume |
529,347,260 |
-3% |
|
Volume |
1,391,786,360 |
-3% |
|
NASDAQ |
-1.03 |
4,526.48 |
-0.02% |
|
Advancers |
1,544 |
49% |
|
Advancers |
1,024 |
36% |
|
S&P 500 |
+4.91 |
1,986.51 |
+0.25% |
|
Decliners |
1,462 |
46% |
|
Decliners |
1,709 |
60% |
|
Russell 2000 |
-4.96 |
1,157.51 |
-0.43% |
|
52 Wk Highs |
150 |
|
|
52 Wk Highs |
77 |
|
|
S&P 600 |
-3.73 |
665.60 |
-0.56% |
|
52 Wk Lows |
17 |
|
|
52 Wk Lows |
42 |
|
|
 |
Major Averages Rose Again With Lighter Volume Totals
Kenneth J. Gruneisen - Passed the CAN SLIM® Master's Exam
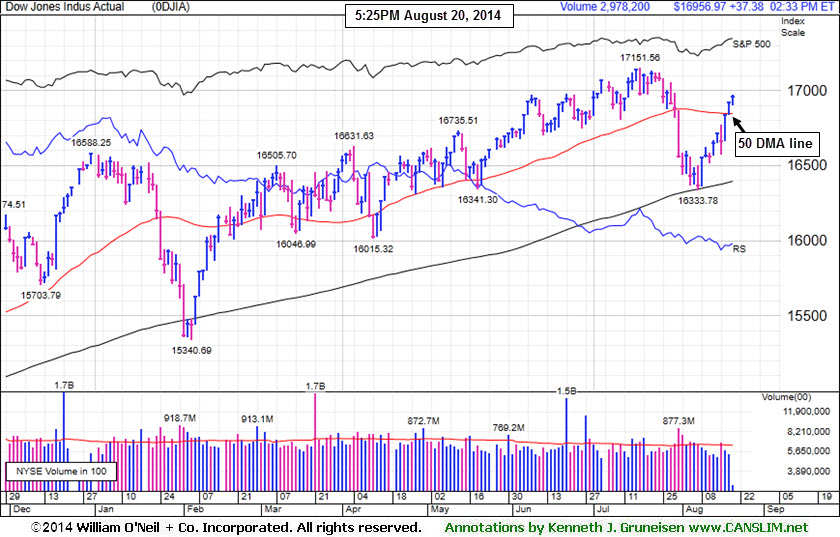
The major averages advanced on Wednesday. The Dow rose 59 points to 16,979. The S&P 500 inched closer to a record high as it added 4 points to 1,986. The NASDAQ closed virtually unchanged at 4,526. Volume totals were lighter on both major exchanges. Advancers led decliners by a narrow margin on the NYSE but decliners outnumbered advancers by more than a 3-2 margin on the NASDAQ exchange. There were 48 high-ranked companies from the CANSLIM.net Leaders List that made new 52-week highs and appeared on the CANSLIM.net BreakOuts Page, down from the prior session total of 68 stocks. New 52-week highs outnumbered new 52-week lows on the NYSE and on the Nasdaq exchange. There were gains for 6 of the 11 of the high-ranked companies currently included on the Featured Stocks Page. The improved action in the broader market (M criteria) has been considered significant enough to shift back to a "confirmed uptrend" while leadership (stocks hitting new 52-week highs) has remained healthy. Remember that disciplined investors buy stocks with superior fundamentals only after they have triggered a proper technical buy signal.
PICTURED: The Dow Jones Industrial Average is rebounding above its 50-day moving average (DMA) line toward its all-time high.
The major averages finished higher in a choppy session as investors weighed commentary from the Fed. The release of the July FOMC minutes showed central bank officials debated an exit strategy from its accommodative interest rate policy amid signs of an improving economy. Nearly every sector rose on the session led by industrials. Jacob's Engineering (JEC +3.2%) rose after authorizing a $500 million share buyback.
Consumer discretionary also paced the market's advance. Lowe's (LOW +1.57%) rose as the home improvement retailer's results topped estimates. Target (TGT +1.82%) was higher even after profits fell short of projections and the company cut its full year forecast. Staples (SPLS -2.58%) was the worst performing stock in the S&P 500, as it announced it would close 140 stores this year amid increased online competition. Over in tech, International Rectifier soared (IRF +47.21%) following news that Infineon Technologies (IFNNY -1.87%) agreed to buy the company for $3 billion. Hewlett-Packard (HPQ -1.01%) fell ahead of its scheduled earnings release.
Treasuries retreated for a third day. The 10-year note declined 7/32 to yield 2.43%.
The CANSLIM.net Featured Stocks Page shows the most action-worthy candidates and their latest notes and a Headline Link directs members to the latest detailed analysis with data-packed graphs annotated by a Certified expert along with links to additional resources. The Premium Member Homepage includes "dynamic archives" to all prior pay reports published.
|
 Kenneth J. Gruneisen started out as a licensed stockbroker in August 1987, a couple of months prior to the historic stock market crash that took the Dow Jones Industrial Average down -22.6% in a single day. He has published daily fact-based fundamental and technical analysis on high-ranked stocks online for two decades. Through FACTBASEDINVESTING.COM, Kenneth provides educational articles, news, market commentary, and other information regarding proven investment systems that work in good times and bad.
Comments contained in the body of this report are technical opinions only and are not necessarily those of Gruneisen Growth Corp. The material herein has been obtained from sources believed to be reliable and accurate, however, its accuracy and completeness cannot be guaranteed. Our firm, employees, and customers may effect transactions, including transactions contrary to any recommendation herein, or have positions in the securities mentioned herein or options with respect thereto. Any recommendation contained in this report may not be suitable for all investors and it is not to be deemed an offer or solicitation on our part with respect to the purchase or sale of any securities. |
|
 |
Retail and Semiconductor Indexes Led Group Gainers
Kenneth J. Gruneisen - Passed the CAN SLIM® Master's Exam
The Retail Index ($RLX +1.08%) was a positive influence on the major averages while the Bank Index ($BKX +0.34%) eked out a small gain and the Broker/Dealer Index ($XBD +0.03%) finished flat. The Semiconductor Index ($SOX +0.82%) led the tech sector higher while the Biotechnology Index ($BTK +0.31%) and the Networking Index ($NWX +0.32%) posted smaller gains. The Gold & Silver Index ($XAU +0.23%) and the Oil Services Index ($OSX +0.27%) edged higher while the Integrated Oil Index ($XOI +0.04%) finished flat.
Charts courtesy www.stockcharts.com
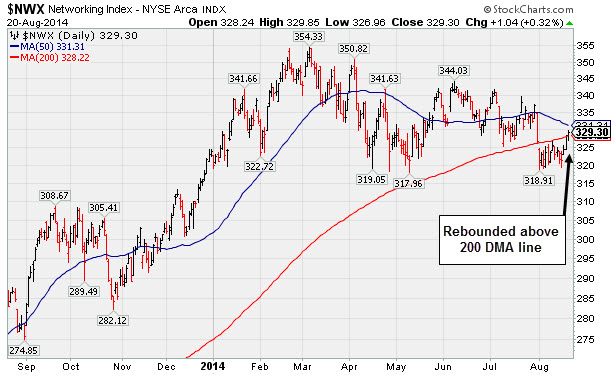
PICTURED: The Networking Index ($NWX +0.32%) rebounded above its 200-day moving average (DMA) line.
| Oil Services |
$OSX |
288.95 |
+0.77 |
+0.27% |
+2.82% |
| Integrated Oil |
$XOI |
1,663.77 |
+0.59 |
+0.04% |
+10.69% |
| Semiconductor |
$SOX |
636.62 |
+5.15 |
+0.82% |
+18.99% |
| Networking |
$NWX |
329.30 |
+1.04 |
+0.32% |
+1.66% |
| Broker/Dealer |
$XBD |
164.32 |
+0.05 |
+0.03% |
+2.34% |
| Retail |
$RLX |
944.59 |
+10.08 |
+1.08% |
+0.51% |
| Gold & Silver |
$XAU |
101.83 |
+0.23 |
+0.23% |
+21.01% |
| Bank |
$BKX |
70.12 |
+0.24 |
+0.34% |
+1.24% |
| Biotech |
$BTK |
2,962.19 |
+9.15 |
+0.31% |
+27.11% |
|
|
|
 |
Making Limited Headway But Holding Ground Since Gap Up
Kenneth J. Gruneisen - Passed the CAN SLIM® Master's Exam
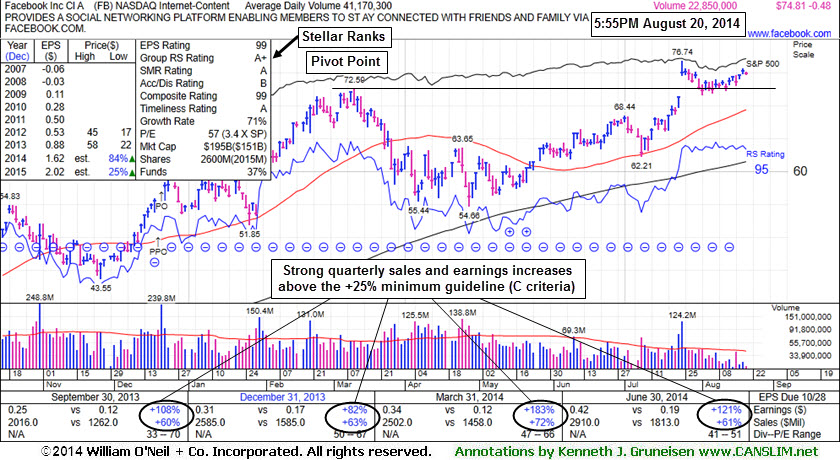
Facebook Inc (FB -$0.48 or -0.64% to $74.81) volume totals have generally been cooling in recent weeks while consolidating near its pivot point and near its 52-week high. It has stubbornly held its ground since gapping up on 7/24/14. Prior highs in the $72 area define initial support above its 50-day moving average DMA line ($69.33).
Facebook has made limited headway since last shown in this FSU section on 7/24/14 with annotated graphs under the headline, "Breakaway Gap May Signal Beginning of Meaningful Rally", after highlighted in yellow with pivot point cited based on its 3/11/14 high plus 10 cents in the 7/24/14 breakouts report (read here). The "breakaway gap" with nearly 3 times average volume triggered a technical buy signal after reporting earnings +121% on +61% sales revenues for the Jun '14 quarter, its 5th consecutive quarterly comparison with earnings increasing well above the +25% minimum (C criteria).
It stayed well above its 200 DMA line during its consolidation after dropped from the Featured Stocks list on 4/04/14 due to weakness. Members were reminded - "Remember that any stock that is sold can always be bought back again later if strength returns."
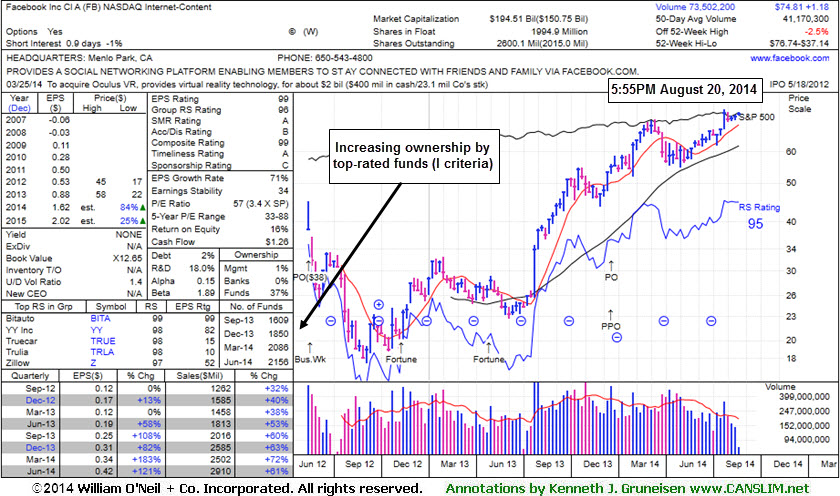
Its current Up/Down Volume Ratio of 1.4 is an unbiased bullish indication its shares have been under accumulation over the past 50 days. The high-ranked Internet - Content group leader has seen the number of top-rated funds owning its shares rise from 1,116 in Dec '12 to 2,156 in Jun '14, a reassuring sign concerning the I criteria. However, members were previously warned - "Keep in mind that its large supply of 2.54 billion shares in the public float makes it an unlikely sprinter, especially as it is already well known by the institutional crowd and the general public."
|
|
|
Color Codes Explained :
Y - Better candidates highlighted by our
staff of experts.
G - Previously featured
in past reports as yellow but may no longer be buyable under the
guidelines.
***Last / Change / Volume data in this table is the closing quote data***
Symbol/Exchange
Company Name
Industry Group |
PRICE |
CHANGE
(%Change) |
Day High |
Volume
(% DAV)
(% 50 day avg vol) |
52 Wk Hi
% From Hi |
Featured
Date |
Price
Featured |
Pivot Featured |
|
Max Buy |
ACT
-
NYSE
Actavis plc
Medical-Generic Drugs
|
$223.36
|
+0.28
0.13% |
$224.18
|
1,356,411
52.80% of 50 DAV
50 DAV is 2,569,000
|
$230.77
-3.21%
|
6/20/2014
|
$216.53
|
PP = $230.87
|
|
MB = $242.41
|
Most Recent Note - 8/18/2014 7:01:15 PM
G - Inched higher today for as 5th consecutive gain on light volume, rebounding above its 50 DMA line helping its outlook to improve. Reported earnings +70% on +34% sales revenues for the Jun '14 quarter.
>>> FEATURED STOCK ARTICLE : Enduring Distributional Pressure While Sputtering Near 50-Day Average - 8/5/2014
View all notes |
Set NEW NOTE alert |
CANSLIM.net Company Profile |
SEC
News |
Chart |
Request a new note
C
A N
S L
I M


|
AFSI
-
NASDAQ
Amtrust Financial Svcs
INSURANCE - Property and; Casualty Insurance
|
$43.75
|
+0.74
1.72% |
$43.95
|
490,884
110.34% of 50 DAV
50 DAV is 444,900
|
$47.10
-7.11%
|
5/21/2014
|
$44.85
|
PP = $44.85
|
|
MB = $47.09
|
Most Recent Note - 8/19/2014 12:01:51 PM
G - Down considerably today testing support at its 50 DMA line. Reversed into the red after challenging its 52-week high on the prior session. Reported +79% earnings on +56% sales for the Jun '14 quarter. Faces resistance due to overhead supply up through the $47 level. See the latest FSU analysis for more details and new annotated graphs.
>>> FEATURED STOCK ARTICLE : Relative Strength Rating Slumped While Building Longer Base - 8/18/2014
View all notes |
Set NEW NOTE alert |
CANSLIM.net Company Profile |
SEC
News |
Chart |
Request a new note
C
A N
S L
I M
|
BITA
-
NYSE
Bitauto Hldgs Ltd Ads
Internet-Content
|
$78.43
|
-3.80
-4.62% |
$83.50
|
2,526,541
242.01% of 50 DAV
50 DAV is 1,044,000
|
$84.99
-7.72%
|
6/26/2014
|
$46.20
|
PP = $47.03
|
|
MB = $49.38
|
 Most Recent Note - 8/20/2014 6:13:20 PM
G - Down for a 2nd consecutive loss on heavy volume following a streak of 9 consecutive gains. Has the look of a "climax run" after getting very extended from its prior base. Its 50 DMA line ($55.09) defines important near-term support to watch on pullbacks.
>>> FEATURED STOCK ARTICLE : Perched at High After 3 Consecutive Volume-Driven Gains - 8/8/2014
View all notes |
Set NEW NOTE alert |
CANSLIM.net Company Profile |
SEC
News |
Chart |
Request a new note
C
A N
S L
I M
|
EQM
-
NYSE
E Q T Midstream Partners
ENERGY - Oil and Gas Pipelines
|
$93.24
|
+0.51
0.55% |
$93.50
|
115,601
33.60% of 50 DAV
50 DAV is 344,000
|
$102.51
-9.04%
|
12/12/2013
|
$53.17
|
PP = $56.51
|
|
MB = $59.34
|
Most Recent Note - 8/18/2014 7:05:44 PM
G - Its 50 DMA line acted as a resistance level. Subsequent gains above that important short-term average are needed to help its technical stance improve. Reported earnings +37% on +21% sales revenues for the Jun '14 quarter, an improvement after 2 sub par quarterly earnings comparisons.
>>> FEATURED STOCK ARTICLE : Following 50-Day Moving Average Violation Gains Lacked Volume - 8/7/2014
View all notes |
Set NEW NOTE alert |
CANSLIM.net Company Profile |
SEC
News |
Chart |
Request a new note
C
A N
S L
I M
|
FB
-
NASDAQ
Facebook Inc Cl A
INTERNET
|
$74.81
|
-0.48
-0.64% |
$75.18
|
22,850,033
55.50% of 50 DAV
50 DAV is 41,170,000
|
$76.74
-2.51%
|
7/24/2014
|
$76.00
|
PP = $72.69
|
|
MB = $76.32
|
Most Recent Note - 8/18/2014 7:06:52 PM
Y - Volume totals have generally been cooling while consolidating near its pivot point, stubbornly holding its ground after gapping up on 7/24/14. Prior highs in the $72 area define initial support above its 50 DMA line ($68.91).
>>> FEATURED STOCK ARTICLE : Making Limited Headway But Holding Ground Since Gap Up - 8/20/2014
View all notes |
Set NEW NOTE alert |
CANSLIM.net Company Profile |
SEC
News |
Chart |
Request a new note
C
A N
S L
I M
|
Symbol/Exchange
Company Name
Industry Group |
PRICE |
CHANGE
(%Change) |
Day High |
Volume
(% DAV)
(% 50 day avg vol) |
52 Wk Hi
% From Hi |
Featured
Date |
Price
Featured |
Pivot Featured |
|
Max Buy |
PANW
-
NYSE
Palo Alto Networks
Computer Sftwr-Security
|
$84.97
|
-0.42
-0.49% |
$85.39
|
548,072
37.90% of 50 DAV
50 DAV is 1,446,000
|
$87.79
-3.21%
|
7/30/2014
|
$84.21
|
PP = $85.88
|
|
MB = $90.17
|
Most Recent Note - 8/19/2014 5:57:55 PM
Y - Reversed into the red today while hovering near its 52-week high. Volume should be at least +40% above average behind gains above a stock's pivot point to trigger a proper technical buy signal. Its 50 DMA line ($80.50) defines important near-term support.
>>> FEATURED STOCK ARTICLE : Building on New Base Pattern Above 50-Day Average - 8/11/2014
View all notes |
Set NEW NOTE alert |
CANSLIM.net Company Profile |
SEC
News |
Chart |
Request a new note
C
A N
S L
I M
|
TARO
-
NYSE
Taro Pharmaceutical Inds
DRUGS - Drug Manufacturers - Other
|
$152.01
|
-0.34
-0.22% |
$153.45
|
63,271
79.09% of 50 DAV
50 DAV is 80,000
|
$158.25
-3.94%
|
7/30/2014
|
$144.24
|
PP = $149.99
|
|
MB = $157.49
|
Most Recent Note - 8/19/2014 12:43:28 PM
G - Recently churning above average volume while remaining perched at its 52-week high, enduring distributional pressure. Found support at its 50 DMA line while building on its latest base pattern. Reported earnings -18% on -15% sales revenues for the Jun '14 quarter, below the +25% minimum earnings guideline (C criteria) raising fundamental concerns and its color code was changed to green.
>>> FEATURED STOCK ARTICLE : Still Building on an Advanced Base Pattern - 8/6/2014
View all notes |
Set NEW NOTE alert |
CANSLIM.net Company Profile |
SEC
News |
Chart |
Request a new note
C
A N
S L
I M
|
TRN
-
NYSE
Trinity Industries Inc
TRANSPORTATION - Railroads
|
$47.26
|
+1.09
2.36% |
$47.44
|
2,784,668
102.53% of 50 DAV
50 DAV is 2,716,000
|
$47.83
-1.19%
|
4/30/2014
|
$37.79
|
PP = $38.03
|
|
MB = $39.93
|
Most Recent Note - 8/19/2014 12:48:08 PM
G - Poised for a best-ever close with today's small gap up gain but it has not formed a sound base and its color code is changed to green. Promptly rebounded above its 50 DMA line following a brief violation, a sign of encouraging support. Reported earnings +91% on +39% sales for the Jun '14 quarter.
>>> FEATURED STOCK ARTICLE : Earnings News Due Following Tuesday's Close - 7/28/2014
View all notes |
Set NEW NOTE alert |
CANSLIM.net Company Profile |
SEC
News |
Chart |
Request a new note
C
A N
S L
I M
|
UA
-
NYSE
Under Armour Inc Cl A
CONSUMER NON-DURABLES - Textile - Apparel Clothing
|
$70.56
|
+0.44
0.63% |
$71.27
|
1,588,222
65.36% of 50 DAV
50 DAV is 2,430,000
|
$71.79
-1.71%
|
7/10/2014
|
$58.50
|
PP = $60.79
|
|
MB = $63.83
|
Most Recent Note - 8/18/2014 7:11:08 PM
G - Recently reported earnings +0% on +34% sales revenues for the Jun '14 quarter, below the +25% minimum earnings guideline (C criteria), yet the company raised its guidance. Finished at a new all-time high close today and no resistance remains due to overhead supply.
>>> FEATURED STOCK ARTICLE : Bullish Action Despite Latest Earnings Below +25% Minimum Guideline - 7/30/2014
View all notes |
Set NEW NOTE alert |
CANSLIM.net Company Profile |
SEC
News |
Chart |
Request a new note
C
A N
S L
I M
|
WLK
-
NYSE
Westlake Chemical Corp
CHEMICALS - Specialty Chemicals
|
$93.37
|
+0.43
0.46% |
$93.49
|
314,677
60.63% of 50 DAV
50 DAV is 519,000
|
$93.02
0.38%
|
4/29/2014
|
$72.79
|
PP = $69.31
|
|
MB = $72.78
|
Most Recent Note - 8/18/2014 1:40:29 PM
G - Reported earnings +11% on +6% sales revenues for the Jun '14 quarter, below the +25% minimum earnings guideline (C criteria), raising fundamental concerns. Gapped up today and hit a new 52-week high. Found support at its 50 DMA line ($85.98) where a subsequent violation would raise greater concerns and trigger a technical sell signal.
>>> FEATURED STOCK ARTICLE : Extended From Prior Base After Streak of 8 Consecutive Gains - 7/25/2014
View all notes |
Set NEW NOTE alert |
CANSLIM.net Company Profile |
SEC
News |
Chart |
Request a new note
C
A N
S L
I M
|
Symbol/Exchange
Company Name
Industry Group |
PRICE |
CHANGE
(%Change) |
Day High |
Volume
(% DAV)
(% 50 day avg vol) |
52 Wk Hi
% From Hi |
Featured
Date |
Price
Featured |
Pivot Featured |
|
Max Buy |
YY
-
NASDAQ
YY Inc Ads
INTERNET - Internet Service Providers
|
$86.31
|
-0.31
-0.36% |
$88.50
|
1,044,551
67.22% of 50 DAV
50 DAV is 1,554,000
|
$90.93
-5.08%
|
8/19/2014
|
$85.81
|
PP = $91.03
|
|
MB = $95.58
|
Most Recent Note - 8/19/2014 5:55:28 PM
Y - Finished weak after highlighted yellow with new pivot point cited based on its 3/06/14 high plus 10 cents in the earlier mid-day report (read here). The Chinese Internet - Content firm needs subsequent volume-driven gains for new highs to trigger a new technical buy signal. Fundamentals through the Jun '14 quarter remain very strong. Rebounded after a deep consolidation since dropped from the Featured Stocks list on 1/27/14 amid widespread weakness in China-related companies. See the latest FSU analysis for more details and new annotated graphs.
>>> FEATURED STOCK ARTICLE : Encountered Distributional Peressure Near Prior High - 8/19/2014
View all notes |
Set NEW NOTE alert |
CANSLIM.net Company Profile |
SEC
News |
Chart |
Request a new note
C
A N
S L
I M
|
|
|
|
THESE ARE NOT BUY RECOMMENDATIONS!
Comments contained in the body of this report are technical
opinions only. The material herein has been obtained
from sources believed to be reliable and accurate, however,
its accuracy and completeness cannot be guaranteed.
This site is not an investment advisor, hence it does
not endorse or recommend any securities or other investments.
Any recommendation contained in this report may not
be suitable for all investors and it is not to be deemed
an offer or solicitation on our part with respect to
the purchase or sale of any securities. All trademarks,
service marks and trade names appearing in this report
are the property of their respective owners, and are
likewise used for identification purposes only.
This report is a service available
only to active Paid Premium Members.
You may opt-out of receiving report notifications
at any time. Questions or comments may be submitted
by writing to Premium Membership Services 665 S.E. 10 Street, Suite 201 Deerfield Beach, FL 33441-5634 or by calling 1-800-965-8307
or 954-785-1121.
|
|
|