You are not logged in.
This means you
CAN ONLY VIEW reports that were published prior to Monday, April 14, 2025.
You
MUST UPGRADE YOUR MEMBERSHIP if you want to see any current reports.
AFTER MARKET UPDATE - FRIDAY, AUGUST 20TH, 2010
Previous After Market Report Next After Market Report >>>
|
|
|
|
DOW |
-57.59 |
10,213.62 |
-0.56% |
|
Volume |
1,123,969,800 |
+5% |
|
Volume |
1,860,392,620 |
-8% |
|
NASDAQ |
+0.81 |
2,179.76 |
+0.04% |
|
Advancers |
1,231 |
39% |
|
Advancers |
1,285 |
47% |
|
S&P 500 |
-3.94 |
1,071.69 |
-0.37% |
|
Decliners |
1,746 |
56% |
|
Decliners |
1,315 |
48% |
|
Russell 2000 |
-0.18 |
610.78 |
-0.03% |
|
52 Wk Highs |
83 |
|
|
52 Wk Highs |
22 |
|
|
S&P 600 |
-0.30 |
326.97 |
-0.09% |
|
52 Wk Lows |
95 |
|
|
52 Wk Lows |
140 |
|
|
 |
Deteriorating Conditions Give Investors Disconcerting Messages
Adam Sarhan, Contributing Writer,
For the week, the Dow Jones Industrial Average and the benchmark S&P 500 index fell while the Nasdaq Composite Index ended with a modest gain. Investors digested a flurry of M&A activity and the latest round of lackluster economic data. Volume reported on the NYSE rose while the Nasdaq exchange's volume total on Friday fell compared to Thursday's levels as the major averages ended the session mixed. Decliners led advancers by almost a 3-to-2 ratio on the NYSE, yet they led by only a small margin on the Nasdaq exchange. New 52-week lows outnumbered new 52-week highs on the NYSE and on the Nasdaq exchange. There were only 9 high-ranked companies from the CANSLIM.net Leaders List made a new 52-week high and appeared on the CANSLIM.net BreakOuts Page, lower than the 10 issues that appeared on the prior session.
Stocks traded in a tight range on Monday as investors digested weaker than expected economic data from Japan and the US. Japan said its economy slowed sharply last quarter with GDP missing forecasts. Japan's economy grew by +0.4% on an annualized basis which was less than the Street's estimate. Stocks slid after a weaker-than-expected report from New York manufacturing was released. The major averages rallied on Tuesday as the latest round of earnings topped estimates and a flurry of mergers and acquisitions (M&A) were announced. The "big" news came when an Australian firm made an unsolicited takeover bid of $39 billion for Potash Corp. of Saskatchewan Inc. (POT +0.56%). Potash Corp., the world’s largest fertilizer producer, rejected the unsolicited bid from BHP Billiton Ltd. (BHP +0.13%) as too low, but the news helped lift other fertilizer firms' shares.
The major averages ended slightly higher on Wednesday as investors looked past lackluster earnings and retail sales. The major averages opened lower after retail sales and the latest round of corporate earnings failed to impress analysts' lofty expectations. However, stocks rallied after speculation spread that the M&A market will heat up which is a net positive for equities and the economy. In other news, General Motors filed for its initial public offering (IPO) under the ticker symbol: GM.
Stocks got smacked on Thursday as investors digested a series of dismal economic data: initial jobless claims unexpectedly rose, while both leading economic indicators and the Philly Fed's general economic index fell. The Labor Department said that applications for unemployment benefits in the US jumped to the highest level since November 2009 last week which indicated that more employers are slashing jobs as the economy slows. Initial jobless claims rose by 12,000 to 500,000 in the week ended Aug. 14 and topped the Street's estimate of 478,000. Meanwhile, the Philadelphia Federal Reserve's general economic index fell to -7.7 which was below analysts' estimates and led many to question the health of the economic recovery. In other news, Intel (INTC +0.05%) announced plans to buy McAfee (MFE +0.04%) for $7.68 billion. So far, global M&A business has topped $1.22 trillion in 2010 which is +17% higher than the same time last year, according to Bloomberg. The increase in M&A business bodes well for the ongoing economic recovery. Stocks ended mixed on Friday, rebounding from a very weak open.
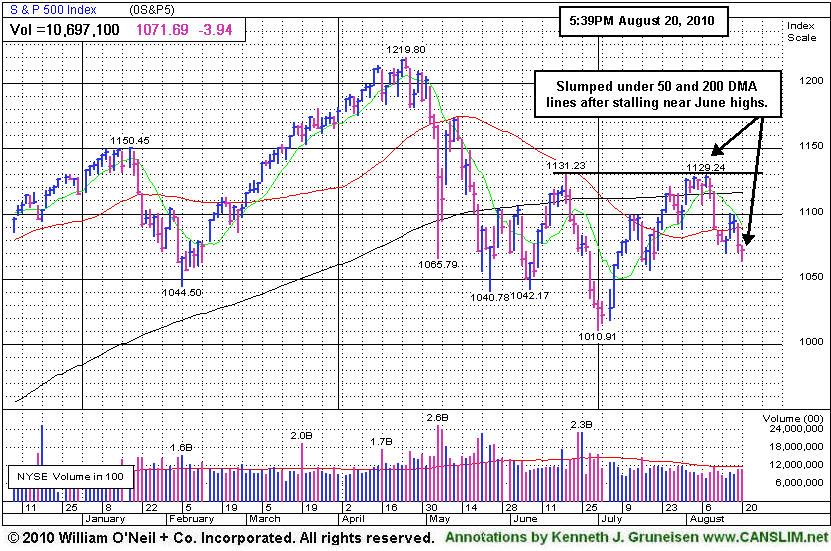
The technical action in the major averages continues to weaken. Currently, resistance for the Dow Jones Industrial Average and the benchmark S&P 500 index is their respective 200 DMA lines, while the Nasdaq Composite faces resistance at its 50 DMA line. It is also disconcerting to see the action in several leading stocks remain questionable as evidenced by the dearth of high-ranked leaders breaking out of sound bases. Thursday's action wiped out the gains enjoyed earlier in the week for the major averages which emphasizes the importance of remaining cautious until the rally is back in a confirmed uptrend. Put simply, we can expect this sideways/choppy action to continue until the market breaks out above resistance or below support (recent chart lows). The first scenario will have bullish ramifications while the second will be clearly bearish. Trade accordingly.
Does Your Broker Follow The Rules?
Our skilled team of portfolio managers knows how to follow the rules of this fact-based investment system. We do not follow opinion or the "conviction list" of some large Wall Street institution which would have us fully invested even during horrific bear markets. Instead, we remain fluid and only buy the best stocks when they are triggering proper technical buy signals. If you are not completely satisfied with the way your portfolio is being managed, Click here to submit your inquiry. *Accounts over $250,000 please. ** Serious inquires only.
PICTURED: The S&P 500 Index has slumped under its 50 and 200 DMA lines after recently stalling near its June highs.
|
|
|
 |
Semiconductor Index 50 & 200 DMA Lines Have Converged
Kenneth J. Gruneisen - Passed the CAN SLIM® Master's Exam
The tech sector traded with a slightly positive bias as the Biotechnology Index ($BTK +0.20%), Networking Index ($NWX +0.23%), Semiconductor Index ($SOX +0.45%), and Internet Index ($IIX +1.00%) posted small gains Financial shares were mixed as the Bank Index ($BKX -0.40%) slipped while the Broker/Dealer Index ($XBD +0.13%) and Retail Index ($RLX +0.19%) were slight positive influences. Commodity-linked areas were laggards on Friday as the Oil Services Index ($OSX -1.69%) and Integrated Oil Index ($XOI -1.17%) fell and the Gold & Silver Index ($XAU -0.65%) also ended modestly lower. The Healthcare Index ($HMO -0.39%) edged lower.
Charts courtesy www.stockcharts.com
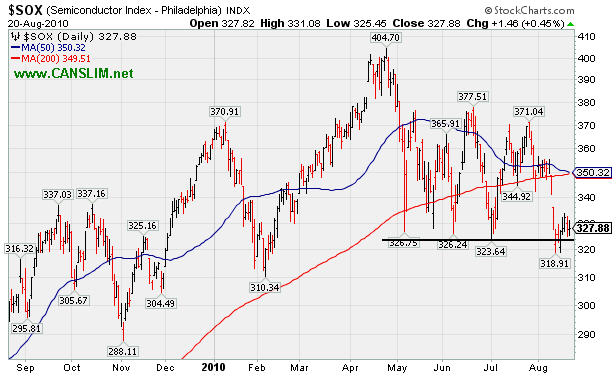
PICTURED: The Semiconductor Index ($SOX +0.45%) slumped under prior chart lows from trading between its 50 and 200 DMA lines when last shown in this IGW section. Its 50 and 200 DMA lines have now converged, which might be considered another bad technical sign for the near-term outlook for the tech sector.
| Oil Services |
$OSX |
173.59 |
-2.98 |
-1.69% |
-10.94% |
| Healthcare |
$HMO |
1,453.38 |
-5.74 |
-0.39% |
-1.33% |
| Integrated Oil |
$XOI |
948.68 |
-11.25 |
-1.17% |
-11.19% |
| Semiconductor |
$SOX |
327.88 |
+1.46 |
+0.45% |
-8.90% |
| Networking |
$NWX |
229.95 |
+0.52 |
+0.23% |
-0.48% |
| Internet |
$IIX |
250.85 |
+2.47 |
+1.00% |
+7.26% |
| Broker/Dealer |
$XBD |
103.42 |
+0.13 |
+0.13% |
-10.11% |
| Retail |
$RLX |
409.05 |
+0.77 |
+0.19% |
-0.50% |
| Gold & Silver |
$XAU |
178.13 |
-1.16 |
-0.65% |
+5.87% |
| Bank |
$BKX |
44.82 |
-0.18 |
-0.40% |
+4.94% |
| Biotech |
$BTK |
1,072.16 |
+2.12 |
+0.20% |
+13.80% |
|
|
|
 |
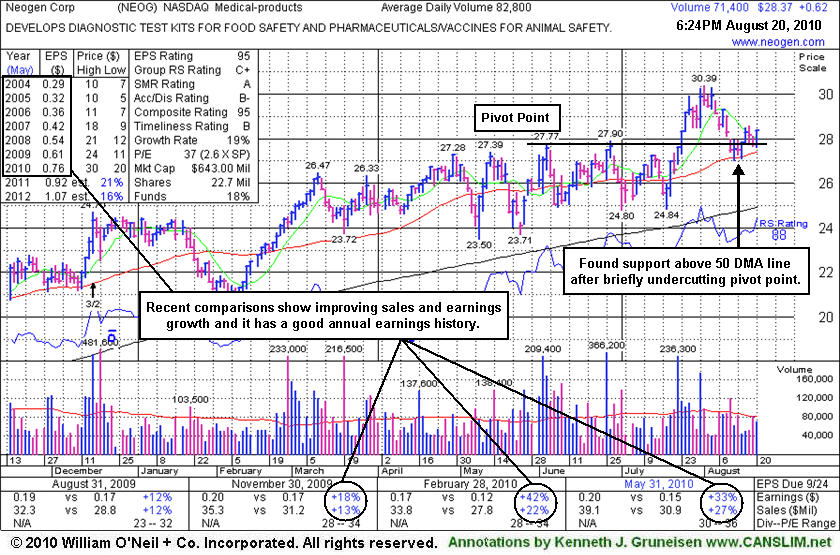
Healthy Consolidation May Offer Secondary Buy Point
Kenneth J. Gruneisen - Passed the CAN SLIM® Master's Exam
Neogen Corp.'s (NEOG +$0.62 or +2.23% to $28.37) color code was changed to yellow while consolidating in a healthy fashion just above its 50 DMA line and prior highs in the $27 area defining important technical support. Disciplined investors might consider accumulating shares on its pullback as a secondary buy point. However, weakening market conditions (M criteria) are a current concern and would argue against new buying efforts if further technical damage occurs to the major indices and this stock specifically, or both.
Its solid gain on nearly 2 times average volume resulted in it being featured in yellow the 7/22/10 mid-day report (read here) and its FSU section appearance under the headline Medical - Products Firm Returns To Featured Stocks List when it was noted - "Now it faces no resistance due to overhead supply." It went on to get extended from its prior highs and later endured some mild distributional pressure.
NEOG has a history of steady annual earnings growth (A criteria). The 2 most recent quarterly comparisons have shown improving sales revenues growth with earnings per share increases above the investment system's +25% guideline. Remember to always limit losses per the 7-8% sell rule, and never hold a stock if it falls more than that much from your purchase price. Years ago, this stock was first featured on Thursday, February 21, 2008 in the CANSLIM.net Mid Day Breakouts Report (read here) and it was later dropped from the Featured Stocks list.
|
|
|
Color Codes Explained :
Y - Better candidates highlighted by our
staff of experts.
G - Previously featured
in past reports as yellow but may no longer be buyable under the
guidelines.
***Last / Change / Volume data in this table is the closing quote data***
Symbol/Exchange
Company Name
Industry Group |
PRICE |
CHANGE
(%Change) |
Day High |
Volume
(% DAV)
(% 50 day avg vol) |
52 Wk Hi
% From Hi |
Featured
Date |
Price
Featured |
Pivot Featured |
|
Max Buy |
AAPL
-
NASDAQ
Apple Inc
COMPUTER HARDWARE - Personal Computers
|
$249.64
|
-0.24
-0.10% |
$253.92
|
13,690,139
57.26% of 50 DAV
50 DAV is 23,907,500
|
$279.01
-10.53%
|
6/17/2010
|
$270.95
|
PP = $272.56
|
|
MB = $286.19
|
 Most Recent Note - 8/20/2010 4:17:08 PM
G - Consolidating -10.5% below its 52-week high, a rally above its 50 DMA line and recent high near $266 is needed for its outlook to improve. Fundamentals remain strong, yet based on weak action it will be dropped from the Featured Stocks list tonight.
>>> The latest Featured Stock Update with an annotated graph appeared on 8/9/2010. Click here.
View all notes |
Alert me of new notes |
CANSLIM.net Company Profile |
SEC |
Zacks Reports |
StockTalk |
News |
Chart |
Request a new note
C
A N
S L
I M


|
ABV
-
NYSE
Comp De Bebidas Adr
FOOD and BEVERAGE - Beverages - Brewers
|
$110.02
|
-0.65
-0.59% |
$110.43
|
603,186
93.20% of 50 DAV
50 DAV is 647,200
|
$112.60
-2.29%
|
6/29/2010
|
$104.74
|
PP = $109.33
|
|
MB = $114.80
|
Most Recent Note - 8/20/2010 4:29:13 PM
G - This Brazil-based beverage firm is holding its ground near its all-time high. Color code was changed to green despite its resilience, as fundamental concerns were raised due to the quarter ended June 30, 2010 it reported +19% earnings on +16% sales revenues, below the +25% guidelines.
>>> The latest Featured Stock Update with an annotated graph appeared on 8/18/2010. Click here.
View all notes |
Alert me of new notes |
CANSLIM.net Company Profile |
SEC |
Zacks Reports |
StockTalk |
News |
Chart |
Request a new note
C
A N
S L
I M
|
BIDU
-
NASDAQ
Baidu Inc Ads
INTERNET - Internet Information Providers
|
$82.17
|
+0.98
1.21% |
$82.69
|
7,904,840
69.09% of 50 DAV
50 DAV is 11,440,800
|
$88.32
-6.96%
|
7/14/2010
|
$75.03
|
PP = $78.59
|
|
MB = $82.52
|
Most Recent Note - 8/20/2010 4:30:51 PM
G - This week it quietly consolidated under its "max buy" level, however more time is needed for it to form a sound new base. Volume totals have been cooling while it consolidates above prior highs that define technical support along with its 50 DMA line.
>>> The latest Featured Stock Update with an annotated graph appeared on 8/13/2010. Click here.
View all notes |
Alert me of new notes |
CANSLIM.net Company Profile |
SEC |
Zacks Reports |
StockTalk |
News |
Chart |
Request a new note
C
A N
S L
I M
|
CACC
-
NASDAQ
Credit Acceptance Corp
FINANCIAL SERVICES - Credit Services
|
$59.12
|
-0.30
-0.50% |
$59.37
|
39,504
73.43% of 50 DAV
50 DAV is 53,800
|
$61.41
-3.73%
|
7/29/2010
|
$52.04
|
PP = $54.07
|
|
MB = $56.77
|
Most Recent Note - 8/20/2010 4:39:44 PM
G - Rebounded and closed near the session high today. Extended from its prior base, previous resistance near $54 defines initial chart support to watch.
>>> The latest Featured Stock Update with an annotated graph appeared on 8/2/2010. Click here.
View all notes |
Alert me of new notes |
CANSLIM.net Company Profile |
SEC |
Zacks Reports |
StockTalk |
News |
Chart |
Request a new note
C
A N
S L
I M
|
CRM
-
NYSE
Salesforce.Com Inc
INTERNET - Internet Software and Services
|
$112.75
|
+16.34
16.95% |
$112.99
|
10,608,833
469.23% of 50 DAV
50 DAV is 2,260,900
|
$104.44
7.96%
|
6/2/2010
|
$88.44
|
PP = $89.60
|
|
MB = $94.08
|
Most Recent Note - 8/20/2010 12:48:33 PM
G - Gapped up today for a considerable gain and new all-time high. It reported sales +25% and earnings +0% versus the year ago period ended July 31st, marking its second consecutive quarterly comparison with earnings per share below the +25% guideline.
>>> The latest Featured Stock Update with an annotated graph appeared on 8/16/2010. Click here.
View all notes |
Alert me of new notes |
CANSLIM.net Company Profile |
SEC |
Zacks Reports |
StockTalk |
News |
Chart |
Request a new note
C
A N
S L
I M
|
Symbol/Exchange
Company Name
Industry Group |
PRICE |
CHANGE
(%Change) |
Day High |
Volume
(% DAV)
(% 50 day avg vol) |
52 Wk Hi
% From Hi |
Featured
Date |
Price
Featured |
Pivot Featured |
|
Max Buy |
EGO
-
NYSE
Eldorado Gold Corp
METALS and MINING - Gold
|
$18.42
|
-0.11
-0.59% |
$18.45
|
2,486,952
58.12% of 50 DAV
50 DAV is 4,278,800
|
$19.07
-3.41%
|
8/19/2010
|
$18.25
|
PP = $19.17
|
|
MB = $20.13
|
Most Recent Note - 8/20/2010 4:44:55 PM
Y - Quietly consolidating, this Canada-based mining firm has built a longer base-on-base type pattern. It was featured in the 8/19/10 mid-day report (read here) in yellow with a pivot point based on its 52-week high plus ten cents. EGO reported great sales and earnings increases in Mar and Jun '10 quarterly comparisons.
>>> The latest Featured Stock Update with an annotated graph appeared on 8/19/2010. Click here.
View all notes |
Alert me of new notes |
CANSLIM.net Company Profile |
SEC |
Zacks Reports |
StockTalk |
News |
Chart |
Request a new note
C
A N
S L
I M
|
FFIV
-
NASDAQ
F 5 Networks Inc
INTERNET - Internet Software and Services
|
$91.04
|
+2.31
2.60% |
$91.63
|
1,420,238
82.57% of 50 DAV
50 DAV is 1,720,000
|
$92.70
-1.79%
|
6/16/2010
|
$74.50
|
PP = $74.10
|
|
MB = $77.81
|
Most Recent Note - 8/20/2010 4:48:24 PM
G - Closed at a new high on its weekly chart with this week's gain on light volume. Recently noted as -"extended from any sound base after recent volume-driven gains, it could go on to produce more climactic gains."
>>> The latest Featured Stock Update with an annotated graph appeared on 8/4/2010. Click here.
View all notes |
Alert me of new notes |
CANSLIM.net Company Profile |
SEC |
Zacks Reports |
StockTalk |
News |
Chart |
Request a new note
C
A N
S L
I M
|
FOSL
-
NASDAQ
Fossil Inc
CONSUMER DURABLES - Recreational Goods, Other
|
$44.15
|
+0.01
0.02% |
$44.27
|
489,391
56.21% of 50 DAV
50 DAV is 870,700
|
$46.30
-4.64%
|
8/10/2010
|
$45.54
|
PP = $42.69
|
|
MB = $44.82
|
Most Recent Note - 8/20/2010 4:56:18 PM
Y - Consolidating quietly in a tight range since its considerable "breakaway gap" on 8/10/10 for a new 52-week high and all-time high.
>>> The latest Featured Stock Update with an annotated graph appeared on 8/11/2010. Click here.
View all notes |
Alert me of new notes |
CANSLIM.net Company Profile |
SEC |
Zacks Reports |
StockTalk |
News |
Chart |
Request a new note
C
A N
S L
I M
|
GMCR
-
NASDAQ
Green Mtn Coffee Roastrs
FOOD and BEVERAGE - Processed and Packaged Goods
|
$32.46
|
+0.01
0.03% |
$32.62
|
1,723,970
71.28% of 50 DAV
50 DAV is 2,418,600
|
$33.98
-4.47%
|
8/17/2010
|
$33.62
|
PP = $33.30
|
|
MB = $34.97
|
Most Recent Note - 8/20/2010 4:58:27 PM
Y - Quietly consolidating since featured in yellow again in the 8/17/10 mid-day report as it hit a new 52-week high, rising from a 19-week cup shaped pattern without forming a handle. It showed great resilience in rebounding from lows since it was dropped from the Featured Stocks list on 4/28/10. The number of top-rated funds owning its shares rose to 124 in Jun '10 from 111 in Mar '10. GMCR rallied more than 5-fold from its November '08 low.
>>> The latest Featured Stock Update with an annotated graph appeared on 8/17/2010. Click here.
View all notes |
Alert me of new notes |
CANSLIM.net Company Profile |
SEC |
Zacks Reports |
StockTalk |
News |
Chart |
Request a new note
C
A N
S L
I M
|
MELI
-
NASDAQ
Mercadolibre Inc
INTERNET - Internet Software and; Services
|
$69.66
|
+1.96
2.90% |
$69.81
|
668,448
63.24% of 50 DAV
50 DAV is 1,057,000
|
$70.32
-0.94%
|
5/13/2010
|
$54.21
|
PP = $55.85
|
|
MB = $58.64
|
Most Recent Note - 8/20/2010 5:01:27 PM
G - Perched at its 52-week high after considerable gains, extended from any sound base. Prior highs in the $62 area define initial chart support.
>>> The latest Featured Stock Update with an annotated graph appeared on 7/23/2010. Click here.
View all notes |
Alert me of new notes |
CANSLIM.net Company Profile |
SEC |
Zacks Reports |
StockTalk |
News |
Chart |
Request a new note
C
A N
S L
I M
|
Symbol/Exchange
Company Name
Industry Group |
PRICE |
CHANGE
(%Change) |
Day High |
Volume
(% DAV)
(% 50 day avg vol) |
52 Wk Hi
% From Hi |
Featured
Date |
Price
Featured |
Pivot Featured |
|
Max Buy |
MRX
-
NYSE
Medicis Pharmaceut Cl A
DRUGS - Biotechnology
|
$27.06
|
+0.56
2.11% |
$27.10
|
996,036
89.14% of 50 DAV
50 DAV is 1,117,400
|
$28.15
-3.87%
|
8/12/2010
|
$26.88
|
PP = $26.71
|
|
MB = $28.05
|
Most Recent Note - 8/20/2010 5:04:40 PM
Y - Small gain today on light volume. The high-ranked Medical - Ethical Drugs firm is holding its ground above prior chart highs since its 8/06/10 breakout from a sound base.
>>> The latest Featured Stock Update with an annotated graph appeared on 8/12/2010. Click here.
View all notes |
Alert me of new notes |
CANSLIM.net Company Profile |
SEC |
Zacks Reports |
StockTalk |
News |
Chart |
Request a new note
C
A N
S L
I M
|
MWIV
-
NASDAQ
M W I Veterinary Supply
HEALTH SERVICES - Medical Instruments and; Supplies
|
$52.26
|
+1.08
2.11% |
$52.46
|
61,169
81.78% of 50 DAV
50 DAV is 74,800
|
$54.48
-4.07%
|
7/29/2010
|
$52.05
|
PP = $52.09
|
|
MB = $54.69
|
Most Recent Note - 8/20/2010 5:07:14 PM
Y - Repaired its 50 DMA line violation with solid gains on volume this week bringing an impressive technical improvement. Recent lows in the $46 area define an important chart support level.
>>> The latest Featured Stock Update with an annotated graph appeared on 7/30/2010. Click here.
View all notes |
Alert me of new notes |
CANSLIM.net Company Profile |
SEC |
Zacks Reports |
StockTalk |
News |
Chart |
Request a new note
C
A N
S L
I M
|
NEM
-
NYSE
Newmont Mining Corp
METALS and MINING - Gold
|
$58.02
|
-0.42
-0.72% |
$58.24
|
4,290,796
54.03% of 50 DAV
50 DAV is 7,941,800
|
$63.38
-8.46%
|
6/22/2010
|
$59.60
|
PP = $59.67
|
|
MB = $62.65
|
Most Recent Note - 8/20/2010 5:11:34 PM
Y - Near its 50 DMA line now after a few weeks of consolidation with volume totals cooling since it was hit with heavy distribution in late July.
>>> The latest Featured Stock Update with an annotated graph appeared on 8/6/2010. Click here.
View all notes |
Alert me of new notes |
CANSLIM.net Company Profile |
SEC |
Zacks Reports |
StockTalk |
News |
Chart |
Request a new note
C
A N
S L
I M
|
NEOG
-
NASDAQ
Neogen Corp
DRUGS - Diagnostic Substances
|
$28.37
|
+0.62
2.23% |
$28.37
|
71,356
83.36% of 50 DAV
50 DAV is 85,600
|
$30.39
-6.65%
|
7/22/2010
|
$27.19
|
PP = $27.87
|
|
MB = $29.26
|
Most Recent Note - 8/20/2010 5:14:11 PM
Y- Color code is changed to yellow while consolidating in a healthy fashion just above its 50 DMA line and prior highs in the $27 area defining important technical support.
>>> The latest Featured Stock Update with an annotated graph appeared on 7/22/2010. Click here.
View all notes |
Alert me of new notes |
CANSLIM.net Company Profile |
SEC |
Zacks Reports |
StockTalk |
News |
Chart |
Request a new note
C
A N
S L
I M
|
NFLX
-
NASDAQ
Netflix Inc
SPECIALTY RETAIL - Music and Video Stores
|
$129.96
|
+1.72
1.34% |
$130.76
|
3,460,025
80.34% of 50 DAV
50 DAV is 4,306,600
|
$140.90
-7.76%
|
8/10/2010
|
$124.05
|
PP = $124.00
|
|
MB = $130.20
|
Most Recent Note - 8/20/2010 5:17:18 PM
Y- This week it found support near its prior high of $124 noted as an important support level to watch.
>>> The latest Featured Stock Update with an annotated graph appeared on 8/10/2010. Click here.
View all notes |
Alert me of new notes |
CANSLIM.net Company Profile |
SEC |
Zacks Reports |
StockTalk |
News |
Chart |
Request a new note
C
A N
S L
I M
|
Symbol/Exchange
Company Name
Industry Group |
PRICE |
CHANGE
(%Change) |
Day High |
Volume
(% DAV)
(% 50 day avg vol) |
52 Wk Hi
% From Hi |
Featured
Date |
Price
Featured |
Pivot Featured |
|
Max Buy |
ROVI
-
NASDAQ
Rovi Corp
COMPUTER SOFTWARE andamp; SERVICES - Security Software andamp; Services
|
$43.09
|
+0.60
1.41% |
$43.12
|
643,934
56.14% of 50 DAV
50 DAV is 1,147,000
|
$44.96
-4.16%
|
6/3/2010
|
$38.70
|
PP = $40.16
|
|
MB = $42.17
|
Most Recent Note - 8/20/2010 5:18:50 PM
G - Today it gapped down then managed a positive reversal and closed at the session high. Prior highs in the $40 area and its 50 DMA line define chart support.
>>> The latest Featured Stock Update with an annotated graph appeared on 7/21/2010. Click here.
View all notes |
Alert me of new notes |
CANSLIM.net Company Profile |
SEC |
Zacks Reports |
StockTalk |
News |
Chart |
Request a new note
C
A N
S L
I M
|
SHOO
-
NASDAQ
Steven Madden Limited
CONSUMER NON-DURABLES - Textile - Apparel Footwear
|
$36.33
|
+0.39
1.09% |
$36.38
|
155,125
35.55% of 50 DAV
50 DAV is 436,400
|
$40.98
-11.35%
|
8/5/2010
|
$39.55
|
PP = $41.08
|
|
MB = $43.13
|
Most Recent Note - 8/20/2010 5:21:28 PM
G -Consolidating just above its 50 DMA line with volume totals cooling, finishing -11.5% off its 52-week high.
>>> The latest Featured Stock Update with an annotated graph appeared on 8/5/2010. Click here.
View all notes |
Alert me of new notes |
CANSLIM.net Company Profile |
SEC |
Zacks Reports |
StockTalk |
News |
Chart |
Request a new note
C
A N
S L
I M
|
VIT
-
NYSE
Vanceinfo Tech Inc Ads
COMPUTER SOFTWARE and SERVICES - Business Software and Services
|
$27.34
|
+0.69
2.59% |
$27.42
|
469,156
88.64% of 50 DAV
50 DAV is 529,300
|
$27.96
-2.22%
|
7/8/2010
|
$25.20
|
PP = $26.58
|
|
MB = $27.91
|
Most Recent Note - 8/20/2010 5:22:54 PM
Y - Rallied up from its 50 DMA line this week after enduring distributional pressure. Minimal resistance remains due to overhead supply now.
>>> The latest Featured Stock Update with an annotated graph appeared on 7/26/2010. Click here.
View all notes |
Alert me of new notes |
CANSLIM.net Company Profile |
SEC |
Zacks Reports |
StockTalk |
News |
Chart |
Request a new note
C
A N
S L
I M
|
|
|
|
THESE ARE NOT BUY RECOMMENDATIONS!
Comments contained in the body of this report are technical
opinions only. The material herein has been obtained
from sources believed to be reliable and accurate, however,
its accuracy and completeness cannot be guaranteed.
This site is not an investment advisor, hence it does
not endorse or recommend any securities or other investments.
Any recommendation contained in this report may not
be suitable for all investors and it is not to be deemed
an offer or solicitation on our part with respect to
the purchase or sale of any securities. All trademarks,
service marks and trade names appearing in this report
are the property of their respective owners, and are
likewise used for identification purposes only.
This report is a service available
only to active Paid Premium Members.
You may opt-out of receiving report notifications
at any time. Questions or comments may be submitted
by writing to Premium Membership Services 665 S.E. 10 Street, Suite 201 Deerfield Beach, FL 33441-5634 or by calling 1-800-965-8307
or 954-785-1121.
|
|
|


