You are not logged in.
This means you
CAN ONLY VIEW reports that were published prior to Monday, April 14, 2025.
You
MUST UPGRADE YOUR MEMBERSHIP if you want to see any current reports.
AFTER MARKET UPDATE - TUESDAY, AUGUST 19TH, 2014
Previous After Market Report Next After Market Report >>>
|
|
|
|
DOW |
+80.85 |
16,919.59 |
+0.48% |
|
Volume |
544,363,070 |
-8% |
|
Volume |
1,440,846,820 |
-1% |
|
NASDAQ |
+19.20 |
4,527.51 |
+0.43% |
|
Advancers |
1,957 |
62% |
|
Advancers |
1,486 |
52% |
|
S&P 500 |
+9.86 |
1,981.60 |
+0.50% |
|
Decliners |
1,082 |
34% |
|
Decliners |
1,244 |
44% |
|
Russell 2000 |
+4.07 |
1,162.47 |
+0.35% |
|
52 Wk Highs |
180 |
|
|
52 Wk Highs |
100 |
|
|
S&P 600 |
+2.69 |
669.33 |
+0.40% |
|
52 Wk Lows |
18 |
|
|
52 Wk Lows |
32 |
|
|
 |
Major Averages Rose Again With Lighter Volume Totals
Kenneth J. Gruneisen - Passed the CAN SLIM® Master's Exam
The major averages continued their winning ways on Tuesday. Volume totals were lighter on both major exchanges. Breadth was positive as advancers led decliners by nearly a 2-1 margin on the NYSE but by a narrower 7-6 margin on the NASDAQ exchange. Leadership expanded as there were 68 high-ranked companies from the CANSLIM.net Leaders List that made new 52-week highs and appeared on the CANSLIM.net BreakOuts Page, up from the prior session total of 56 stocks. New 52-week highs outnumbered new 52-week lows on the NYSE and on the Nasdaq exchange. There were gains for 5 of the 11 of the high-ranked companies currently included on the Featured Stocks Page. The improved action in the broader market (M criteria) has been considered significant enough to shift back to a "confirmed uptrend" while leadership (stocks hitting new 52-week highs) has remained healthy. Remember that disciplined investors buy stocks with superior fundamentals only after they have triggered a proper technical buy signal.
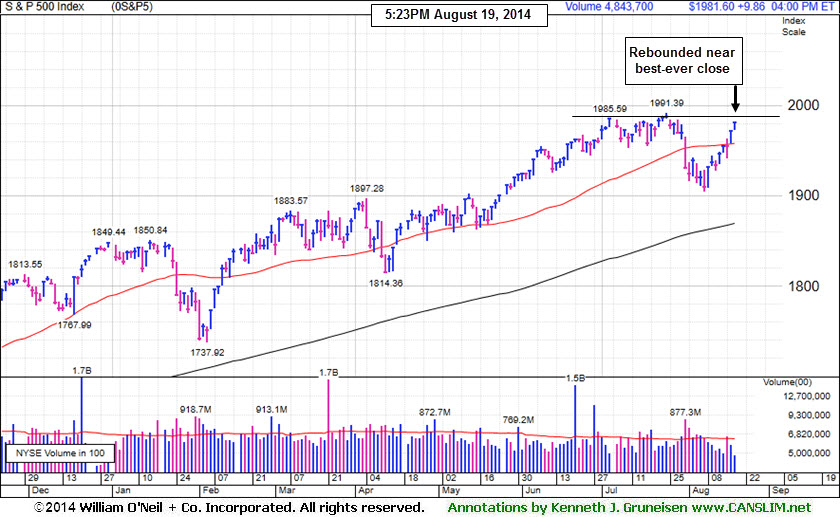 PICTURED: The S&P 500 Index moved closer toward its all-time high as it gained 9 points to 1,981.
The NASDAQ increased 19 points to 4,527. Dow Jones Industrial Average rose 80 points to 16,919. Stocks advanced thanks to better-than-expected economic data. Housing starts unexpectedly jumped to an eight-month high in July while a separate report showed building permits increased the most since last April. As a result, homebuilders staged a rally for a second day. Toll Brothers (TOL +2.23%) and PulteGroup (PHM +1.49%). Other data revealed consumer prices rose at the slowest pace in five months.
Nine of the 10 sectors in the S&P 500 advanced. Utilities and energy were among the best performing groups as Dominion Resources (D +1.32%) and Chevron (CVX +1.05%) rose. Gains in consumer discretionary also helped lift the market amid some positive retailer profit tallies. Home Depot (HD +5.55%) and TJX Cos. (TJX +8.65%) rose after both companies posted second-quarter earnings results above analyst estimates. In tech, Apple (AAPL +1.38%) rose above $100 for the first time since its stock split as the iPhone maker advanced.
Treasuries erased early gains and finished lower. The 10-year note declined 2/32 to yield 2.40%. The 30-year bond fell 9/32 to yield 3.21%.
The CANSLIM.net Featured Stocks Page shows the most action-worthy candidates and their latest notes and a Headline Link directs members to the latest detailed analysis with data-packed graphs annotated by a Certified expert along with links to additional resources. The Premium Member Homepage includes "dynamic archives" to all prior pay reports published.
|
 Kenneth J. Gruneisen started out as a licensed stockbroker in August 1987, a couple of months prior to the historic stock market crash that took the Dow Jones Industrial Average down -22.6% in a single day. He has published daily fact-based fundamental and technical analysis on high-ranked stocks online for two decades. Through FACTBASEDINVESTING.COM, Kenneth provides educational articles, news, market commentary, and other information regarding proven investment systems that work in good times and bad.
Comments contained in the body of this report are technical opinions only and are not necessarily those of Gruneisen Growth Corp. The material herein has been obtained from sources believed to be reliable and accurate, however, its accuracy and completeness cannot be guaranteed. Our firm, employees, and customers may effect transactions, including transactions contrary to any recommendation herein, or have positions in the securities mentioned herein or options with respect thereto. Any recommendation contained in this report may not be suitable for all investors and it is not to be deemed an offer or solicitation on our part with respect to the purchase or sale of any securities. |
|
 |
Retail, Tech, and Energy-Related Groups Rose
Kenneth J. Gruneisen - Passed the CAN SLIM® Master's Exam
The Retail Index ($RLX +1.89%) was a influential group gainer and the Networking Index ($NWX +1.18%) led the tech sector higher while the Semiconductor Index ($SOX +0.64%) and the Biotechnology Index ($BTK +0.43%) posted smaller gains. The Bank Index ($BKX +0.06%) finished flat and the Broker/Dealer Index ($XBD -0.45%) lost ground creating a slight drag on the major averages. Commodity-linked groups were mixed as the Gold & Silver Index ($XAU -0.85%) fell while the Integrated Oil Index ($XOI +0.93%) and the Oil Services Index ($OSX +0.97%) both rose.
Charts courtesy www.stockcharts.com
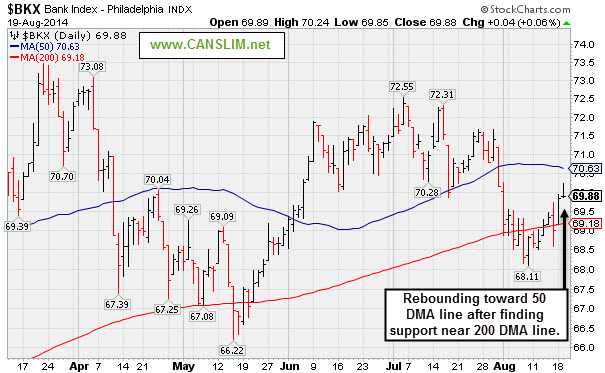
PICTURED: The Bank Index ($BKX +0.06%) is rebounding toward its 50-day moving average (DMA) line after finding support near its 200 DMA line.
| Oil Services |
$OSX |
288.18 |
+2.76 |
+0.97% |
+2.54% |
| Integrated Oil |
$XOI |
1,663.17 |
+15.40 |
+0.93% |
+10.65% |
| Semiconductor |
$SOX |
631.47 |
+4.00 |
+0.64% |
+18.03% |
| Networking |
$NWX |
328.26 |
+3.83 |
+1.18% |
+1.33% |
| Broker/Dealer |
$XBD |
164.26 |
-0.75 |
-0.45% |
+2.31% |
| Retail |
$RLX |
934.51 |
+17.37 |
+1.89% |
-0.56% |
| Gold & Silver |
$XAU |
101.60 |
-0.87 |
-0.85% |
+20.74% |
| Bank |
$BKX |
69.88 |
+0.04 |
+0.06% |
+0.90% |
| Biotech |
$BTK |
2,953.03 |
+12.60 |
+0.43% |
+26.72% |
|
|
|
 |
Encountered Distributional Peressure Near Prior High
Kenneth J. Gruneisen - Passed the CAN SLIM® Master's Exam
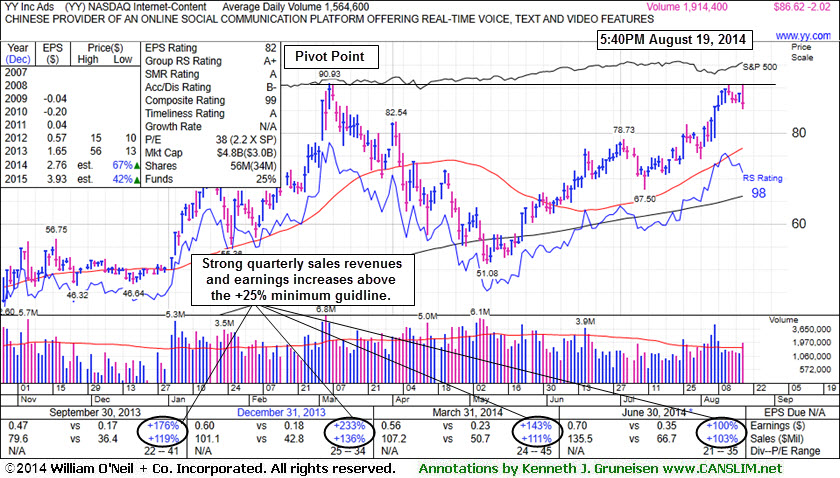
YY Inc (YY -$2.02 or -2.28% to $86.62) was highlighted in yellow with a new pivot point cited based on its 3/06/14 high plus 10 cents in the earlier mid-day report (read here). The Chinese Internet - Content firm reversed into the red today after again challenging its 52-week high, a sign it was encountering distributional pressure near its prior highs. Subsequent volume-driven gains for new highs may trigger a new technical buy signal. There is no advantage to be gained by getting in "early" before fresh proof of heavy institutional buying demand, so patience and proper discipline are paramount.
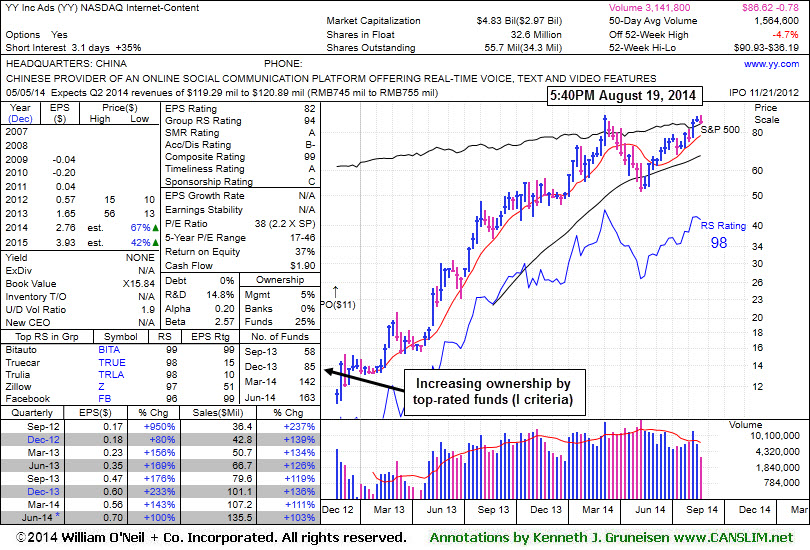
Fundamentals through the Jun '14 quarter remain very strong. The Internet - Content firm reported earnings +100% on +103% sales revenues for the Jun '14 quarter, and its great record of strong earnings and sales revenues increases in quarterly comparisons satisfies the C criteria. Its limited annual earnings (A criteria) history is a concern and it is up considerably from its $11 IPO on 11/21/12. The number of top-rated funds owning its shares rose from 58 in Sep '13 to 163 in Jun '14, a reassuring sign concerning the I criteria.
It rebounded after a deep consolidation since dropped from the Featured Stocks list on 1/27/14 amid widespread weakness in China-related companies. It was last shown in this FSU section on 1/03/14 with annotated graphs under the headline, "Finished Strong With High Volume After Featured in Mid-Day Report". Disciplined investors avoid chasing extended stocks more than +5% above prior highs and always limit losses by selling if any stock falls more than -7% from their purchase price.
|
|
|
Color Codes Explained :
Y - Better candidates highlighted by our
staff of experts.
G - Previously featured
in past reports as yellow but may no longer be buyable under the
guidelines.
***Last / Change / Volume data in this table is the closing quote data***
Symbol/Exchange
Company Name
Industry Group |
PRICE |
CHANGE
(%Change) |
Day High |
Volume
(% DAV)
(% 50 day avg vol) |
52 Wk Hi
% From Hi |
Featured
Date |
Price
Featured |
Pivot Featured |
|
Max Buy |
ACT
-
NYSE
Actavis plc
Medical-Generic Drugs
|
$223.08
|
+5.01
2.30% |
$223.70
|
2,332,261
91.39% of 50 DAV
50 DAV is 2,552,000
|
$230.77
-3.33%
|
6/20/2014
|
$216.53
|
PP = $230.87
|
|
MB = $242.41
|
Most Recent Note - 8/18/2014 7:01:15 PM
G - Inched higher today for as 5th consecutive gain on light volume, rebounding above its 50 DMA line helping its outlook to improve. Reported earnings +70% on +34% sales revenues for the Jun '14 quarter.
>>> FEATURED STOCK ARTICLE : Enduring Distributional Pressure While Sputtering Near 50-Day Average - 8/5/2014
View all notes |
Set NEW NOTE alert |
CANSLIM.net Company Profile |
SEC
News |
Chart |
Request a new note
C
A N
S L
I M


|
AFSI
-
NASDAQ
Amtrust Financial Svcs
INSURANCE - Property and; Casualty Insurance
|
$43.01
|
-1.96
-4.36% |
$45.06
|
1,011,011
233.81% of 50 DAV
50 DAV is 432,400
|
$47.10
-8.68%
|
5/21/2014
|
$44.85
|
PP = $44.85
|
|
MB = $47.09
|
 Most Recent Note - 8/19/2014 12:01:51 PM
G - Down considerably today testing support at its 50 DMA line. Reversed into the red after challenging its 52-week high on the prior session. Reported +79% earnings on +56% sales for the Jun '14 quarter. Faces resistance due to overhead supply up through the $47 level. See the latest FSU analysis for more details and new annotated graphs.
>>> FEATURED STOCK ARTICLE : Relative Strength Rating Slumped While Building Longer Base - 8/18/2014
View all notes |
Set NEW NOTE alert |
CANSLIM.net Company Profile |
SEC
News |
Chart |
Request a new note
C
A N
S L
I M
|
BITA
-
NYSE
Bitauto Hldgs Ltd Ads
Internet-Content
|
$82.23
|
-0.05
-0.06% |
$84.99
|
3,397,083
341.76% of 50 DAV
50 DAV is 994,000
|
$82.63
-0.48%
|
6/26/2014
|
$46.20
|
PP = $47.03
|
|
MB = $49.38
|
Most Recent Note - 8/19/2014 12:10:23 PM
G - Reversed into the red today after hitting yet another new 52-week high following 9 consecutive gains. Has the look of a "climax run" after getting very extended from its prior base. Its 50 DMA line ($54.30) defines important near-term support to watch on pullbacks.
>>> FEATURED STOCK ARTICLE : Perched at High After 3 Consecutive Volume-Driven Gains - 8/8/2014
View all notes |
Set NEW NOTE alert |
CANSLIM.net Company Profile |
SEC
News |
Chart |
Request a new note
C
A N
S L
I M
|
EQM
-
NYSE
E Q T Midstream Partners
ENERGY - Oil and Gas Pipelines
|
$92.73
|
+1.15
1.26% |
$92.83
|
88,273
25.22% of 50 DAV
50 DAV is 350,000
|
$102.51
-9.54%
|
12/12/2013
|
$53.17
|
PP = $56.51
|
|
MB = $59.34
|
Most Recent Note - 8/18/2014 7:05:44 PM
G - Its 50 DMA line acted as a resistance level. Subsequent gains above that important short-term average are needed to help its technical stance improve. Reported earnings +37% on +21% sales revenues for the Jun '14 quarter, an improvement after 2 sub par quarterly earnings comparisons.
>>> FEATURED STOCK ARTICLE : Following 50-Day Moving Average Violation Gains Lacked Volume - 8/7/2014
View all notes |
Set NEW NOTE alert |
CANSLIM.net Company Profile |
SEC
News |
Chart |
Request a new note
C
A N
S L
I M
|
FB
-
NASDAQ
Facebook Inc Cl A
INTERNET
|
$75.29
|
+0.70
0.94% |
$75.58
|
26,510,549
64.05% of 50 DAV
50 DAV is 41,389,000
|
$76.74
-1.89%
|
7/24/2014
|
$76.00
|
PP = $72.69
|
|
MB = $76.32
|
Most Recent Note - 8/18/2014 7:06:52 PM
Y - Volume totals have generally been cooling while consolidating near its pivot point, stubbornly holding its ground after gapping up on 7/24/14. Prior highs in the $72 area define initial support above its 50 DMA line ($68.91).
>>> FEATURED STOCK ARTICLE : Breakaway Gap May Signal Beginning of Meaningful Rally - 7/24/2014
View all notes |
Set NEW NOTE alert |
CANSLIM.net Company Profile |
SEC
News |
Chart |
Request a new note
C
A N
S L
I M
|
Symbol/Exchange
Company Name
Industry Group |
PRICE |
CHANGE
(%Change) |
Day High |
Volume
(% DAV)
(% 50 day avg vol) |
52 Wk Hi
% From Hi |
Featured
Date |
Price
Featured |
Pivot Featured |
|
Max Buy |
PANW
-
NYSE
Palo Alto Networks
Computer Sftwr-Security
|
$85.39
|
-0.19
-0.22% |
$87.70
|
1,032,572
71.21% of 50 DAV
50 DAV is 1,450,000
|
$87.79
-2.73%
|
7/30/2014
|
$84.21
|
PP = $85.88
|
|
MB = $90.17
|
Most Recent Note - 8/19/2014 5:57:55 PM
Y - Reversed into the red today while hovering near its 52-week high. Volume should be at least +40% above average behind gains above a stock's pivot point to trigger a proper technical buy signal. Its 50 DMA line ($80.50) defines important near-term support.
>>> FEATURED STOCK ARTICLE : Building on New Base Pattern Above 50-Day Average - 8/11/2014
View all notes |
Set NEW NOTE alert |
CANSLIM.net Company Profile |
SEC
News |
Chart |
Request a new note
C
A N
S L
I M
|
TARO
-
NYSE
Taro Pharmaceutical Inds
DRUGS - Drug Manufacturers - Other
|
$152.35
|
-1.73
-1.12% |
$156.15
|
162,587
208.44% of 50 DAV
50 DAV is 78,000
|
$158.25
-3.73%
|
7/30/2014
|
$144.24
|
PP = $149.99
|
|
MB = $157.49
|
Most Recent Note - 8/19/2014 12:43:28 PM
G - Recently churning above average volume while remaining perched at its 52-week high, enduring distributional pressure. Found support at its 50 DMA line while building on its latest base pattern. Reported earnings -18% on -15% sales revenues for the Jun '14 quarter, below the +25% minimum earnings guideline (C criteria) raising fundamental concerns and its color code was changed to green.
>>> FEATURED STOCK ARTICLE : Still Building on an Advanced Base Pattern - 8/6/2014
View all notes |
Set NEW NOTE alert |
CANSLIM.net Company Profile |
SEC
News |
Chart |
Request a new note
C
A N
S L
I M
|
TRN
-
NYSE
Trinity Industries Inc
TRANSPORTATION - Railroads
|
$46.17
|
+0.81
1.79% |
$47.49
|
4,156,842
153.79% of 50 DAV
50 DAV is 2,703,000
|
$47.83
-3.47%
|
4/30/2014
|
$37.79
|
PP = $38.03
|
|
MB = $39.93
|
Most Recent Note - 8/19/2014 12:48:08 PM
G - Poised for a best-ever close with today's small gap up gain but it has not formed a sound base and its color code is changed to green. Promptly rebounded above its 50 DMA line following a brief violation, a sign of encouraging support. Reported earnings +91% on +39% sales for the Jun '14 quarter.
>>> FEATURED STOCK ARTICLE : Earnings News Due Following Tuesday's Close - 7/28/2014
View all notes |
Set NEW NOTE alert |
CANSLIM.net Company Profile |
SEC
News |
Chart |
Request a new note
C
A N
S L
I M
|
UA
-
NYSE
Under Armour Inc Cl A
CONSUMER NON-DURABLES - Textile - Apparel Clothing
|
$70.12
|
-0.06
-0.09% |
$71.79
|
2,121,171
87.11% of 50 DAV
50 DAV is 2,435,000
|
$70.94
-1.16%
|
7/10/2014
|
$58.50
|
PP = $60.79
|
|
MB = $63.83
|
Most Recent Note - 8/18/2014 7:11:08 PM
G - Recently reported earnings +0% on +34% sales revenues for the Jun '14 quarter, below the +25% minimum earnings guideline (C criteria), yet the company raised its guidance. Finished at a new all-time high close today and no resistance remains due to overhead supply.
>>> FEATURED STOCK ARTICLE : Bullish Action Despite Latest Earnings Below +25% Minimum Guideline - 7/30/2014
View all notes |
Set NEW NOTE alert |
CANSLIM.net Company Profile |
SEC
News |
Chart |
Request a new note
C
A N
S L
I M
|
WLK
-
NYSE
Westlake Chemical Corp
CHEMICALS - Specialty Chemicals
|
$92.94
|
+1.16
1.26% |
$93.02
|
433,789
83.58% of 50 DAV
50 DAV is 519,000
|
$92.35
0.64%
|
4/29/2014
|
$72.79
|
PP = $69.31
|
|
MB = $72.78
|
Most Recent Note - 8/18/2014 1:40:29 PM
G - Reported earnings +11% on +6% sales revenues for the Jun '14 quarter, below the +25% minimum earnings guideline (C criteria), raising fundamental concerns. Gapped up today and hit a new 52-week high. Found support at its 50 DMA line ($85.98) where a subsequent violation would raise greater concerns and trigger a technical sell signal.
>>> FEATURED STOCK ARTICLE : Extended From Prior Base After Streak of 8 Consecutive Gains - 7/25/2014
View all notes |
Set NEW NOTE alert |
CANSLIM.net Company Profile |
SEC
News |
Chart |
Request a new note
C
A N
S L
I M
|
Symbol/Exchange
Company Name
Industry Group |
PRICE |
CHANGE
(%Change) |
Day High |
Volume
(% DAV)
(% 50 day avg vol) |
52 Wk Hi
% From Hi |
Featured
Date |
Price
Featured |
Pivot Featured |
|
Max Buy |
YY
-
NASDAQ
YY Inc Ads
INTERNET - Internet Service Providers
|
$86.62
|
-2.02
-2.28% |
$90.85
|
1,914,418
122.41% of 50 DAV
50 DAV is 1,564,000
|
$90.93
-4.74%
|
8/19/2014
|
$85.81
|
PP = $91.03
|
|
MB = $95.58
|
Most Recent Note - 8/19/2014 5:55:28 PM
Y - Finished weak after highlighted yellow with new pivot point cited based on its 3/06/14 high plus 10 cents in the earlier mid-day report (read here). The Chinese Internet - Content firm needs subsequent volume-driven gains for new highs to trigger a new technical buy signal. Fundamentals through the Jun '14 quarter remain very strong. Rebounded after a deep consolidation since dropped from the Featured Stocks list on 1/27/14 amid widespread weakness in China-related companies. See the latest FSU analysis for more details and new annotated graphs.
>>> FEATURED STOCK ARTICLE : Encountered Distributional Peressure Near Prior High - 8/19/2014
View all notes |
Set NEW NOTE alert |
CANSLIM.net Company Profile |
SEC
News |
Chart |
Request a new note
C
A N
S L
I M
|
|
|
|
THESE ARE NOT BUY RECOMMENDATIONS!
Comments contained in the body of this report are technical
opinions only. The material herein has been obtained
from sources believed to be reliable and accurate, however,
its accuracy and completeness cannot be guaranteed.
This site is not an investment advisor, hence it does
not endorse or recommend any securities or other investments.
Any recommendation contained in this report may not
be suitable for all investors and it is not to be deemed
an offer or solicitation on our part with respect to
the purchase or sale of any securities. All trademarks,
service marks and trade names appearing in this report
are the property of their respective owners, and are
likewise used for identification purposes only.
This report is a service available
only to active Paid Premium Members.
You may opt-out of receiving report notifications
at any time. Questions or comments may be submitted
by writing to Premium Membership Services 665 S.E. 10 Street, Suite 201 Deerfield Beach, FL 33441-5634 or by calling 1-800-965-8307
or 954-785-1121.
|
|
|

