***Last / Change / Volume data in this table is the closing quote data***
Symbol/Exchange
Company Name
Industry Group |
PRICE |
CHANGE
(%Change) |
Day High |
Volume
(% DAV)
(% 50 day avg vol) |
52 Wk Hi
% From Hi |
Featured
Date |
Price
Featured |
Pivot Featured |
|
Max Buy |
AAPL
-
NASDAQ
Apple Inc
COMPUTER HARDWARE - Personal Computers
|
$249.88
|
-3.19
-1.26% |
$253.46
|
15,220,800
63.67% of 50 DAV
50 DAV is 23,907,500
|
$279.01
-10.44%
|
6/17/2010
|
$270.95
|
PP = $272.56
|
|
MB = $286.19
|
Most Recent Note - 8/17/2010 4:35:52 PM
G - Small gain on light volume today. Slumped below its 50 DMA line recently and raised concerns. A rally above its recent high near $266 is needed for its outlook to improve, meanwhile the recent chart low ($239) defines an important support level.
>>> The latest Featured Stock Update with an annotated graph appeared on 8/9/2010. Click here.
View all notes |
Alert me of new notes |
CANSLIM.net Company Profile |
SEC |
Zacks Reports |
StockTalk |
News |
Chart |
Request a new note
C
A N
S L
I M


|
ABV
-
NYSE
Comp De Bebidas Adr
FOOD and BEVERAGE - Beverages - Brewers
|
$110.67
|
+0.35
0.32% |
$111.07
|
1,078,411
166.63% of 50 DAV
50 DAV is 647,200
|
$112.60
-1.71%
|
6/29/2010
|
$104.74
|
PP = $109.33
|
|
MB = $114.80
|
 Most Recent Note - 8/19/2010 12:03:18 PM
G - This Brazil-based beverage firm is holding its ground today after a new high close. Color code was changed to green despite its resilience, as fundamental concerns were raised due to the quarter ended June 30, 2010 it reported +19% earnings on +16% sales revenues, below the +25% guidelines.
>>> The latest Featured Stock Update with an annotated graph appeared on 8/18/2010. Click here.
View all notes |
Alert me of new notes |
CANSLIM.net Company Profile |
SEC |
Zacks Reports |
StockTalk |
News |
Chart |
Request a new note
C
A N
S L
I M
|
BIDU
-
NASDAQ
Baidu Inc Ads
INTERNET - Internet Information Providers
|
$81.19
|
-1.73
-2.09% |
$83.30
|
8,076,067
70.59% of 50 DAV
50 DAV is 11,440,800
|
$88.32
-8.07%
|
7/14/2010
|
$75.03
|
PP = $78.59
|
|
MB = $82.52
|
Most Recent Note - 8/19/2010 4:54:00 PM
G - Pulling back under its "max buy" level, however more time is needed for it to form a sound new base. Volume totals have been cooling while it consolidates above prior highs that define technical support along with its 50 DMA line.
>>> The latest Featured Stock Update with an annotated graph appeared on 8/13/2010. Click here.
View all notes |
Alert me of new notes |
CANSLIM.net Company Profile |
SEC |
Zacks Reports |
StockTalk |
News |
Chart |
Request a new note
C
A N
S L
I M
|
CACC
-
NASDAQ
Credit Acceptance Corp
FINANCIAL SERVICES - Credit Services
|
$59.42
|
-1.81
-2.96% |
$61.35
|
45,104
83.84% of 50 DAV
50 DAV is 53,800
|
$61.41
-3.24%
|
7/29/2010
|
$52.04
|
PP = $54.07
|
|
MB = $56.77
|
Most Recent Note - 8/19/2010 4:01:18 PM
G - Consolidating from its 52-week high with a small loss on light volume today. Extended from its prior base, previous resistance near $54 defines initial chart support to watch.
>>> The latest Featured Stock Update with an annotated graph appeared on 8/2/2010. Click here.
View all notes |
Alert me of new notes |
CANSLIM.net Company Profile |
SEC |
Zacks Reports |
StockTalk |
News |
Chart |
Request a new note
C
A N
S L
I M
|
CRM
-
NYSE
Salesforce.Com Inc
INTERNET - Internet Software and Services
|
$96.41
|
-2.92
-2.94% |
$99.90
|
3,306,921
146.27% of 50 DAV
50 DAV is 2,260,900
|
$104.44
-7.69%
|
6/2/2010
|
$88.44
|
PP = $89.60
|
|
MB = $94.08
|
Most Recent Note - 8/19/2010 4:03:47 PM
G - Loss today with above average volume indicates more distributional pressure. Testing support near prior highs in the $97 area and its 50 DMA line.
>>> The latest Featured Stock Update with an annotated graph appeared on 8/16/2010. Click here.
View all notes |
Alert me of new notes |
CANSLIM.net Company Profile |
SEC |
Zacks Reports |
StockTalk |
News |
Chart |
Request a new note
C
A N
S L
I M
|
Symbol/Exchange
Company Name
Industry Group |
PRICE |
CHANGE
(%Change) |
Day High |
Volume
(% DAV)
(% 50 day avg vol) |
52 Wk Hi
% From Hi |
Featured
Date |
Price
Featured |
Pivot Featured |
|
Max Buy |
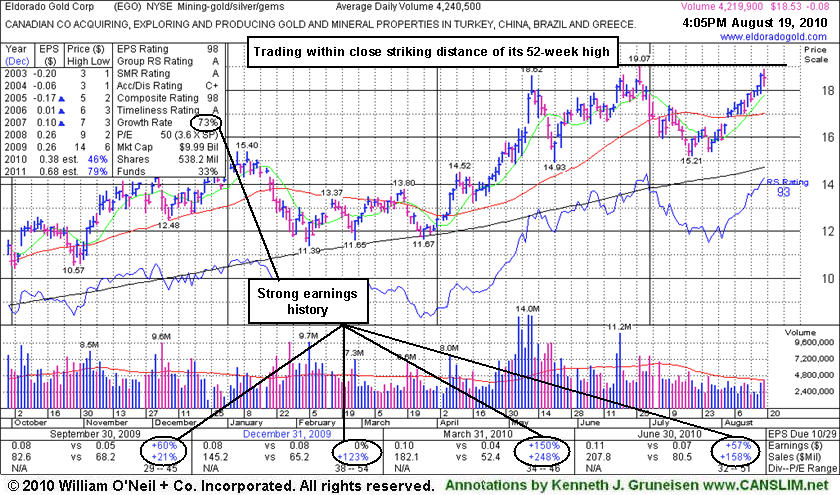
EGO
-
NYSE
Eldorado Gold Corp
METALS and MINING - Gold
|
$18.53
|
-0.08
-0.43% |
$18.89
|
4,219,112
98.61% of 50 DAV
50 DAV is 4,278,800
|
$19.07
-2.83%
|
8/19/2010
|
$18.25
|
PP = $19.17
|
|
MB = $20.13
|
Most Recent Note - 8/19/2010 4:17:01 PM
Y - Canada-based mining firm has built a longer base-on-base type pattern, and it was featured in the mid-day report today (read here) in yellow with a pivot point based on its 52-week high plus ten cents. EGO reported great sales and earnings increases in Mar and Jun '10 quarterly comparisons.
>>> The latest Featured Stock Update with an annotated graph appeared on 8/19/2010. Click here.
View all notes |
Alert me of new notes |
CANSLIM.net Company Profile |
SEC |
Zacks Reports |
StockTalk |
News |
Chart |
Request a new note
C
A N
S L
I M
|
FFIV
-
NASDAQ
F 5 Networks Inc
INTERNET - Internet Software and Services
|
$88.73
|
-0.13
-0.15% |
$89.54
|
1,165,716
67.77% of 50 DAV
50 DAV is 1,720,000
|
$92.70
-4.28%
|
6/16/2010
|
$74.50
|
PP = $74.10
|
|
MB = $77.81
|
Most Recent Note - 8/18/2010 4:35:08 PM
G - Rebounding toward its high with gains on average volume following 2 consecutive damaging gaps down last week. Recently noted as -"extended from any sound base after recent volume-driven gains, it could go on to produce more climactic gains."
>>> The latest Featured Stock Update with an annotated graph appeared on 8/4/2010. Click here.
View all notes |
Alert me of new notes |
CANSLIM.net Company Profile |
SEC |
Zacks Reports |
StockTalk |
News |
Chart |
Request a new note
C
A N
S L
I M
|
FOSL
-
NASDAQ
Fossil Inc
CONSUMER DURABLES - Recreational Goods, Other
|
$44.14
|
-0.86
-1.91% |
$44.86
|
786,322
90.31% of 50 DAV
50 DAV is 870,700
|
$46.30
-4.67%
|
8/10/2010
|
$45.54
|
PP = $42.69
|
|
MB = $44.82
|
Most Recent Note - 8/19/2010 4:39:30 PM
Y - Loss with light volume today led to a close below its "max buy" level and its color code is changed to yellow again. It has been consolidating quietly following a considerable "breakaway gap" on 8/10/10 for a new 52-week high and all-time high.
>>> The latest Featured Stock Update with an annotated graph appeared on 8/11/2010. Click here.
View all notes |
Alert me of new notes |
CANSLIM.net Company Profile |
SEC |
Zacks Reports |
StockTalk |
News |
Chart |
Request a new note
C
A N
S L
I M
|
GMCR
-
NASDAQ
Green Mtn Coffee Roastrs
FOOD and BEVERAGE - Processed and Packaged Goods
|
$32.45
|
-0.19
-0.58% |
$33.18
|
2,134,208
88.24% of 50 DAV
50 DAV is 2,418,600
|
$33.98
-4.50%
|
8/17/2010
|
$33.62
|
PP = $33.30
|
|
MB = $34.97
|
Most Recent Note - 8/18/2010 4:49:14 PM
Y - Finished near the session low today with a loss on light volume. It was featured in yellow again in the 8/17/10 mid-day report as it hit a new 52-week high, rising from a 19-week cup shaped pattern without forming a handle. It showed great resilience in rebounding from lows since it was dropped from the Featured Stocks list on 4/28/10. The number of top-rated funds owning its shares rose to 124 in Jun '10 from 111 in Mar '10. GMCR rallied more than 5-fold from its November '08 low.
>>> The latest Featured Stock Update with an annotated graph appeared on 8/17/2010. Click here.
View all notes |
Alert me of new notes |
CANSLIM.net Company Profile |
SEC |
Zacks Reports |
StockTalk |
News |
Chart |
Request a new note
C
A N
S L
I M
|
MELI
-
NASDAQ
Mercadolibre Inc
INTERNET - Internet Software and; Services
|
$67.70
|
-2.19
-3.13% |
$69.34
|
782,358
74.02% of 50 DAV
50 DAV is 1,057,000
|
$70.32
-3.72%
|
5/13/2010
|
$54.21
|
PP = $55.85
|
|
MB = $58.64
|
Most Recent Note - 8/19/2010 4:18:26 PM
G - Small gap down and loss today on light volume. Still perched near its 52-week high after considerable gains, extended from any sound base. Prior highs in the $62 area define initial chart support.
>>> The latest Featured Stock Update with an annotated graph appeared on 7/23/2010. Click here.
View all notes |
Alert me of new notes |
CANSLIM.net Company Profile |
SEC |
Zacks Reports |
StockTalk |
News |
Chart |
Request a new note
C
A N
S L
I M
|
Symbol/Exchange
Company Name
Industry Group |
PRICE |
CHANGE
(%Change) |
Day High |
Volume
(% DAV)
(% 50 day avg vol) |
52 Wk Hi
% From Hi |
Featured
Date |
Price
Featured |
Pivot Featured |
|
Max Buy |
MRX
-
NYSE
Medicis Pharmaceut Cl A
DRUGS - Biotechnology
|
$26.50
|
-0.69
-2.54% |
$27.09
|
948,888
84.92% of 50 DAV
50 DAV is 1,117,400
|
$28.15
-5.86%
|
8/12/2010
|
$26.88
|
PP = $26.71
|
|
MB = $28.05
|
Most Recent Note - 8/19/2010 4:20:25 PM
Y - Small gap down and loss today on light volume. Consolidating under its pivot point and near prior chart highs since its 8/06/10 breakout from a sound base. The high-ranked Medical - Ethical Drugs firm was featured in the mid-day report on 8/12/10 and noted for its strong quarterly and annual earnings history.
>>> The latest Featured Stock Update with an annotated graph appeared on 8/12/2010. Click here.
View all notes |
Alert me of new notes |
CANSLIM.net Company Profile |
SEC |
Zacks Reports |
StockTalk |
News |
Chart |
Request a new note
C
A N
S L
I M
|
MWIV
-
NASDAQ
M W I Veterinary Supply
HEALTH SERVICES - Medical Instruments and; Supplies
|
$51.18
|
-0.80
-1.54% |
$52.74
|
87,456
116.92% of 50 DAV
50 DAV is 74,800
|
$54.48
-6.06%
|
7/29/2010
|
$52.05
|
PP = $52.09
|
|
MB = $54.69
|
Most Recent Note - 8/19/2010 4:22:51 PM
Y - Loss today on lighter volume near average following 3 gains with above average volume. Recently repaired its 50 DMA line violation and color code was changed to yellow based on its technical improvement. Recent lows in the $46 area define important chart support level.
>>> The latest Featured Stock Update with an annotated graph appeared on 7/30/2010. Click here.
View all notes |
Alert me of new notes |
CANSLIM.net Company Profile |
SEC |
Zacks Reports |
StockTalk |
News |
Chart |
Request a new note
C
A N
S L
I M
|
NEM
-
NYSE
Newmont Mining Corp
METALS and MINING - Gold
|
$58.44
|
-1.05
-1.77% |
$60.19
|
5,383,326
67.78% of 50 DAV
50 DAV is 7,941,800
|
$63.38
-7.79%
|
6/22/2010
|
$59.60
|
PP = $59.67
|
|
MB = $62.65
|
Most Recent Note - 8/19/2010 4:26:23 PM
Y - Loss today on lighter volume, closing near its 50 DMA line. Color code was changed to yellow based on its resilience. Distributional action in recent weeks has been followed by no gains with average or higher volume.
>>> The latest Featured Stock Update with an annotated graph appeared on 8/6/2010. Click here.
View all notes |
Alert me of new notes |
CANSLIM.net Company Profile |
SEC |
Zacks Reports |
StockTalk |
News |
Chart |
Request a new note
C
A N
S L
I M
|
NEOG
-
NASDAQ
Neogen Corp
DRUGS - Diagnostic Substances
|
$27.75
|
-0.40
-1.42% |
$28.03
|
82,436
96.30% of 50 DAV
50 DAV is 85,600
|
$30.39
-8.69%
|
7/22/2010
|
$27.19
|
PP = $27.87
|
|
MB = $29.26
|
Most Recent Note - 8/19/2010 4:27:44 PM
G - Consolidating near its 50 DMA line and prior highs in the $27 area defining important technical support. Its recent slump below its pivot point negated its latest breakout raising concerns, and its color code was changed to green
>>> The latest Featured Stock Update with an annotated graph appeared on 7/22/2010. Click here.
View all notes |
Alert me of new notes |
CANSLIM.net Company Profile |
SEC |
Zacks Reports |
StockTalk |
News |
Chart |
Request a new note
C
A N
S L
I M
|
NFLX
-
NASDAQ
Netflix Inc
SPECIALTY RETAIL - Music and Video Stores
|
$128.24
|
+2.54
2.02% |
$129.70
|
6,652,821
154.48% of 50 DAV
50 DAV is 4,306,600
|
$140.90
-8.99%
|
8/10/2010
|
$124.05
|
PP = $124.00
|
|
MB = $130.20
|
Most Recent Note - 8/19/2010 4:33:39 PM
Y- Gapped down today and then found prompt support near its prior high of $124 noted as an important support level to watch after its 8/17/10 negative reversal at an all-time high. Today's positive reversal was somewhat encouraging, and its color code is changed to yellow.
>>> The latest Featured Stock Update with an annotated graph appeared on 8/10/2010. Click here.
View all notes |
Alert me of new notes |
CANSLIM.net Company Profile |
SEC |
Zacks Reports |
StockTalk |
News |
Chart |
Request a new note
C
A N
S L
I M
|
Symbol/Exchange
Company Name
Industry Group |
PRICE |
CHANGE
(%Change) |
Day High |
Volume
(% DAV)
(% 50 day avg vol) |
52 Wk Hi
% From Hi |
Featured
Date |
Price
Featured |
Pivot Featured |
|
Max Buy |
ROVI
-
NASDAQ
Rovi Corp
COMPUTER SOFTWARE andamp; SERVICES - Security Software andamp; Services
|
$42.49
|
+0.08
0.19% |
$42.78
|
644,592
56.20% of 50 DAV
50 DAV is 1,147,000
|
$44.96
-5.49%
|
6/3/2010
|
$38.70
|
PP = $40.16
|
|
MB = $42.17
|
Most Recent Note - 8/17/2010 4:14:59 PM
G - Wedged back above its "max buy" level with gains on light volume this week. Color code is changed to green again. Time is needed for it to form a sound new base. Prior highs in the $40 area and its 50 DMA line define chart support.
>>> The latest Featured Stock Update with an annotated graph appeared on 7/21/2010. Click here.
View all notes |
Alert me of new notes |
CANSLIM.net Company Profile |
SEC |
Zacks Reports |
StockTalk |
News |
Chart |
Request a new note
C
A N
S L
I M
|
SHOO
-
NASDAQ
Steven Madden Limited
CONSUMER NON-DURABLES - Textile - Apparel Footwear
|
$35.94
|
-0.93
-2.52% |
$36.90
|
238,777
54.72% of 50 DAV
50 DAV is 436,400
|
$40.98
-12.30%
|
8/5/2010
|
$39.55
|
PP = $41.08
|
|
MB = $43.13
|
Most Recent Note - 8/19/2010 4:35:47 PM
G - Recently found support near its 50 DMA line, however it retraced more than half of the depth of the previously noted cup shaped pattern.
>>> The latest Featured Stock Update with an annotated graph appeared on 8/5/2010. Click here.
View all notes |
Alert me of new notes |
CANSLIM.net Company Profile |
SEC |
Zacks Reports |
StockTalk |
News |
Chart |
Request a new note
C
A N
S L
I M
|
VIT
-
NYSE
Vanceinfo Tech Inc Ads
COMPUTER SOFTWARE and SERVICES - Business Software and Services
|
$26.65
|
+1.66
6.64% |
$26.95
|
677,820
128.06% of 50 DAV
50 DAV is 529,300
|
$27.96
-4.69%
|
7/8/2010
|
$25.20
|
PP = $26.58
|
|
MB = $27.91
|
Most Recent Note - 8/19/2010 4:37:36 PM
Y - Considerable gain today with slightly above average volume, rallying up from its 50 DMA line. Color code was changed to yellow based on its resilience. Minimal resistance remains due to overhead supply now.
>>> The latest Featured Stock Update with an annotated graph appeared on 7/26/2010. Click here.
View all notes |
Alert me of new notes |
CANSLIM.net Company Profile |
SEC |
Zacks Reports |
StockTalk |
News |
Chart |
Request a new note
C
A N
S L
I M
|