You are not logged in.
This means you
CAN ONLY VIEW reports that were published prior to Monday, April 14, 2025.
You
MUST UPGRADE YOUR MEMBERSHIP if you want to see any current reports.
AFTER MARKET UPDATE - TUESDAY, AUGUST 18TH, 2009
Previous After Market Report Next After Market Report >>>
|
|
|
|
DOW |
+82.60 |
9,217.94 |
+0.90% |
|
Volume |
991,080,650 |
-19% |
|
Volume |
1,777,905,110 |
-11% |
|
NASDAQ |
+25.08 |
1,955.92 |
+1.30% |
|
Advancers |
2,410 |
77% |
|
Advancers |
1,988 |
70% |
|
S&P 500 |
+9.94 |
989.67 |
+1.01% |
|
Decliners |
611 |
20% |
|
Decliners |
727 |
26% |
|
Russell 2000 |
+8.25 |
556.43 |
+1.50% |
|
52 Wk Highs |
37 |
|
|
52 Wk Highs |
16 |
|
|
S&P 600 |
+3.75 |
294.97 |
+1.29% |
|
52 Wk Lows |
4 |
|
|
52 Wk Lows |
6 |
|
|
 |
Bounce On Light Volume Reveals Lack Of Buying From Institutional Players
Adam Sarhan, Contributing Writer,
Stock markets around the ended slightly higher, which was minor compared to the Friday and Monday sell-off which took the wind out of the bulls' sails. The fact that volume fell on both the NYSE and the Nasdaq suggests that the large institutional investors were not aggressively accumulating shares on Tuesday. In Monday's CANSLIM.net Market Commentary, we noted the strong two-day sell off put pressure on the current rally, but the newspaper took it one step further and actually said the market fell into a "correction". There is no need to split hairs over the semantics - the same point applies: proceed with patience and caution until a new batch of high-ranked leaders emerge and the major averages begin moving higher again.
Advancers led decliners by more nearly a 4-to-1 ratio on the NYSE and by nearly a 3-to-1 ratio on the Nasdaq exchange. There were only 5 high-ranked companies from the CANSLIM.net Leaders List that made a new 52-week high and appeared on the CANSLIM.net BreakOuts Page, higher than the 2 issues that appeared on the prior session. New 52-week highs outnumbered new 52-week lows on both exchanges, and new lows were in the single digits.
The latest rally began with a confirmation day on the March 12, 2009, a follow-through day when the major averages rallied on impressive volume. That rally was dominated by low-ranked and low priced stocks that enjoyed monstrous moves from egregiously oversold levels. The classic example which perfectly illustrates this point is Citigroup (C +3.5%). Citigroup soared from $0.97 to over $4 in the next few months. This type of action helped the major averages enjoy their massive moves, but made it difficult for classic growth investors to make progress in the market since high-ranked stocks were not participating in the early phases of the rally. The dearth of high-ranked leadership was our primary concern during the entire five and half month rally. On Monday, August 17, 2009 that rally which sent the major averages on an explosive run ended, as the action in the major averages and leading stocks indicated a correction.
What does this mean? Typically, when a market is in a correction the major averages decline, which means that 3 out of 4 growth stocks decline as well. That said, one would be wise to raise cash or at the very least tighten your stops to protect your capital. In addition, the guidelines say that any new buys should be avoided until a new rally is again confirmed. In order for a new rally to be confirmed, the major averages must produce a sound follow-through day and a new batch of high-ranked leaders should trigger fresh technical buy signals. Stay tuned to CANSLIM.net's daily market commentary to find out exactly when that occurs so you will be ready to take the necessary action. Until then, patience and caution would serve you well.
PICTURED: The Dow Jones Industrial Average slid into a correction on Monday August 17, 2009 which effectively ended its five and a half month rally that began on March 12, 2009.
|
|
|
 |
Broad Group Gains, But Healthcare Group Backpedaled
Kenneth J. Gruneisen - Passed the CAN SLIM® Master's Exam
The Broker/Dealer Index ($XBD +2.17%) and Bank Index ($BKX +2.19%) were among Tuesday's positive influences. The tech sector was led higher by the Networking Index ($NWX +3.05%) and Semiconductor Index ($SOX +2.01%), with smaller gains from the Internet Index ($IIX +1.17%) and Biotechnology Index ($BTK +0.80%). Commodity linked areas were also on the rise, with the Oil Services Index ($OSX +2.40%), Integrated Oil Index ($XOI +1.26%), and Gold & Silver Index ($XAU +1.50%) posting gains. The Retail Index ($RLX +1.77%) also traded up, meanwhile the Healthcare Index ($HMO -0.78%) backpedaled.
Charts courtesy www.stockcharts.com
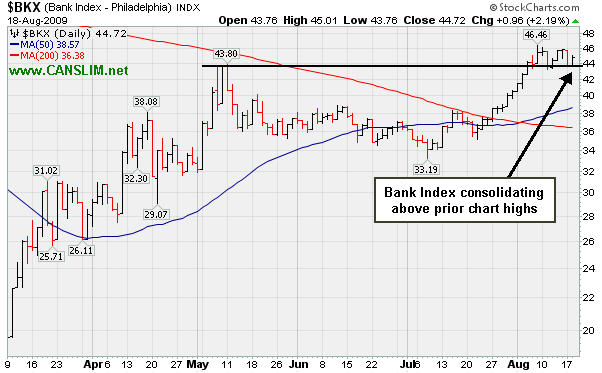
PICTURED: The Bank Index ($BKX +2.19%) is consolidating near prior chart highs.
| Oil Services |
$OSX |
168.58 |
+3.95 |
+2.40% |
+38.87% |
| Healthcare |
$HMO |
1,203.28 |
-9.48 |
-0.78% |
+25.32% |
| Integrated Oil |
$XOI |
934.48 |
+11.67 |
+1.26% |
-4.61% |
| Semiconductor |
$SOX |
291.67 |
+5.75 |
+2.01% |
+37.47% |
| Networking |
$NWX |
206.85 |
+6.13 |
+3.05% |
+43.76% |
| Internet |
$IIX |
198.98 |
+2.30 |
+1.17% |
+48.75% |
| Broker/Dealer |
$XBD |
108.21 |
+2.30 |
+2.17% |
+39.68% |
| Retail |
$RLX |
354.64 |
+6.18 |
+1.77% |
+26.99% |
| Gold & Silver |
$XAU |
141.22 |
+2.09 |
+1.50% |
+14.03% |
| Bank |
$BKX |
44.72 |
+0.96 |
+2.19% |
+0.90% |
| Biotech |
$BTK |
841.49 |
+6.69 |
+0.80% |
+30.03% |
|
|
|
 |
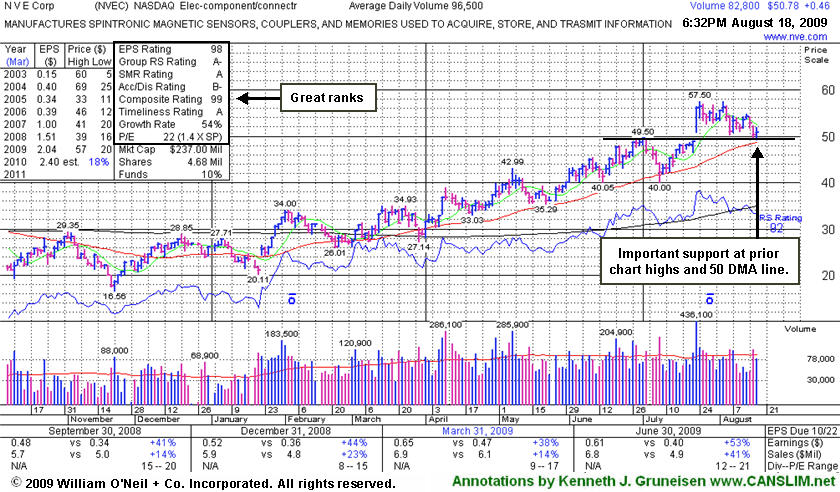
Consolidation Near Important Support Levels
Kenneth J. Gruneisen - Passed the CAN SLIM® Master's Exam
NVE Corp (NVEC +$0.46 or +0.91% to $50.78) has been consolidating in an orderly fashion toward prior highs and the stock's 50-day moving average (DMA) line (now $48.66) - important support levels. Throughout its ongoing advance, NVEC has found support near its 50 DMA line. Caution is warranted now, as eventually a more substantial correction is bound to come, and broader market conditions (the M criteria) appear to be weakening. NVEC has traded up as much as +69.87% since it was first featured in yellow at $33.85 in the Friday, March 13, 2009 Mid-Day Breakouts Report (read here). It was featured in the 7/23/09 Mid-Day BreakOuts Report (read here) after it gapped up for a considerable gain on heavy volume following news of stronger sales revenues (+41%) and solid earnings increases for the quarter ended June 30, 2009. The technical action was described as a "breakaway gap" from a valid ascending base.
It has a very small supply of only 4.68 million shares outstanding. This is another good reason to be especially disciplined about proper entries and exits. A small supply is generally considered a good sign with respect to the S criteria, yet could contribute to great volatility in the event of institutional accumulation or distribution. This high-ranked Electronics - Components leader has a good quarterly and annual earnings growth history (C & A criteria).
|
|
|
Color Codes Explained :
Y - Better candidates highlighted by our
staff of experts.
G - Previously featured
in past reports as yellow but may no longer be buyable under the
guidelines.
***Last / Change / Volume quote data in this table corresponds with the timestamp on the note***
Symbol/Exchange
Company Name
Industry Group |
Last |
Chg. |
Vol
% DAV |
Date Featured |
Price Featured |
Latest Pivot Point
Featured |
Status |
| Latest Max Buy Price |
CPLA
- NASDAQ
Capella Education Co
DIVERSIFIED SERVICES - Education and Training Services
|
$62.97
|
-0.73
|
84,147
40% DAV
208,800
|
7/9/2009
(Date
Featured) |
$59.69
(Price
Featured) |
PP = $62.06 |
Y |
| MB = $65.16 |
Most Recent Note - 8/18/2009 5:13:59 PM
Y - Edging lower on light volume, now -3% off its 52-week high, and yet still above its pivot point but below the "max buy" level. Featured in yellow in the 7/09/09 Mid-Day BreakOuts Report (read here). The Commercial Services-Schools Group has shown some leadership but has low ranks, and CPLA's Relative Strength rank has slumped to 68, under the 80+ guideline. Its small supply of only 13.9 million shares in the float could contribute to greater price volatility in the event of institutional accumulation or distribution. The number of top-rated funds owning an interest rose from 91 in Sept '08, to 133 as of March '09, which is reassuring with respect to the I criteria. It has a very good earnings history that satisfies the C & A criteria, while recent quarters showed steady sales revenues increases in the +17-18% range.
>>> The latest Featured Stock Update with an annotated graph appeared on 8/6/2009. click here.
|
|
C
A
S
I |
News |
Chart |
SEC
View all notes Alert
me of new notes
Company
Profile
|
CRM
- NYSE
Salesforce.com Inc
INTERNET - Internet Software & Services
|
$44.30
|
-0.64
|
2,516,668
151% DAV
1,665,400
|
8/16/2009
(Date
Featured) |
$47.12
(Price
Featured) |
PP = $45.59 |
G |
| MB = $47.87 |
Most Recent Note - 8/18/2009 5:16:45 PM
G - Down today on above average volume, sinking further below its pivot point. Color code is changed to green, and it would need to rally back above its pivot point for the outlook to improve. A Stock Bulletin was just published on 8/16/09 (read here).
>>> The latest Featured Stock Update with an annotated graph appeared on 8/16/2009. click here.
|
|
C
A
S
I |
News |
Chart |
SEC
View all notes Alert
me of new notes
Company
Profile
|
GMCR
- NASDAQ
Green Mtn Coffee Roastrs
FOOD & BEVERAGE - Processed & Packaged Goods
|
$58.83
|
+0.38
|
1,560,361
98% DAV
1,595,800
|
7/17/2009
(Date
Featured) |
$60.15
(Price
Featured) |
PP = $63.79 |
G |
| MB = $66.98 |
Most Recent Note - 8/18/2009 5:20:39 PM
G - Halted its slide today. A gap down and considerable loss on 8/17/09 on heavy volume triggered technical sell signals, capping a 6 session losing streak as it violated its 50 DMA line, prior highs in the $62-63 area, and an upward trendline. GMCR traded up more than +168% since appearing with an annotated graph under the headline "It May Soon Be Time To Go Green" when featured in the January 2009 CANSLIM.net News (read here).
>>> The latest Featured Stock Update with an annotated graph appeared on 8/14/2009. click here.
|
|
C
A
S
I |
News |
Chart |
SEC
View all notes Alert
me of new notes
Company
Profile
|
LFT
-
|
$27.98
|
+0.73
|
1,467,754
187% DAV
783,200
|
8/10/2009
(Date
Featured) |
$31.49
(Price
Featured) |
PP = $30.57 |
G |
| MB = $32.10 |
Most Recent Note - 8/18/2009 5:23:44 PM
G - Positively reversed today and found support, still managing to close above its 50 DMA line. Earnings news for the quarter ended June 30, 2009 was released after the close. Color code was changed to green as it has technically negated its recent breakout.
>>> The latest Featured Stock Update with an annotated graph appeared on 8/12/2009. click here.
|
|
C
A
S
I |
News |
Chart |
SEC
View all notes Alert
me of new notes
Company
Profile
|
NTES
- NASDAQ
Netease Inc Adr
INTERNET - Internet Information Providers
|
$41.38
|
+1.17
|
1,973,433
81% DAV
2,428,300
|
7/17/2009
(Date
Featured) |
$39.29
(Price
Featured) |
PP = $38.74 |
G |
| MB = $40.68 |
Most Recent Note - 8/18/2009 5:28:25 PM
G - Small gain on light volume today followed 3 consecutive losses with much heavier volume that pressured it near its 50 DMA line, yet it has thus far found support near its short-term average and prior chart highs in the $38 area. A 8/13/09 gap down for a considerable loss on nearly 4 times average volume triggered a technical sell signal. Results for the quarter ended June 30, 2009 showed a big earnings per share increase, but sales revenues were reported at -1% versus the year ago period, continuing its pattern of worrisome sequential deceleration in sales revenues increases from +79%, +59%, +42% in the Jun, Sep, Dec '08 comparisons and +24% in Mar '09. First featured at $26.75 in the 3/31/09 CANSLIM.net Mid-Day Breakouts Report (read here).
>>> The latest Featured Stock Update with an annotated graph appeared on 8/13/2009. click here.
|
|
C
A
S
I |
News |
Chart |
SEC
View all notes Alert
me of new notes
Company
Profile
|
NVEC
- NASDAQ
N V E Corp
ELECTRONICS - Semiconductor - Specialized
|
$50.78
|
+0.46
|
82,830
86% DAV
96,500
|
3/13/2009
(Date
Featured) |
$33.85
(Price
Featured) |
PP = $49.60 |
G |
| MB = $52.08 |
Most Recent Note - 8/18/2009 5:29:25 PM
G - Consolidating near important initial support at its 50 DMA line (now $48.50) and prior chart highs. Featured in the 7/23/09 Mid-Day BreakOuts Report (read here) after it gapped up for a considerable gain on heavy volume following news of stronger sales revenues (+41%) and solid earnings increases for the quarter ended June 30, 2009. The technical action was described as a "breakaway gap" from a valid ascending base. Quarterly sales revenues in the 6 million dollar range are still rather minuscule, leaving concerns.
>>> The latest Featured Stock Update with an annotated graph appeared on 8/18/2009. click here.
|
|
C
A
S
I |
News |
Chart |
SEC
View all notes Alert
me of new notes
Company
Profile
|
PEGA
- NASDAQ
Pegasystems Inc
COMPUTER SOFTWARE & SERVICES - Business Software & Services
|
$27.87
|
+0.22
|
345,072
114% DAV
301,400
|
7/29/2009
(Date
Featured) |
$27.53
(Price
Featured) |
PP = $27.49 |
G |
| MB = $28.86 |
Most Recent Note - 8/18/2009 5:32:48 PM
G - Positively reversed today after falling to its 50 DMA line. Color code was changed to green after a 8/17/09 gap down loss while volume spiked higher. Previous resistance in the mid-$27 area has been noted as an important technical support level to watch above its 50 DMA line. Considerable 8/05/09 gain with nearly 5 times average volume followed strong Q2 earnings and raised guidance. The high-ranked software firm triggered a technical buy signal when rising from the "double bottom" base when it was featured in the 7/29/09 mid-day report (read here).
>>> The latest Featured Stock Update with an annotated graph appeared on 8/11/2009. click here.
|
|
C
A
S
I |
News |
Chart |
SEC
View all notes Alert
me of new notes
Company
Profile
|
UTA
-
|
$11.93
|
-0.08
|
971,470
175% DAV
554,900
|
7/28/2009
(Date
Featured) |
$12.87
(Price
Featured) |
PP = $12.70 |
G |
| MB = $13.34 |
Most Recent Note - 8/18/2009 5:42:53 PM
G - Dipped under its 50 DMA line intra-day but rebounded to close with a small loss on heavy volume. A negative reversal on 8/13/09 for a loss on very heavy volume was noted as a clear sign of worrisome distributional pressure. Wider intra-day swings of late were noted as a sign of uncertainty raising concerns. Strong action prompted it to be featured in yellow with pivot point and max buy levels noted in the 7/28/09 mid-day breakouts report (read here), with additional analysis included in the after market update (read here). This Chinese provider of airline tickets and travel related services gapped up on 7/28/09, rising from a choppy 6-week base with a considerable gain on very heavy volume.
>>> The latest Featured Stock Update with an annotated graph appeared on 8/7/2009. click here.
|
|
C
A
S
I |
News |
Chart |
SEC
View all notes Alert
me of new notes
Company
Profile
|
|
|
|
THESE ARE NOT BUY RECOMMENDATIONS!
Comments contained in the body of this report are technical
opinions only. The material herein has been obtained
from sources believed to be reliable and accurate, however,
its accuracy and completeness cannot be guaranteed.
This site is not an investment advisor, hence it does
not endorse or recommend any securities or other investments.
Any recommendation contained in this report may not
be suitable for all investors and it is not to be deemed
an offer or solicitation on our part with respect to
the purchase or sale of any securities. All trademarks,
service marks and trade names appearing in this report
are the property of their respective owners, and are
likewise used for identification purposes only.
This report is a service available
only to active Paid Premium Members.
You may opt-out of receiving report notifications
at any time. Questions or comments may be submitted
by writing to Premium Membership Services 665 S.E. 10 Street, Suite 201 Deerfield Beach, FL 33441-5634 or by calling 1-800-965-8307
or 954-785-1121.
|
|
|


