You are not logged in.
This means you
CAN ONLY VIEW reports that were published prior to Monday, April 14, 2025.
You
MUST UPGRADE YOUR MEMBERSHIP if you want to see any current reports.
AFTER MARKET UPDATE - MONDAY, AUGUST 17TH, 2009
Previous After Market Report Next After Market Report >>>
|
|
|
|
DOW |
-186.06 |
9,135.34 |
-2.00% |
|
Volume |
1,220,191,240 |
+12% |
|
Volume |
2,007,853,230 |
+1% |
|
NASDAQ |
-54.68 |
1,930.84 |
-2.75% |
|
Advancers |
334 |
11% |
|
Advancers |
496 |
18% |
|
S&P 500 |
-24.36 |
979.73 |
-2.43% |
|
Decliners |
2,732 |
88% |
|
Decliners |
2,242 |
80% |
|
Russell 2000 |
-15.72 |
548.18 |
-2.79% |
|
52 Wk Highs |
18 |
|
|
52 Wk Highs |
8 |
|
|
S&P 600 |
-7.96 |
291.22 |
-2.66% |
|
52 Wk Lows |
6 |
|
|
52 Wk Lows |
11 |
|
|
 |
Decliners Severely Outnumber Advancers As Indices Encounter Distribution
Adam Sarhan, Contributing Writer,
Stocks tanked around the world, led by Asia, after disconcerting economic data from the Far East suggested the economic recovery may be in jeopardy. The volume total reported on the NYSE was higher and lower on the Nasdaq exchange which marked a distribution day for NYSE indexes and avoided one for the Nasdaq. Decliners trumped advancers by more than a 8-to-1 ratio on the NYSE and by more than a 4-to-1 ratio on the Nasdaq exchange. There were only 2 high-ranked companies from the CANSLIM.net Leaders List that made a new 52-week high and appeared on the CANSLIM.net BreakOuts Page, down from than the 6 issues that appeared on the prior session, and one of the lowest readings since this 24-week rally was confirmed with the March 12, 2009 follow-through day. New 52-week highs still outnumbered 52-week lows on the NYSE, but trailed on the Nasdaq exchange.
Overnight, markets plunged around the world after Japan said that its gross domestic product (GDP) expanded at an annual rate of +3.7% for the second quarter. This was lower than the Street's median estimate for a +3.9% increase. Elsewhere, China's stock market plunged nearly -6% after the country said that foreign direct investment (FDI) was lower than expected. FDI is an important measure of global investors' appetite for risk and plays a major role in developing nation's economies. The fact that FDI decreased in China, one of the strongest developing economies in the world, reflects poorly for global investors' appetite for risk.
The selling spilled over to the rest of the world as investors across the globe dumped stocks and commodities and moved into so-called "safer" assets such as the US Dollar and bonds. It is important to note that the entire 24-week rally was predicated on the notion that the economic recovery would be powerful. However, much of that recovery was due to strong participation from the US government. Therefore, when the Fed said last week that it was going to slow down its participation in the market, that took much of the wind out of the bull's collective sails. That coupled with the fact that for the first time in weeks leading stocks are getting in trouble paints a negative picture for the health of this aging rally.
Up until this point, leading stocks have been acting well. However, late last week, then again today, one by one many leaders triggered technical sell signals. It should come as no surprise that leadership continues to be our primary concern which is something that we have repeated endlessly since the current rally began in mid-March. Over the past five and half months, once in a while a leader would get pounded, but new leaders would quickly show up. The fact that a handful of high-ranked leaders got smacked suggests that the current market rally is under pressure and could be in severe jeopardy. Furthermore, the fact that most of the "leading stocks" are from China is not a particularly healthy sign for growth in the "New America" . When your stocks get in trouble (hopefully you own leading stocks during any market rally) one would be wise to listen to what the price/volume action is telling you about each issue on a case-by-case basis and move to cash and wait for the correction to run its course.
PICTURED: The S&P 500 Index gapped down and fell on higher volume than the prior session, a sign of distribution, and closed below near-term support (black line above) as it closed near the session low.
|
|
|
 |
Healthcare Group Posts Standout Gains Amid Widespread Weakness
Kenneth J. Gruneisen - Passed the CAN SLIM® Master's Exam
Commodity-linked areas were among the worst hit as the Gold & Silver Index ($XAU -4.63%), Oil Services Index ($OSX -3.84%), and Integrated Oil Index ($XOI -3.11%) sank. The influential Bank Index ($BKX -4.50%), Broker/Dealer Index ($XBD -3.50%), and Retail Index ($RLX -3.66%) also suffered large losses that weighed on the major averages. Tech shares were also scorched as the Networking Index ($NWX -3.79%), Semiconductor Index ($SOX -2.96%), Internet Index ($IIX -2.82%), and Biotechnology Index ($BTK -2.77%) collectively lost a lot of ground, contributing to the tech-heavy Nasdaq Composite Index's relative under-performance versus its peers.
Charts courtesy www.stockcharts.com
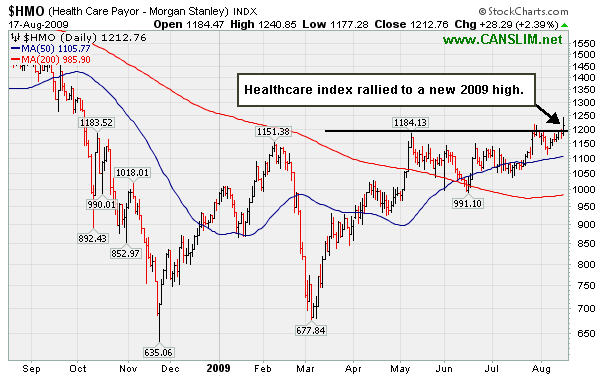
PICTURED: The Healthcare Index ($HMO +2.39%) was a standout gainer on Monday's otherwise negative session. Dwindling prospects for a government-run health insurance plan lifted the shares of managed care companies and relieved investors who fear the companies could not compete with such a plan.
| Oil Services |
$OSX |
164.63 |
-6.58 |
-3.84% |
+35.62% |
| Healthcare |
$HMO |
1,212.76 |
+28.29 |
+2.39% |
+26.31% |
| Integrated Oil |
$XOI |
922.81 |
-29.65 |
-3.11% |
-5.80% |
| Semiconductor |
$SOX |
285.92 |
-8.73 |
-2.96% |
+34.76% |
| Networking |
$NWX |
200.72 |
-7.90 |
-3.79% |
+39.50% |
| Internet |
$IIX |
196.68 |
-5.70 |
-2.82% |
+47.03% |
| Broker/Dealer |
$XBD |
105.91 |
-3.84 |
-3.50% |
+36.71% |
| Retail |
$RLX |
348.46 |
-13.23 |
-3.66% |
+24.78% |
| Gold & Silver |
$XAU |
139.13 |
-6.76 |
-4.63% |
+12.34% |
| Bank |
$BKX |
43.76 |
-2.06 |
-4.50% |
-1.26% |
| Biotech |
$BTK |
834.80 |
-23.76 |
-2.77% |
+28.99% |
|
|
|
 |
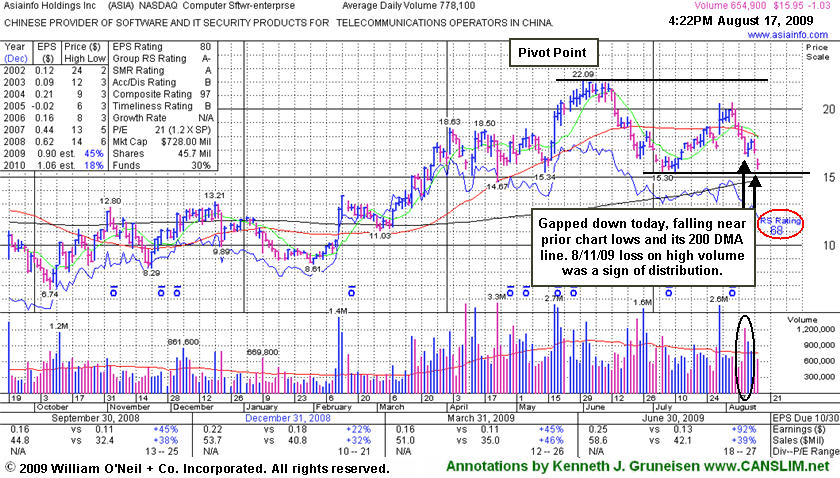
Weak Action Never Offered Proper Buy Signal
Kenneth J. Gruneisen - Passed the CAN SLIM® Master's Exam
AsiaInfo Holdings, Inc. (ASIA -$1.03 or to $15.95) gapped down today for a loss on below average volume. Since the stock slumped below its 50-day moving average (DMA) line in early August it was hit with a distribution day on 8/11/09 as it suffered a considerable decline on high volume. Now it is consolidating near its prior chart lows and its 200 DMA line which may act as support. However, based on its weak action and its Relative Strength rank has slumped to 68, well below the usual minimum 80+ guideline for buyable candidates. Technically, it would have to rally above its 50 DMA and rally above recent chart highs in the $20 area for its outlook to improve. ASIA was recently featured in the August 2009 CANSLIM.net News (read here). Based on its inability to make progress above its pivot point since, disciplined investors avoided taking action that would have exposed them to any losses. Disciplined entries and exits are critical to investors' success with the investment system.
|
|
|
Color Codes Explained :
Y - Better candidates highlighted by our
staff of experts.
G - Previously featured
in past reports as yellow but may no longer be buyable under the
guidelines.
***Last / Change / Volume quote data in this table corresponds with the timestamp on the note***
Symbol/Exchange
Company Name
Industry Group |
Last |
Chg. |
Vol
% DAV |
Date Featured |
Price Featured |
Latest Pivot Point
Featured |
Status |
| Latest Max Buy Price |
CPLA
- NASDAQ
Capella Education Co
DIVERSIFIED SERVICES - Education and Training Services
|
$63.70
|
-0.78
|
102,412
49% DAV
208,600
|
7/9/2009
(Date
Featured) |
$59.69
(Price
Featured) |
PP = $62.06 |
Y |
| MB = $65.16 |
Most Recent Note - 8/17/2009 5:06:11 PM
Y - Still quietly hovering just -2% off its 52-week high, and above its pivot point but below the "max buy" level. Featured in yellow in the 7/09/09 Mid-Day BreakOuts Report (read here). The Commercial Services-Schools Group has shown some leadership but has low ranks, and CPLA's Relative Strength rank has slumped to 66, under the 80+ guideline. Its small supply of only 13.9 million shares in the float could contribute to greater price volatility in the event of institutional accumulation or distribution. The number of top-rated funds owning an interest rose from 91 in Sept '08, to 133 as of March '09, which is reassuring with respect to the I criteria. It has a very good earnings history that satisfies the C & A criteria, while recent quarters showed steady sales revenues increases in the +17-18% range.
>>> The latest Featured Stock Update with an annotated graph appeared on 8/6/2009. click here.
|
|
C
A
S
I |
News |
Chart |
SEC
View all notes Alert
me of new notes
Company
Profile
|
CRM
- NYSE
Salesforce.com Inc
INTERNET - Internet Software & Services
|
$44.94
|
-2.18
|
1,643,169
97% DAV
1,691,400
|
8/16/2009
(Date
Featured) |
$47.12
(Price
Featured) |
PP = $45.59 |
Y |
| MB = $47.87 |
Most Recent Note - 8/17/2009 5:09:31 PM
Y - Gapped down today and sank under its pivot point with a loss on average volume amid widespread market weakness. A Stock Bulletin was just published on 8/16/09 (read here).
>>> The latest Featured Stock Update with an annotated graph appeared on 8/16/2009. click here.
|
|
C
A
S
I |
News |
Chart |
SEC
View all notes Alert
me of new notes
Company
Profile
|
GMCR
- NASDAQ
Green Mtn Coffee Roastrs
FOOD & BEVERAGE - Processed & Packaged Goods
|
$58.45
|
-4.92
|
2,903,867
185% DAV
1,571,800
|
7/17/2009
(Date
Featured) |
$60.15
(Price
Featured) |
PP = $63.79 |
G |
| MB = $66.98 |
Most Recent Note - 8/17/2009 5:10:37 PM
G - Gapped down today, falling on heavy volume for its 6th consecutive loss, and it technically violated its 50 DMA line, also violating prior highs in the $62-63 area and an upward trendline, triggering technical sell signals. GMCR traded up more than +168% since appearing with an annotated graph under the headline "It May Soon Be Time To Go Green" when featured in the January 2009 CANSLIM.net News (read here).
>>> The latest Featured Stock Update with an annotated graph appeared on 8/14/2009. click here.
|
|
C
A
S
I |
News |
Chart |
SEC
View all notes Alert
me of new notes
Company
Profile
|
LFT
-
|
$27.25
|
-2.46
|
2,149,760
271% DAV
793,400
|
8/10/2009
(Date
Featured) |
$31.49
(Price
Featured) |
PP = $30.57 |
G |
| MB = $32.10 |
Most Recent Note - 8/17/2009 5:12:49 PM
G - Down considerably today on heavy volume after gapping lower and violating its 50 DMA line, then rebounding to close above it. Earnings news for the quarter ended June 30, 2009 its due on Tuesday 8/18/09. Color code was changed to green as it has technically negated its recent breakout.
>>> The latest Featured Stock Update with an annotated graph appeared on 8/12/2009. click here.
|
|
C
A
S
I |
News |
Chart |
SEC
View all notes Alert
me of new notes
Company
Profile
|
NTES
- NASDAQ
Netease Inc Adr
INTERNET - Internet Information Providers
|
$40.21
|
-1.29
|
2,700,984
112% DAV
2,419,800
|
7/17/2009
(Date
Featured) |
$39.29
(Price
Featured) |
PP = $38.74 |
G |
| MB = $40.68 |
Most Recent Note - 8/17/2009 5:13:44 PM
G - Raised additional concerns as it gapped down today amid widespread market weakness and traded under its 50 DMA line, then rebounded above it, closing near the session highs. A 8/13/09 gap down for a considerable loss on nearly 4 times average volume triggered a technical sell signal. Results for the quarter ended June 30, 2009 showed a big earnings per share increase, but sales revenues were reported at -1% versus the year ago period, continuing its pattern of worrisome sequential deceleration in sales revenues increases from +79%, +59%, +42% in the Jun, Sep, Dec '08 comparisons and +24% in Mar '09. The nearest chart support is at its pivot point, 50 DMA line, and prior chart highs, all of which are in the $39 area. First featured at $26.75 in the 3/31/09 CANSLIM.net Mid-Day Breakouts Report (read here).
>>> The latest Featured Stock Update with an annotated graph appeared on 8/13/2009. click here.
|
|
C
A
S
I |
News |
Chart |
SEC
View all notes Alert
me of new notes
Company
Profile
|
NVEC
- NASDAQ
N V E Corp
ELECTRONICS - Semiconductor - Specialized
|
$50.32
|
-2.40
|
121,816
127% DAV
95,900
|
3/13/2009
(Date
Featured) |
$33.85
(Price
Featured) |
PP = $49.60 |
G |
| MB = $52.08 |
Most Recent Note - 8/17/2009 5:14:34 PM
G - Gapped down today, falling near important initial support at its 50 DMA line (now $48.36) and prior chart highs. Featured in the 7/23/09 Mid-Day BreakOuts Report (read here) after it gapped up for a considerable gain on heavy volume following news of stronger sales revenues (+41%) and solid earnings increases for the quarter ended June 30, 2009. The technical action was described as a "breakaway gap" from a valid ascending base. Quarterly sales revenues in the 6 million dollar range are still rather minuscule, leaving concerns.
>>> The latest Featured Stock Update with an annotated graph appeared on 8/3/2009. click here.
|
|
C
A
S
I |
News |
Chart |
SEC
View all notes Alert
me of new notes
Company
Profile
|
PEGA
- NASDAQ
Pegasystems Inc
COMPUTER SOFTWARE & SERVICES - Business Software & Services
|
$27.65
|
-1.79
|
486,457
164% DAV
296,300
|
7/29/2009
(Date
Featured) |
$27.53
(Price
Featured) |
PP = $27.49 |
G |
| MB = $28.86 |
Most Recent Note - 8/17/2009 5:18:13 PM
G - Gapped down today amid widespread market weakness, pulling back toward prior chart highs. Color code is changed to green after the close near the session low while volume spiked higher. Previous resistance in the mid-$27 area has been noted as an important technical support level to watch above its 50 DMA line. Considerable 8/05/09 gain with nearly 5 times average volume followed strong Q2 earnings and raised guidance. The high-ranked software firm triggered a technical buy signal when rising from the "double bottom" base when it was featured in the 7/29/09 mid-day report (read here).
>>> The latest Featured Stock Update with an annotated graph appeared on 8/11/2009. click here.
|
|
C
A
S
I |
News |
Chart |
SEC
View all notes Alert
me of new notes
Company
Profile
|
UTA
-
|
$12.01
|
-1.47
|
668,827
122% DAV
549,300
|
7/28/2009
(Date
Featured) |
$12.87
(Price
Featured) |
PP = $12.70 |
G |
| MB = $13.34 |
Most Recent Note - 8/17/2009 5:19:20 PM
G - Gapped down today and closed near the session low, falling toward prior chart highs and its 50 DMA line -always an important support level to watch. A negative reversal on 8/13/09 for a loss on very heavy volume was noted as a clear sign of worrisome distributional pressure. Wider intra-day swings of late were noted as a sign of uncertainty raising concerns. Strong action prompted it to be featured in yellow with pivot point and max buy levels noted in the 7/28/09 mid-day breakouts report (read here), with additional analysis included in the after market update (read here). This Chinese provider of airline tickets and travel related services gapped up on 7/28/09, rising from a choppy 6-week base with a considerable gain on very heavy volume.
>>> The latest Featured Stock Update with an annotated graph appeared on 8/7/2009. click here.
|
|
C
A
S
I |
News |
Chart |
SEC
View all notes Alert
me of new notes
Company
Profile
|
|
|
|
THESE ARE NOT BUY RECOMMENDATIONS!
Comments contained in the body of this report are technical
opinions only. The material herein has been obtained
from sources believed to be reliable and accurate, however,
its accuracy and completeness cannot be guaranteed.
This site is not an investment advisor, hence it does
not endorse or recommend any securities or other investments.
Any recommendation contained in this report may not
be suitable for all investors and it is not to be deemed
an offer or solicitation on our part with respect to
the purchase or sale of any securities. All trademarks,
service marks and trade names appearing in this report
are the property of their respective owners, and are
likewise used for identification purposes only.
This report is a service available
only to active Paid Premium Members.
You may opt-out of receiving report notifications
at any time. Questions or comments may be submitted
by writing to Premium Membership Services 665 S.E. 10 Street, Suite 201 Deerfield Beach, FL 33441-5634 or by calling 1-800-965-8307
or 954-785-1121.
|
|
|


