You are not logged in.
This means you
CAN ONLY VIEW reports that were published prior to Saturday, March 29, 2025.
You
MUST UPGRADE YOUR MEMBERSHIP if you want to see any current reports.
AFTER MARKET UPDATE - FRIDAY, AUGUST 16TH, 2013
Previous After Market Report Next After Market Report >>>
|
|
|
|
DOW |
-30.72 |
15,081.47 |
-0.20% |
|
Volume |
835,276,650 |
+16% |
|
Volume |
1,458,696,580 |
-13% |
|
NASDAQ |
-3.34 |
3,602.78 |
-0.09% |
|
Advancers |
1,065 |
34% |
|
Advancers |
1,148 |
44% |
|
S&P 500 |
-5.49 |
1,655.83 |
-0.33% |
|
Decliners |
1,988 |
64% |
|
Decliners |
1,353 |
52% |
|
Russell 2000 |
-3.31 |
1,024.30 |
-0.32% |
|
52 Wk Highs |
29 |
|
|
52 Wk Highs |
49 |
|
|
S&P 600 |
-1.98 |
580.24 |
-0.34% |
|
52 Wk Lows |
336 |
|
|
52 Wk Lows |
33 |
|
|
 |
Major Averages Flashed Warning Signs This Week
Kenneth J. Gruneisen - Passed the CAN SLIM® Master's Exam
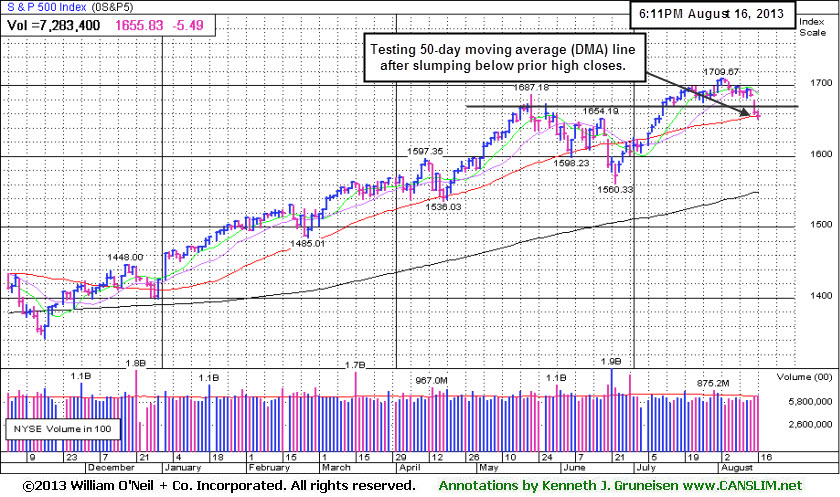
The Dow Jones Industrial Average posted a weekly decline of -2.2%, the S&P 500 Index fell -2.1% and the Nasdaq Composite Index was down -1.6%. Technical damage this week sounded alarm bells. Friday's volume totals were reported mixed, higher than the prior session total on the NYSE and lower on the Nasdaq exchange. Breadth was negative as decliners led advancers about a 2-1 margin on the NYSE while decliners led advancers by only a 7-6 margin on the Nasdaq exchange. Leadership evaporated late in the week and on Friday there were only 2 high-ranked companies from the CANSLIM.net Leaders List that made new 52-week highs and appeared on the CANSLIM.net BreakOuts Page, down abruptly from a total of 62 stocks on Tuesday. The list of stocks hitting new 52-week highs still outnumbered new 52-week lows on the Nasdaq exchange. On the NYSE the new lows total outnumbered new highs for a 4th consecutive session. There were gains for 10 of the 17 high-ranked companies currently included on the Featured Stocks Page. The market (M criteria) clearly signaled that the major averages are in a "correction" based on Thursday's technical damage. Individual holdings should be closely monitored for any worrisome technical sell signals. This is precisely how the fact-based system helps investors avoid serious setbacks and raise cash levels during market downdrafts. Historic studies suggest that no new buying efforts should be made during market corrections.
The major averages traded in a tight range and extended their losing streak to three days. The latest batch of economic data indicated that housing starts rose by +5.9% in July to 896,000, but trailed estimates for an increase to 900,000. Building permits also failed to best street forecasts for an increase to 945,000 as applications increased by +2.7% last month to 943,000. A separate report showed the University of Michigan's consumer confidence survey fell from a six-year high of 85.1 as the gauge unexpectedly dropped to 80 in August.
Eight of the 10 S&P 500 sectors were down. Telecommunications and Utilities gave up the most ground as Verizon Communications (VZ -1.71%) and PG&E Corp (PCG -1.61%) both fell. On the earnings front, Dell Inc (DELL -0.84%) edged lower after posting better-than-expected earnings, but its profits dropped by -72% from a year ago. Nordstrom Inc (JWN -4.89%) also topped earnings estimates, but lowered its full-year forecast. Technology helped limit losses thanks to Applied Materials Corp (AMAT +1.92%) gaining ground after the company's announcement of its new CEO encouraged investors. Industrials also managed to gain ground as Boeing Co (BA +0.72%) edged higher. Overall, a week of risk asset profit taking left the major averages with their first back-to-back weekly losses since June.
In fixed-income, Treasury yields climbed further above their 2011 highs. The 10-year note was down 16/32 to yield 2.82% and the 30-year bond lost 18/32 to yield 3.84%.
Stay familiar with companies listed on the CANSLIM.net Featured Stocks Page - a page showing the most action-worthy candidates' latest notes and links to additional resources including detailed analysis with data-packed graphs which are annotated by a Certified expert. The Premium Member Homepage - includes "dynamic archives" to all prior pay reports published. Watch for an announcement via email concerning the next WEBCAST.
PICTURED: The benchmark S&P 500 Index is testing its 50-day moving average (DMA) after damaging losses led to a slump below its prior high closes.
|
 Kenneth J. Gruneisen started out as a licensed stockbroker in August 1987, a couple of months prior to the historic stock market crash that took the Dow Jones Industrial Average down -22.6% in a single day. He has published daily fact-based fundamental and technical analysis on high-ranked stocks online for two decades. Through FACTBASEDINVESTING.COM, Kenneth provides educational articles, news, market commentary, and other information regarding proven investment systems that work in good times and bad.
Comments contained in the body of this report are technical opinions only and are not necessarily those of Gruneisen Growth Corp. The material herein has been obtained from sources believed to be reliable and accurate, however, its accuracy and completeness cannot be guaranteed. Our firm, employees, and customers may effect transactions, including transactions contrary to any recommendation herein, or have positions in the securities mentioned herein or options with respect thereto. Any recommendation contained in this report may not be suitable for all investors and it is not to be deemed an offer or solicitation on our part with respect to the purchase or sale of any securities. |
|
 |
Financial Shares Propped Up Major Indices
Kenneth J. Gruneisen - Passed the CAN SLIM® Master's Exam
Small gains from the influential financial indexes propped up the major averages on Friday as the Bank Index ($BKX +0.25%) and Broker/Dealer Index ($XBD +0.31%) edged higher. The Healthcare Index ($HMO +0.35%) also posted a small gain. The Gold & Silver Index ($XAU -1.59%) backpedaled and the Retail Index ($RLX -0.51%) finished with a small loss. Energy-linked groups were quiet as the Oil Services Index ($OSX -0.47%) edged lower and the Integrated Oil Index ($XOI -0.03%) finished flat. The tech sector saw modest losses from the Biotechnology Index ($BTK -0.38%), Internet Index ($IIX -0.34%), and the Networking Index ($NWX -0.31%) while the Semiconductor Index ($SOX +0.35%) posted a small gain.
Charts courtesy www.stockcharts.com
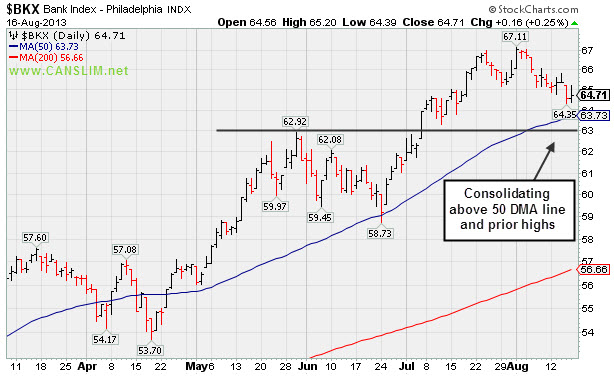
PICTURED: The Bank Index ($BKX +0.25%) is consolidating above its 50-day moving average (DMA) line prior highs. Healthy action in financial stocks is an encouraging sign because of their importance as a "leading indicator".
| Oil Services |
$OSX |
259.84 |
-1.24 |
-0.47% |
+18.02% |
| Healthcare |
$HMO |
3,343.99 |
+11.66 |
+0.35% |
+33.01% |
| Integrated Oil |
$XOI |
1,366.83 |
-0.38 |
-0.03% |
+10.07% |
| Semiconductor |
$SOX |
462.46 |
+1.62 |
+0.35% |
+20.41% |
| Networking |
$NWX |
289.37 |
-0.91 |
-0.31% |
+27.73% |
| Internet |
$IIX |
399.08 |
-1.38 |
-0.34% |
+22.04% |
| Broker/Dealer |
$XBD |
132.89 |
+0.41 |
+0.31% |
+40.88% |
| Retail |
$RLX |
812.36 |
-4.14 |
-0.51% |
+24.39% |
| Gold & Silver |
$XAU |
109.27 |
-1.77 |
-1.59% |
-34.02% |
| Bank |
$BKX |
64.71 |
+0.16 |
+0.25% |
+26.19% |
| Biotech |
$BTK |
2,005.12 |
-7.61 |
-0.38% |
+29.61% |
|
|
|
 |
Consolidating in Orderly Fashion but Market Shift Raises Caution Flag
Kenneth J. Gruneisen - Passed the CAN SLIM® Master's Exam
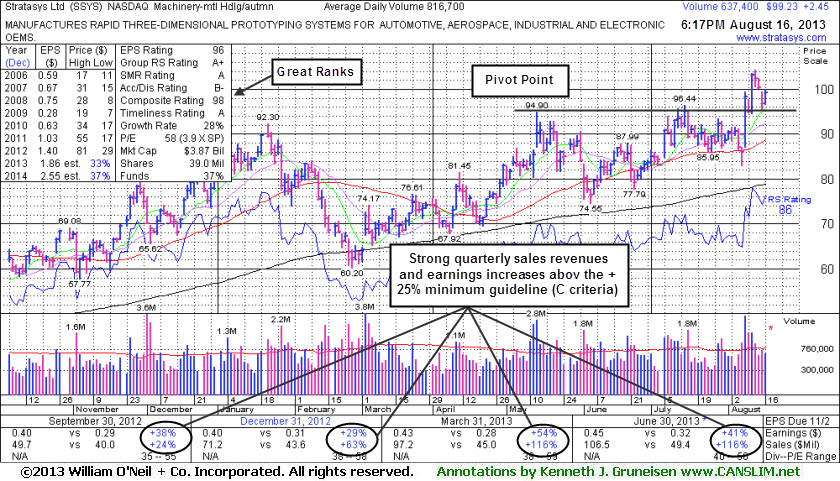
Stratasys Inc (SSYS +$2.45 or +2.53% to $99.23) is consolidating above prior highs in the $96 area defining initial support following the latest breakout. It has pulled back just below the "max buy" level and its color code was changed to yellow. Keep in mind that a volume-driven breakout is a critical sign of the heavy institutional buying demand which can lead to a sustained and meaningful advance in price, but it is not a guarantee the stock will produce great price gains. The market (M criteria) signaled that it is in another correction, so the message now is that it is an important time to adopt a defensive stance. It is not a time to be thinking seriously about accumulating stocks. If the market confirms a new rally then SSYS, along with many other strong leaders, might be worthy of more serious consideration.
Its Relative Strength Rating has improved to 86, above the 80+ minimum guideline for buy candidates under the fact-based investment system. It was last shown in this FSU section on 7/24/13 with an annotated graph under the headline, "Faltering Near 50-day Moving Average While Relative Strength Wanes".
The company released financial results for the quarter ended June 30, 2013 showing earnings +41% on +116% sales revenues versus the year ago period. Its strong quarterly earnings history above the +25% minimum guideline satisfies the C criteria. A downturn in its FY '09 earnings was previously noted as a flaw with respect to the investment system's A criteria. It found support near its 200 DMA line during a deep consolidation earlier this year. Ownership by top-rated funds rose from 246 in Sep '12 to 304 in Jun '13, a reassuring sign concerning the I criteria. It is an interesting turn around story with a small supply of 37.1 million shares (S criteria) outstanding. Longtime members may recall that SSYS was long ago (2003) featured in reports.
|
|
|
Color Codes Explained :
Y - Better candidates highlighted by our
staff of experts.
G - Previously featured
in past reports as yellow but may no longer be buyable under the
guidelines.
***Last / Change / Volume data in this table is the closing quote data***
Symbol/Exchange
Company Name
Industry Group |
PRICE |
CHANGE
(%Change) |
Day High |
Volume
(% DAV)
(% 50 day avg vol) |
52 Wk Hi
% From Hi |
Featured
Date |
Price
Featured |
Pivot Featured |
|
Max Buy |
AMBA
-
NASDAQ
Ambarella Inc
ELECTRONICS - Semiconductor - Specialized
|
$16.01
|
-0.01
-0.06% |
$16.35
|
752,172
71.34% of 50 DAV
50 DAV is 1,054,400
|
$19.44
-17.64%
|
7/15/2013
|
$17.87
|
PP = $18.68
|
|
MB = $19.61
|
Most Recent Note - 8/15/2013 7:14:10 PM
G - Slumping further below its 50 DMA line which acted as resistance recently. Subsequent damaging losses below recent lows near $15.50 would raise more serious concerns and trigger more worrisome technical sell signals.
>>> The latest Featured Stock Update with an annotated graph appeared on 8/13/2013. Click here.
View all notes |
Alert me of new notes |
CANSLIM.net Company Profile |
SEC |
Zacks Reports |
StockTalk |
News |
Chart |
Request a new note
C
A N
S L
I M


|
BITA
-
NYSE
Bitauto Hldgs Ltd Ads
INTERNET - Internet Information Providers
|
$12.86
|
-1.68
-11.55% |
$14.45
|
460,650
254.36% of 50 DAV
50 DAV is 181,100
|
$18.10
-28.95%
|
8/7/2013
|
$12.01
|
PP = $13.30
|
|
MB = $13.97
|
 Most Recent Note - 8/16/2013 6:55:39 PM
G - Negated its impressive breakout gains and retraced back to prior high with 5 consecutive losses marked by above average volume. Disciplined investors always limit losses if any stock falls more than -7-8% from their purchase price.
>>> The latest Featured Stock Update with an annotated graph appeared on 8/7/2013. Click here.
View all notes |
Alert me of new notes |
CANSLIM.net Company Profile |
SEC |
Zacks Reports |
StockTalk |
News |
Chart |
Request a new note
C
A N
S L
I M
|
CELG
-
NASDAQ
Celgene Corp
DRUGS - Drug Manufacturers - Major
|
$132.49
|
-1.02
-0.76% |
$134.45
|
2,494,386
94.94% of 50 DAV
50 DAV is 2,627,200
|
$149.92
-11.62%
|
7/11/2013
|
$133.25
|
PP = $131.92
|
|
MB = $138.52
|
Most Recent Note - 8/13/2013 6:43:38 PM
Y - Color code is changed to yellow after retreating below its "max buy" level with a loss today on average volume. Prior highs in the $131 area define initial chart support above its 50 DMA line.
>>> The latest Featured Stock Update with an annotated graph appeared on 7/29/2013. Click here.
View all notes |
Alert me of new notes |
CANSLIM.net Company Profile |
SEC |
Zacks Reports |
StockTalk |
News |
Chart |
Request a new note
C
A N
S L
I M
|
FLT
-
NYSE
Fleetcor Technologies
DIVERSIFIED SERVICES - Business/Management Services
|
$97.67
|
+0.15
0.15% |
$99.59
|
474,769
69.46% of 50 DAV
50 DAV is 683,500
|
$100.87
-3.17%
|
5/29/2013
|
$86.02
|
PP = $85.66
|
|
MB = $89.94
|
Most Recent Note - 8/12/2013 6:07:52 PM
G- Holding its ground stubbornly, extended from any sound base and perched at all-time highs. Volume totals have been cooling after spiking higher with gains backed by above average volume. See latest FSU analysis for more details and a new annotated graph.
>>> The latest Featured Stock Update with an annotated graph appeared on 8/12/2013. Click here.
View all notes |
Alert me of new notes |
CANSLIM.net Company Profile |
SEC |
Zacks Reports |
StockTalk |
News |
Chart |
Request a new note
C
A N
S L
I M
|
GNRC
-
NYSE
Generac Hldgs Inc
CONSUMER DURABLES - Electronic Equipment
|
$42.78
|
+0.48
1.13% |
$42.97
|
617,538
55.49% of 50 DAV
50 DAV is 1,112,800
|
$44.30
-3.43%
|
7/30/2013
|
$42.60
|
PP = $42.10
|
|
MB = $44.21
|
Most Recent Note - 8/15/2013 7:17:46 PM
Y - Holding its ground stubbornly after it recently rallied from an advanced "3-weeks tight" base and priced a Secondary Offering. Disciplined investors always limit losses by selling if any stock falls more than -7% from its purchase price.
>>> The latest Featured Stock Update with an annotated graph appeared on 7/30/2013. Click here.
View all notes |
Alert me of new notes |
CANSLIM.net Company Profile |
SEC |
Zacks Reports |
StockTalk |
News |
Chart |
Request a new note
C
A N
S L
I M
|
Symbol/Exchange
Company Name
Industry Group |
PRICE |
CHANGE
(%Change) |
Day High |
Volume
(% DAV)
(% 50 day avg vol) |
52 Wk Hi
% From Hi |
Featured
Date |
Price
Featured |
Pivot Featured |
|
Max Buy |
KORS
-
NYSE
Michael Kors Hldgs Ltd
RETAIL - Apparel Stores
|
$70.20
|
-1.03
-1.45% |
$70.73
|
3,189,826
89.95% of 50 DAV
50 DAV is 3,546,200
|
$72.98
-3.81%
|
8/6/2013
|
$69.66
|
PP = $66.28
|
|
MB = $69.59
|
Most Recent Note - 8/15/2013 7:19:05 PM
G - Holding its ground beyond its "max buy" level. Prior highs in the $66 area define initial support to watch on pullbacks.
>>> The latest Featured Stock Update with an annotated graph appeared on 8/6/2013. Click here.
View all notes |
Alert me of new notes |
CANSLIM.net Company Profile |
SEC |
Zacks Reports |
StockTalk |
News |
Chart |
Request a new note
C
A N
S L
I M
|
LOPE
-
NASDAQ
Grand Canyon Education
DIVERSIFIED SERVICES - Education and; Training Services
|
$33.87
|
+0.08
0.24% |
$34.18
|
252,678
56.74% of 50 DAV
50 DAV is 445,300
|
$37.17
-8.88%
|
6/19/2013
|
$31.47
|
PP = $34.17
|
|
MB = $35.88
|
Most Recent Note - 8/14/2013 7:11:26 PM
Y - Consolidating above important near-term support. Reported earnings +15% on +19% sales for the Jun '13 quarter, below the +25% minimum earnings guideline (C criteria), raising fundamental concerns. See the latest FSU analysis for more details and a new annotated graph.
>>> The latest Featured Stock Update with an annotated graph appeared on 8/14/2013. Click here.
View all notes |
Alert me of new notes |
CANSLIM.net Company Profile |
SEC |
Zacks Reports |
StockTalk |
News |
Chart |
Request a new note
C
A N
S L
I M
|
PCLN
-
NASDAQ
Priceline.Com Inc
INTERNET - Internet Software and Services
|
$940.07
|
+1.28
0.14% |
$949.00
|
820,375
114.95% of 50 DAV
50 DAV is 713,700
|
$994.98
-5.52%
|
7/8/2013
|
$878.28
|
PP = $847.43
|
|
MB = $889.80
|
Most Recent Note - 8/16/2013 6:57:21 PM
G - Consolidating above prior highs, extended from any sound base. Reported earnings +24% on +27% sales revenues for the Jun '13 quarter, just under the +25% minimum earnings guideline (C criteria).
>>> The latest Featured Stock Update with an annotated graph appeared on 7/25/2013. Click here.
View all notes |
Alert me of new notes |
CANSLIM.net Company Profile |
SEC |
Zacks Reports |
StockTalk |
News |
Chart |
Request a new note
C
A N
S L
I M
|
PRAA
-
NASDAQ
Portfolio Recovery Assoc
DIVERSIFIED SERVICES - Business/Management Services
|
$55.58
|
+0.76
1.39% |
$55.86
|
481,886
95.22% of 50 DAV
50 DAV is 506,100
|
$57.57
-3.46%
|
7/31/2013
|
$51.43
|
PP = $54.72
|
|
MB = $57.46
|
Most Recent Note - 8/14/2013 1:09:23 PM
Y - Perched at its 52-week high today holding its ground following an impressive spurt of volume-driven gains. It rallied above the pivot point with +130% above average volume on the prior session clinching a new technical buy signal.
>>> The latest Featured Stock Update with an annotated graph appeared on 8/2/2013. Click here.
View all notes |
Alert me of new notes |
CANSLIM.net Company Profile |
SEC |
Zacks Reports |
StockTalk |
News |
Chart |
Request a new note
C
A N
S L
I M
|
PRLB
-
NYSE
Proto Labs Inc
MANUFACTURING - Small Tools and Accessories
|
$65.62
|
-0.06
-0.09% |
$67.00
|
252,707
50.68% of 50 DAV
50 DAV is 498,600
|
$72.08
-8.96%
|
7/29/2013
|
$64.86
|
PP = $67.50
|
|
MB = $70.88
|
Most Recent Note - 8/12/2013 6:12:02 PM
Y - Tallied a 3rd consecutive gain with below or near average volume since again testing support near its 50 DMA line and prior lows when encountering distributional pressure. Disciplined investors always limit losses if any stock falls more than -7% from their purchase price.
>>> The latest Featured Stock Update with an annotated graph appeared on 8/5/2013. Click here.
View all notes |
Alert me of new notes |
CANSLIM.net Company Profile |
SEC |
Zacks Reports |
StockTalk |
News |
Chart |
Request a new note
C
A N
S L
I M
|
Symbol/Exchange
Company Name
Industry Group |
PRICE |
CHANGE
(%Change) |
Day High |
Volume
(% DAV)
(% 50 day avg vol) |
52 Wk Hi
% From Hi |
Featured
Date |
Price
Featured |
Pivot Featured |
|
Max Buy |
QCOR
-
NASDAQ
Questcor Pharmaceuticals
DRUGS - Biotechnology
|
$65.32
|
-1.26
-1.89% |
$67.22
|
1,188,664
56.35% of 50 DAV
50 DAV is 2,109,500
|
$70.55
-7.41%
|
7/31/2013
|
$66.46
|
PP = $59.01
|
|
MB = $61.96
|
Most Recent Note - 8/13/2013 7:04:51 PM
G - Rallied to its second-best close today following a brief consolidation. Quickly got extended beyond its "max buy" level after highlighted in yellow in the 7/31/13 mid-day report (read here) with a weekly graph which illustrated its powerful long-term breakout to new highs.
>>> The latest Featured Stock Update with an annotated graph appeared on 8/1/2013. Click here.
View all notes |
Alert me of new notes |
CANSLIM.net Company Profile |
SEC |
Zacks Reports |
StockTalk |
News |
Chart |
Request a new note
C
A N
S L
I M
|
SFUN
-
NYSE
Soufun Hldgs Ltd Ads A
INTERNET - Internet Information Providers
|
$36.17
|
-1.13
-3.03% |
$38.06
|
1,164,190
250.69% of 50 DAV
50 DAV is 464,400
|
$42.15
-14.19%
|
7/16/2013
|
$29.54
|
PP = $27.90
|
|
MB = $29.30
|
Most Recent Note - 8/16/2013 12:47:28 PM
G - Down with above average volume for the 5th session in the span of 6 after getting very extended from its latest base. Prior reports noted - "Disciplined investors avoid chasing stocks too extended from sound bases."
>>> The latest Featured Stock Update with an annotated graph appeared on 8/8/2013. Click here.
View all notes |
Alert me of new notes |
CANSLIM.net Company Profile |
SEC |
Zacks Reports |
StockTalk |
News |
Chart |
Request a new note
C
A N
S L
I M
|
SSNC
-
NASDAQ
S S & C Technologies
COMPUTER SOFTWARE and SERVICES - Application Software
|
$34.97
|
+0.06
0.17% |
$35.17
|
256,824
60.06% of 50 DAV
50 DAV is 427,600
|
$38.80
-9.87%
|
7/11/2013
|
$35.80
|
PP = $34.54
|
|
MB = $36.27
|
Most Recent Note - 8/16/2013 6:58:24 PM
Y - Still trading above its 50 DMA line and prior highs in the $34 area defining important support. Disciplined investors always limit losses if ever any stock falls more than -7% from their purchase price.
>>> The latest Featured Stock Update with an annotated graph appeared on 8/9/2013. Click here.
View all notes |
Alert me of new notes |
CANSLIM.net Company Profile |
SEC |
Zacks Reports |
StockTalk |
News |
Chart |
Request a new note
C
A N
S L
I M
|
SSYS
-
NASDAQ
Stratasys Ltd
COMPUTER HARDWARE - Computer Peripherals
|
$99.23
|
+2.45
2.53% |
$100.00
|
637,459
78.05% of 50 DAV
50 DAV is 816,700
|
$104.34
-4.90%
|
7/8/2013
|
$91.44
|
PP = $95.00
|
|
MB = $99.75
|
Most Recent Note - 8/16/2013 6:52:24 PM
Y - Consolidating above prior highs in a healthy manner. Broader market (M criteria) weakness is an overriding concern. See the latest FSU analysis for more details and a new annotated graph.
>>> The latest Featured Stock Update with an annotated graph appeared on 8/16/2013. Click here.
View all notes |
Alert me of new notes |
CANSLIM.net Company Profile |
SEC |
Zacks Reports |
StockTalk |
News |
Chart |
Request a new note
C
A N
S L
I M
|
STMP
-
NASDAQ
Stamps.Com Inc
INTERNET - Internet Software and Services
|
$39.97
|
+0.70
1.78% |
$40.01
|
138,697
100.21% of 50 DAV
50 DAV is 138,400
|
$46.47
-13.99%
|
7/31/2013
|
$40.00
|
PP = $42.98
|
|
MB = $45.13
|
Most Recent Note - 8/13/2013 6:53:00 PM
Y - Found support at its 50 DMA line again after a recent bout of distributional pressure. Disciplined investors always limit losses if any stock falls more than -7% from their purchase price. Any stock which is sold can be bought again later if strength returns.
>>> The latest Featured Stock Update with an annotated graph appeared on 7/31/2013. Click here.
View all notes |
Alert me of new notes |
CANSLIM.net Company Profile |
SEC |
Zacks Reports |
StockTalk |
News |
Chart |
Request a new note
C
A N
S L
I M
|
Symbol/Exchange
Company Name
Industry Group |
PRICE |
CHANGE
(%Change) |
Day High |
Volume
(% DAV)
(% 50 day avg vol) |
52 Wk Hi
% From Hi |
Featured
Date |
Price
Featured |
Pivot Featured |
|
Max Buy |
VRX
-
NYSE
Valeant Pharmaceuticals
DRUGS - Drug Manufacturers - Other
|
$103.00
|
+0.07
0.07% |
$103.43
|
1,045,688
65.36% of 50 DAV
50 DAV is 1,600,000
|
$105.40
-2.28%
|
4/30/2013
|
$60.24
|
PP = $76.66
|
|
MB = $80.49
|
Most Recent Note - 8/15/2013 7:10:07 PM
G- Holding its ground after rallying into new 52-week high territory with 9 gains in the span of 10 sessions. Reported earnings +33% on +34% sales revenues for the Jun '13 quarter, above the +25% minimum earnings guideline (C criteria). See the latest FSU analysis for more details and a new annotated graph.
>>> The latest Featured Stock Update with an annotated graph appeared on 8/15/2013. Click here.
View all notes |
Alert me of new notes |
CANSLIM.net Company Profile |
SEC |
Zacks Reports |
StockTalk |
News |
Chart |
Request a new note
C
A N
S L
I M
|
YNDX
-
NASDAQ
Yandex N V Class A
INTERNET - Internet Information Providers
|
$33.12
|
+0.12
0.36% |
$33.40
|
1,265,539
50.88% of 50 DAV
50 DAV is 2,487,100
|
$34.79
-4.80%
|
7/10/2013
|
$29.29
|
PP = $29.59
|
|
MB = $31.07
|
Most Recent Note - 8/14/2013 1:26:02 PM
G - Hitting a new 52-week high today following a brief consolidation in a tight range with volume totals cooling in recent weeks, a sign that few investors have been headed for the exit. Its 50 DMA line coincides with prior highs in the $29 area defining important near-term support to watch.
>>> The latest Featured Stock Update with an annotated graph appeared on 7/26/2013. Click here.
View all notes |
Alert me of new notes |
CANSLIM.net Company Profile |
SEC |
Zacks Reports |
StockTalk |
News |
Chart |
Request a new note
C
A N
S L
I M
|
|
|
|
THESE ARE NOT BUY RECOMMENDATIONS!
Comments contained in the body of this report are technical
opinions only. The material herein has been obtained
from sources believed to be reliable and accurate, however,
its accuracy and completeness cannot be guaranteed.
This site is not an investment advisor, hence it does
not endorse or recommend any securities or other investments.
Any recommendation contained in this report may not
be suitable for all investors and it is not to be deemed
an offer or solicitation on our part with respect to
the purchase or sale of any securities. All trademarks,
service marks and trade names appearing in this report
are the property of their respective owners, and are
likewise used for identification purposes only.
This report is a service available
only to active Paid Premium Members.
You may opt-out of receiving report notifications
at any time. Questions or comments may be submitted
by writing to Premium Membership Services 665 S.E. 10 Street, Suite 201 Deerfield Beach, FL 33441-5634 or by calling 1-800-965-8307
or 954-785-1121.
|
|
|

