You are not logged in.
This means you
CAN ONLY VIEW reports that were published prior to Monday, April 14, 2025.
You
MUST UPGRADE YOUR MEMBERSHIP if you want to see any current reports.
AFTER MARKET UPDATE - TUESDAY, AUGUST 16TH, 2011
Previous After Market Report Next After Market Report >>>
|
|
|
|
DOW |
-76.97 |
11,405.93 |
-0.67% |
|
Volume |
1,132,591,230 |
+2% |
|
Volume |
2,040,554,890 |
+7% |
|
NASDAQ |
-31.75 |
2,523.45 |
-1.24% |
|
Advancers |
762 |
24% |
|
Advancers |
574 |
22% |
|
S&P 500 |
-11.73 |
1,192.76 |
-0.97% |
|
Decliners |
2,294 |
73% |
|
Decliners |
2,000 |
76% |
|
Russell 2000 |
-13.87 |
704.76 |
-1.93% |
|
52 Wk Highs |
10 |
|
|
52 Wk Highs |
6 |
|
|
S&P 600 |
-6.87 |
384.71 |
-1.75% |
|
52 Wk Lows |
15 |
|
|
52 Wk Lows |
51 |
|
|
 |
Retailers' Gains Offset by Financial and Broader Market Weakness
Kenneth J. Gruneisen - Passed the CAN SLIM® Master's Exam
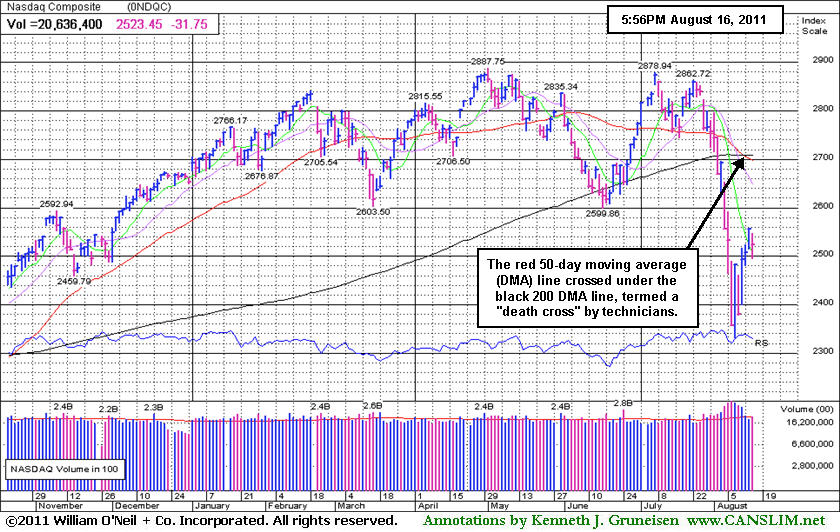
The volume totals on Tuesday were reported slightly higher on the NYSE and on the Nasdaq exchange versus the prior session. Declining issues beat advancers by 3-1 on the NYSE and by nearly 4-1 on the Nasdaq exchange. On the NYSE and on the Nasdaq exchange new 52-week lows outnumbered new 52-week highs. Only 7 high-ranked companies from the CANSLIM.net Leaders List made new 52-week highs and appeared on the CANSLIM.net BreakOuts Page, down from the prior session's total of 10 stocks. There was only 1 gainer out of the 7 high-ranked leaders currently included on the Featured Stocks Page.
Fitch Ratings' affirmation of its AAA credit rating on the U.S. was little help for investors as buying enthusiasm vanished. Tuesday's losses ended a three-day winning streak. Weak economic data out of Europe focused early attention on sovereign debt. The market was pinning its hopes for possible solutions on the outcome of a meeting between French and German government leaders. However, the outcome of the meeting was clearly not what the markets wanted. French President Nicolas Sarkozy said France and Germany are working on "ambitious" joint proposals to support the euro. However, neither France nor Germany supports Eurobonds as a short-term solution. President Sarkozy proposed a tax on financial transactions, which dragged down shares of exchanges.
NYSE Euronext (NYX -8.39%) and other financial stocks trailed the field in New York trading. Citigroup Inc (C -4.25%) and Bank of America Corp (BAC -4.64%) as hedge funds cut their holdings of financial shares. Meanwhile, Dow components The Home Depot Inc (HD +5.28%) and Wal-Mart Stores Inc (WMT +3.88%) enjoyed solid days. Both offered forecasts that were better than expected.
Gold prices rose and oil fell, a sign the risk trade was back in play. U.S. economic reports were mixed. Industrial production climbed 0.9% in July, the biggest increase this year, as car-makers started to shake off the effects of the earthquake disaster in Japan. Housing remains weak. July housing starts in the U.S. declined 1.5% from a downwardly revised total in June.
Disciplined investors are maintaining a watchlist and waiting for a new rally confirmed by a solid follow-through day (FTD) before any new buying efforts are considered. A considerable higher-volume gain between Day 4 and Day 7 from at least one of the major averages is the ideal FTD confirmation that institutional buying demand has returned in a meaningful way. Meanwhile, the market environment (M criteria) argues for investors to remain cautious and preserve cash on the safe sidelines, staying away from potential harm!
The August 2011 issue of CANSLIM.net News will be published soon! Links to all prior reports are available on the Premium Member Homepage.
PICTURED: The Nasdaq Composite Index's 50-day moving average (DMA) line recently crossed under its longer-term 200 DMA line, termed a "death cross" by technicians.
|
 Kenneth J. Gruneisen started out as a licensed stockbroker in August 1987, a couple of months prior to the historic stock market crash that took the Dow Jones Industrial Average down -22.6% in a single day. He has published daily fact-based fundamental and technical analysis on high-ranked stocks online for two decades. Through FACTBASEDINVESTING.COM, Kenneth provides educational articles, news, market commentary, and other information regarding proven investment systems that work in good times and bad.
Comments contained in the body of this report are technical opinions only and are not necessarily those of Gruneisen Growth Corp. The material herein has been obtained from sources believed to be reliable and accurate, however, its accuracy and completeness cannot be guaranteed. Our firm, employees, and customers may effect transactions, including transactions contrary to any recommendation herein, or have positions in the securities mentioned herein or options with respect thereto. Any recommendation contained in this report may not be suitable for all investors and it is not to be deemed an offer or solicitation on our part with respect to the purchase or sale of any securities. |
|
 |
Financial, Tech, and Energy-Related Groups Fell
Kenneth J. Gruneisen - Passed the CAN SLIM® Master's Exam
The Retail Index ($RLX +0.05%) held its ground, but financial, tech, and energy-related groups fell on Tuesday. The Bank Index ($BKX -2.16%) and Broker/Dealer Index ($XBD -1.50%) created a drag on the major averages. The Oil Services Index ($OSX -2.57%) and Integrated Oil Index ($XOI -1.78%) lost ground, and defensive groups including the Gold & Silver Index ($XAU -1.01%) and Healthcare Index ($HMO -0.66%) fell. In the unanimously lower tech sector, the Networking Index ($NWX -2.27%), Semiconductor Index ($SOX -2.00%), and Internet Index ($IIX -1.85%) outpaced the Biotechnology Index ($BTK -0.47%) to the downside.
Charts courtesy www.stockcharts.com
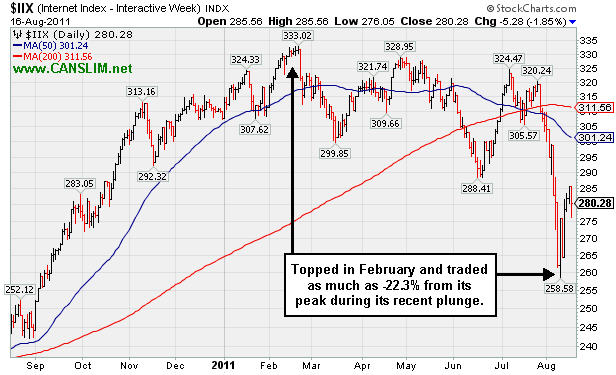
PICTURED: The Internet Index ($IIX -1.85%) topped in February and traded as much as -22.3% from its peak during its recent plunge.
| Oil Services |
$OSX |
236.27 |
-6.23 |
-2.57% |
-3.61% |
| Healthcare |
$HMO |
1,985.31 |
-13.24 |
-0.66% |
+17.34% |
| Integrated Oil |
$XOI |
1,148.78 |
-20.87 |
-1.78% |
-5.31% |
| Semiconductor |
$SOX |
355.41 |
-7.24 |
-2.00% |
-13.70% |
| Networking |
$NWX |
241.62 |
-5.62 |
-2.27% |
-13.88% |
| Internet |
$IIX |
280.28 |
-5.28 |
-1.85% |
-8.92% |
| Broker/Dealer |
$XBD |
90.85 |
-1.38 |
-1.50% |
-25.24% |
| Retail |
$RLX |
495.83 |
+0.25 |
+0.05% |
-2.47% |
| Gold & Silver |
$XAU |
210.28 |
-2.15 |
-1.01% |
-7.19% |
| Bank |
$BKX |
38.45 |
-0.85 |
-2.16% |
-26.36% |
| Biotech |
$BTK |
1,167.94 |
-5.48 |
-0.47% |
-9.99% |
|
|
|
 |
Weekly Chart Shows Resilience at 10-Week Average
Kenneth J. Gruneisen - Passed the CAN SLIM® Master's Exam
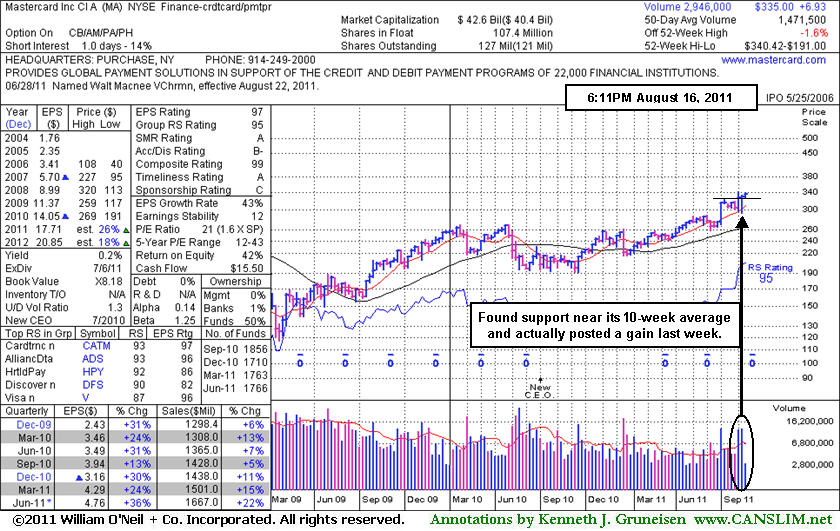
Mastercard Inc Cl A (MA +$0.00 or +0.00% to $335.00) held its ground today with near average volume. Its resilience this week helped it approach its 8/03/11 all-time high, rallying further above the previously cited pivot point. An annotated daily graph was included in its last FSU appearance on 8/03/11 under the headline, "Surge To New Highs Makes Mastercard an Outlier to Watch", after it had gapped up and and hit a new all-time high following a 4-week consolidation that was considered a "square box" base. The weekly chart below shows it finding support near its 10-week moving average line, and it actually finished last week with a gain. However, the weaker action in the broader market (M criteria) still argues against new buying efforts until a confirmed rally with a follow-through day.
It has been showing sales revenues acceleration and strong quarterly earnings increases, with the latest June 2011 quarter showing a +36% earnings increase on +22% sales revenues. It also has maintained a strong annual earnings (A criteria) history. A considerable 6/29/11 gain on heavy volume came after the Federal Reserve set a higher cap on debit-card fees (mentioned in the 6/29/11 Market Commentary - read here). In a handful of mid-day report appearances in June and July of this year it was noted -"It survived but failed to impress since it was dropped from the Featured Stocks list on 7/02/08 after an ominous 'double top' pattern triggered a technical sell signal." A follow-up article dated 12/16/08 had last revisited MA and summarized the action under the headline, "Multiple Sell Signals Prompted Profit Taking; Serious Damage Followed".
|
|
|
Color Codes Explained :
Y - Better candidates highlighted by our
staff of experts.
G - Previously featured
in past reports as yellow but may no longer be buyable under the
guidelines.
***Last / Change / Volume data in this table is the closing quote data***
Symbol/Exchange
Company Name
Industry Group |
PRICE |
CHANGE
(%Change) |
Day High |
Volume
(% DAV)
(% 50 day avg vol) |
52 Wk Hi
% From Hi |
Featured
Date |
Price
Featured |
Pivot Featured |
|
Max Buy |
EXLS
-
NASDAQ
Exlservice Holdings Inc
DIVERSIFIED SERVICES - Business/Management Services
|
$24.35
|
+0.24
1.00% |
$24.68
|
148,607
182.56% of 50 DAV
50 DAV is 81,400
|
$26.46
-7.97%
|
8/2/2011
|
$24.85
|
PP = $24.85
|
|
MB = $26.09
|
Most Recent Note - 8/15/2011 4:08:20 PM
Y - Loss today led to a close below its high closes in May, negating its recent breakout and raising more concerns. Its 50 DMA line (now $23.29) defines important support to watch.
>>> The latest Featured Stock Update with an annotated graph appeared on 8/15/2011. Click here.
View all notes |
Alert me of new notes |
CANSLIM.net Company Profile |
SEC |
Zacks Reports |
StockTalk |
News |
Chart |
Request a new note
C
A N
S L
I M


|
FCFS
-
NASDAQ
First Cash Financial Svs
SPECIALTY RETAIL - Specialty Retail, Other
|
$45.25
|
-0.82
-1.78% |
$45.83
|
574,298
202.15% of 50 DAV
50 DAV is 284,100
|
$47.80
-5.33%
|
5/31/2011
|
$42.00
|
PP = $40.23
|
|
MB = $42.24
|
 Most Recent Note - 8/16/2011 12:24:38 PM
G - Hovering near its 52-week high today after a negative reversal on the prior session broke a streak of 4 consecutive volume-driven gains. Prior chart lows near $37-38 define support to watch above its 200 DMA line.
>>> The latest Featured Stock Update with an annotated graph appeared on 8/9/2011. Click here.
View all notes |
Alert me of new notes |
CANSLIM.net Company Profile |
SEC |
Zacks Reports |
StockTalk |
News |
Chart |
Request a new note
C
A N
S L
I M
|
JCOM
-
NASDAQ
J 2 Global Communication
INTERNET - Internet Software and Services
|
$28.75
|
-0.61
-2.08% |
$29.15
|
282,113
88.46% of 50 DAV
50 DAV is 318,900
|
$31.72
-9.36%
|
8/8/2011
|
$30.38
|
PP = $29.31
|
|
MB = $30.78
|
Most Recent Note - 8/16/2011 1:26:50 PM
G - Quietly slumping near its 50 and 200 DMA lines today, struggling amid a widely negative market (M criteria). Last week it churned a lot of volume without making progress since its 8/03/11 gap up.
>>> The latest Featured Stock Update with an annotated graph appeared on 8/8/2011. Click here.
View all notes |
Alert me of new notes |
CANSLIM.net Company Profile |
SEC |
Zacks Reports |
StockTalk |
News |
Chart |
Request a new note
C
A N
S L
I M
|
MA
-
NYSE
Mastercard Inc Cl A
DIVERSIFIED SERVICES - Business/Management Services
|
$335.00
|
+0.00
0.00% |
$338.00
|
1,472,850
100.09% of 50 DAV
50 DAV is 1,471,500
|
$340.42
-1.59%
|
8/3/2011
|
$324.82
|
PP = $322.38
|
|
MB = $338.50
|
Most Recent Note - 8/15/2011 4:14:29 PM
G - Gain today with near average volume, approaching its 8/03/11 all-time high, rallying further above the previously cited pivot point.
>>> The latest Featured Stock Update with an annotated graph appeared on 8/16/2011. Click here.
View all notes |
Alert me of new notes |
CANSLIM.net Company Profile |
SEC |
Zacks Reports |
StockTalk |
News |
Chart |
Request a new note
C
A N
S L
I M
|
MG
-
NYSE
Mistras Group Inc
DIVERSIFIED SERVICES - Bulding and Faci;ity Management Services
|
$19.35
|
-0.23
-1.17% |
$19.64
|
155,997
119.08% of 50 DAV
50 DAV is 131,000
|
$19.85
-2.52%
|
8/10/2011
|
$17.89
|
PP = $17.58
|
|
MB = $18.46
|
Most Recent Note - 8/15/2011 12:16:00 PM
G - Hit another new 52-week high with today's 5th consecutive gain backed by above average volume. It is extended from its prior base, and previous resistance in the $17-18 area now defines important chart support to watch on pullbacks.
>>> The latest Featured Stock Update with an annotated graph appeared on 8/11/2011. Click here.
View all notes |
Alert me of new notes |
CANSLIM.net Company Profile |
SEC |
Zacks Reports |
StockTalk |
News |
Chart |
Request a new note
C
A N
S L
I M
|
Symbol/Exchange
Company Name
Industry Group |
PRICE |
CHANGE
(%Change) |
Day High |
Volume
(% DAV)
(% 50 day avg vol) |
52 Wk Hi
% From Hi |
Featured
Date |
Price
Featured |
Pivot Featured |
|
Max Buy |
MKTX
-
NASDAQ
Marketaxess Holdings Inc
FINANCIAL SERVICES - Investment Brokerage - Nationa
|
$24.05
|
-0.64
-2.59% |
$24.62
|
105,337
66.00% of 50 DAV
50 DAV is 159,600
|
$27.21
-11.61%
|
7/29/2011
|
$25.87
|
PP = $26.35
|
|
MB = $27.67
|
Most Recent Note - 8/16/2011 1:23:51 PM
G - Today it is slumping back below its 50 DMA line which may now act as resistance. Recent lows and its 200 DMA define the next support levels to watch.
>>> The latest Featured Stock Update with an annotated graph appeared on 8/10/2011. Click here.
View all notes |
Alert me of new notes |
CANSLIM.net Company Profile |
SEC |
Zacks Reports |
StockTalk |
News |
Chart |
Request a new note
C
A N
S L
I M
|
PCLN
-
NASDAQ
Priceline.Com Inc
INTERNET - Internet Software and Services
|
$497.32
|
-17.03
-3.31% |
$508.26
|
1,816,760
155.37% of 50 DAV
50 DAV is 1,169,300
|
$561.88
-11.49%
|
7/29/2011
|
$539.46
|
PP = $552.15
|
|
MB = $579.76
|
Most Recent Note - 8/16/2011 1:21:40 PM
G - Down today with higher volume, slumping back under its 50 DMA line. The 200 DMA line and recent chart lows define the next important support to watch.
>>> The latest Featured Stock Update with an annotated graph appeared on 8/12/2011. Click here.
View all notes |
Alert me of new notes |
CANSLIM.net Company Profile |
SEC |
Zacks Reports |
StockTalk |
News |
Chart |
Request a new note
C
A N
S L
I M
|
|
|
|
THESE ARE NOT BUY RECOMMENDATIONS!
Comments contained in the body of this report are technical
opinions only. The material herein has been obtained
from sources believed to be reliable and accurate, however,
its accuracy and completeness cannot be guaranteed.
This site is not an investment advisor, hence it does
not endorse or recommend any securities or other investments.
Any recommendation contained in this report may not
be suitable for all investors and it is not to be deemed
an offer or solicitation on our part with respect to
the purchase or sale of any securities. All trademarks,
service marks and trade names appearing in this report
are the property of their respective owners, and are
likewise used for identification purposes only.
This report is a service available
only to active Paid Premium Members.
You may opt-out of receiving report notifications
at any time. Questions or comments may be submitted
by writing to Premium Membership Services 665 S.E. 10 Street, Suite 201 Deerfield Beach, FL 33441-5634 or by calling 1-800-965-8307
or 954-785-1121.
|
|
|

