You are not logged in.
This means you
CAN ONLY VIEW reports that were published prior to Monday, April 14, 2025.
You
MUST UPGRADE YOUR MEMBERSHIP if you want to see any current reports.
AFTER MARKET UPDATE - THURSDAY, AUGUST 15TH, 2013
Previous After Market Report Next After Market Report >>>
|
|
|
|
DOW |
-225.47 |
15,112.19 |
-1.47% |
|
Volume |
721,158,260 |
+16% |
|
Volume |
1,678,214,660 |
+9% |
|
NASDAQ |
-63.15 |
3,606.12 |
-1.72% |
|
Advancers |
456 |
14% |
|
Advancers |
479 |
18% |
|
S&P 500 |
-24.07 |
1,661.32 |
-1.43% |
|
Decliners |
2,638 |
83% |
|
Decliners |
2,069 |
79% |
|
Russell 2000 |
-20.19 |
1,027.61 |
-1.93% |
|
52 Wk Highs |
20 |
|
|
52 Wk Highs |
35 |
|
|
S&P 600 |
-10.47 |
582.22 |
-1.77% |
|
52 Wk Lows |
406 |
|
|
52 Wk Lows |
47 |
|
|
 |
Major Averages' Deterioration Sends Investors a Warning Signal
Kenneth J. Gruneisen - Passed the CAN SLIM® Master's Exam
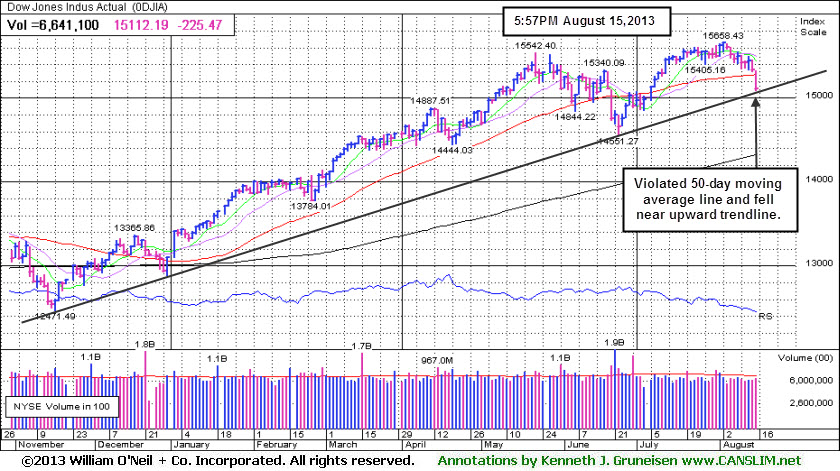
The major averages ended Thursday's session solidly in the red as technical damage sounded some alarm bells. The volume totals were reported higher than the prior session totals on the NYSE and on the Nasdaq exchange, a sign of more worrisome distributional pressure or selling from the institutional crowd. Breadth was solidly negative as decliners led advancers by more than a 5-1 margin on the NYSE and by more than 4-1 on the Nasdaq exchange. There was only 1 high-ranked company from the CANSLIM.net Leaders List that made a new 52-week high and appeared on the CANSLIM.net BreakOuts Page, down abruptly from the prior session total of 54 stocks. The list of stocks hitting new 52-week highs contracted yet still outnumbered new 52-week lows on the Nasdaq exchange. On the NYSE the new lows total swelled and outnumbered new highs for a 3rd consecutive session. There were losses for all 17 high-ranked companies currently included on the Featured Stocks Page. The market (M criteria) rally which was noted as "under pressure" in recent days turned into a full blown "correction" based on the latest technical deterioration. Individual holdings should be closely monitored for any worrisome technical sell signals. This is precisely how the fact-based system helps investors avoid serious setbacks and raise cash levels during market downdrafts. Historic studies suggest that no new buying efforts should be made during market corrections.
Encouraging updates on employment and housing prompted more fears that the Fed may begin culling back its quantitative easing program. Claims for unemployment benefits unexpectedly fell to the lowest level since October 2007 and homebuilder confidence advanced to nearly an eight-year high in August. On the downside, industrial production was unchanged in July while regional manufacturing reports from New York and Philadelphia weakened this month.
Overall, every sector declined. Consumer Staples and Technology gave up the most ground as Wal-Mart Stores Inc (WMT -2.60%) and Cisco Systems Inc (CSCO -7.17%) after both bellwethers delivered disappointing full-year forecasts. Earnings stayed in focus after the close, with profit tallies due out from Dell Inc (DELL -0.11%), Nordstrom Inc (JWN -0.34%) and Applied Materials Corp (AMAT -2.57%).
In the commodity pits, violent unrest in Egypt bolstered concern that Middle East oil supplies may be cut, which helped WTI crude string together its longest stretch of gains since April.
In fixed-income, yields on 10- and 30-year Treasuries jumped to their highest levels since August 2011. The 10-year note was down 16/32 to yield 2.77% and the 30-year bond lost over a full point to yield 3.82%.
Stay familiar with companies listed on the CANSLIM.net Featured Stocks Page - a page showing the most action-worthy candidates' latest notes and links to additional resources including detailed analysis with data-packed graphs which are annotated by a Certified expert. The Premium Member Homepage - includes "dynamic archives" to all prior pay reports published. Watch for an announcement via email concerning the next WEBCAST.
PICTURED: The Dow Jones Industrial Average posted its second straight triple-digit loss as it fell 225 points to 15,112. The Blue Chip Index violated its 50-day moving average (DMA) with the damaging loss while volume increased, a sign of increasing institutional selling pressure.
|
 Kenneth J. Gruneisen started out as a licensed stockbroker in August 1987, a couple of months prior to the historic stock market crash that took the Dow Jones Industrial Average down -22.6% in a single day. He has published daily fact-based fundamental and technical analysis on high-ranked stocks online for two decades. Through FACTBASEDINVESTING.COM, Kenneth provides educational articles, news, market commentary, and other information regarding proven investment systems that work in good times and bad.
Comments contained in the body of this report are technical opinions only and are not necessarily those of Gruneisen Growth Corp. The material herein has been obtained from sources believed to be reliable and accurate, however, its accuracy and completeness cannot be guaranteed. Our firm, employees, and customers may effect transactions, including transactions contrary to any recommendation herein, or have positions in the securities mentioned herein or options with respect thereto. Any recommendation contained in this report may not be suitable for all investors and it is not to be deemed an offer or solicitation on our part with respect to the purchase or sale of any securities. |
|
 |
Tech, Financial, Retail and Healthcare Groups Fell
Kenneth J. Gruneisen - Passed the CAN SLIM® Master's Exam
The Networking Index ($NWX -3.10%) led the tech sector losses while the Biotechnology Index ($BTK -2.50%), Semiconductor Index ($SOX -2.23%), and Internet Index ($IIX -2.02%) each posted losses greater than -2%. The Broker/Dealer Index ($XBD -1.96%) and Bank Index ($BKX -1.24%) fell as financials had a negative influence on the major averages. The Retail Index ($RLX -1.85%) and Healthcare Index ($HMO -1.64%) also fell. Energy-related shares held their ground better than most other areas as the Oil Services Index ($OSX -0.59%) and the Integrated Oil Index ($XOI -0.51%) both edged lower. The Gold & Silver Index ($XAU +5.54%) was a standout gainer once again while the ETF associated with gold bullion (GLD +2.0%) prices posted a gain less than half the size.
Charts courtesy www.stockcharts.com
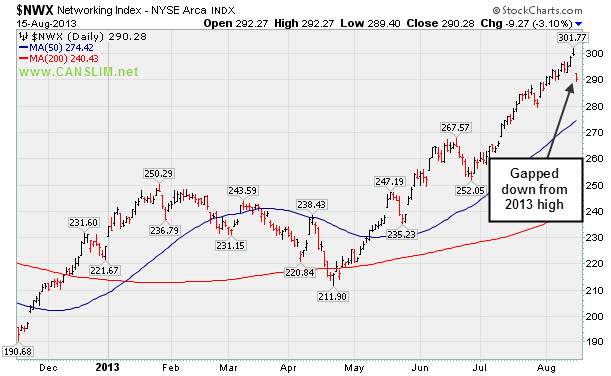
PICTURED: The Networking Index ($NWX -3.10%) gapped down from 2013 highs, obviously impacted by group leader Cisco Systems' big drop.
| Oil Services |
$OSX |
261.08 |
-1.56 |
-0.59% |
+18.59% |
| Healthcare |
$HMO |
3,332.34 |
-55.45 |
-1.64% |
+32.54% |
| Integrated Oil |
$XOI |
1,367.21 |
-6.97 |
-0.51% |
+10.10% |
| Semiconductor |
$SOX |
460.84 |
-10.50 |
-2.23% |
+19.99% |
| Networking |
$NWX |
290.28 |
-9.27 |
-3.10% |
+28.13% |
| Internet |
$IIX |
400.46 |
-8.27 |
-2.02% |
+22.46% |
| Broker/Dealer |
$XBD |
132.48 |
-2.65 |
-1.96% |
+40.44% |
| Retail |
$RLX |
816.50 |
-15.41 |
-1.85% |
+25.03% |
| Gold & Silver |
$XAU |
111.04 |
+5.83 |
+5.54% |
-32.95% |
| Bank |
$BKX |
64.55 |
-0.81 |
-1.24% |
+25.88% |
| Biotech |
$BTK |
2,012.73 |
-51.55 |
-2.50% |
+30.10% |
|
|
|
 |
Latest Results Showed Better Earnings Growth
Kenneth J. Gruneisen - Passed the CAN SLIM® Master's Exam
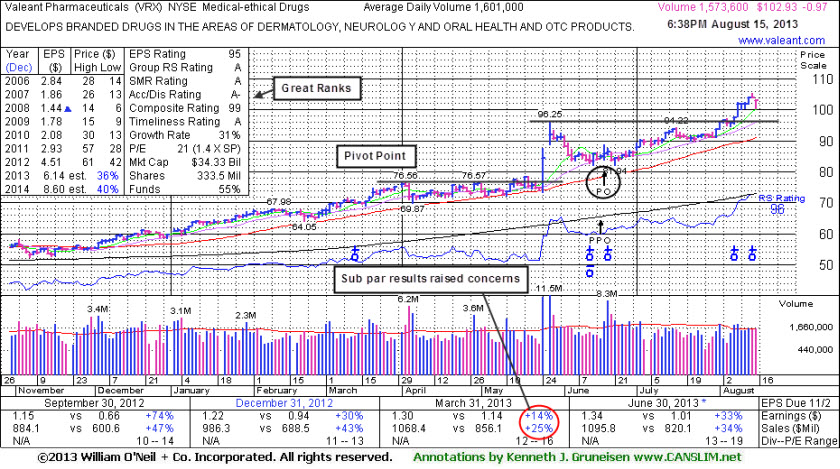
Valeant Pharmaceuticals International, Inc (VRX -$0.97 or -0.93% to $102.93) is consolidating after rallying into new 52-week high territory with 9 gains in the span of 10 sessions. No resistance remains due to overhead supply. It got extended after "wedging" higher with recent gains lacking great volume conviction while rising from a previously noted cup-with-handle base pattern. Prior highs near $96 define initial support to watch. It reported earnings +33% on +34% sales revenues for the Jun '13 quarter, above the +25% minimum earnings guideline (C criteria), a strong follow-up to sub par Mar '13 results.
Due to fundamental concerns no new pivot point was cited during the recent base. It was last shown in this FSU section on 7/23/13 with an annotated graph under the headline, "Formed New Base But Fundamental Concerns Remain". Concerns were raised by its Mar '13 earnings report with only a +14% earnings increase, below the +25% minimum guideline (C criteria) for buy candidates. A downturn in FY '07 and '08 earnings (A criteria) has been followed by a strong earnings rebound in recent years. Return On Equity is currently reported at 37%, well above the 17% minimum guideline of the fact-based system.
The number of top-rated funds owning its shares rose from 818 in Mar '12 in to 1,038 in Jun '13, a reassuring trend concerning the I criteria. Its current Up/Down Volume Ratio of 1.8 is an unbiased indication that its shares have been under accumulation over the past 50 days.
The high-ranked Medical - Ethical Drugs firm's shares spiked higher in late May at around the time of M&A news that it would buy Bausch & Lomb for $8.7 billion. That move and other recent acquisitions resulted in stronger earnings in the latest quarterly comparison.
It completed Public Offering on 6/18/13. The upshot of Public Offerings is that when completed the end result is typically an increase in the total number of institutional owners. Institutional owners are often supportive of their existing positions and will even accumulate more shares when they consolidate near classic support levels like the 50-day and 200-day moving average (DMA) lines, if they are still believers in the company. If too many become pessimistic and decide to unload, this is what ends up sending the stocks slicing through support.
Prior reports noted - "Investors are taught in the Certification to only buy stocks with a combination of both strong fundamentals and strong technical action, however stocks should be sold based on their technical action only. In this example, more bullish action rewarded patient investors still giving it the benefit of the doubt until any technical sell signals start adding up."
|
|
|
Color Codes Explained :
Y - Better candidates highlighted by our
staff of experts.
G - Previously featured
in past reports as yellow but may no longer be buyable under the
guidelines.
***Last / Change / Volume data in this table is the closing quote data***
Symbol/Exchange
Company Name
Industry Group |
PRICE |
CHANGE
(%Change) |
Day High |
Volume
(% DAV)
(% 50 day avg vol) |
52 Wk Hi
% From Hi |
Featured
Date |
Price
Featured |
Pivot Featured |
|
Max Buy |
AMBA
-
NASDAQ
Ambarella Inc
ELECTRONICS - Semiconductor - Specialized
|
$16.02
|
-0.87
-5.15% |
$16.65
|
934,654
83.68% of 50 DAV
50 DAV is 1,117,000
|
$19.44
-17.59%
|
7/15/2013
|
$17.87
|
PP = $18.68
|
|
MB = $19.61
|
 Most Recent Note - 8/15/2013 7:14:10 PM
G - Slumping further below its 50 DMA line which acted as resistance recently. Subsequent damaging losses below recent lows near $15.50 would raise more serious concerns and trigger more worrisome technical sell signals.
>>> The latest Featured Stock Update with an annotated graph appeared on 8/13/2013. Click here.
View all notes |
Alert me of new notes |
CANSLIM.net Company Profile |
SEC |
Zacks Reports |
StockTalk |
News |
Chart |
Request a new note
C
A N
S L
I M


|
BITA
-
NYSE
Bitauto Hldgs Ltd Ads
INTERNET - Internet Information Providers
|
$14.54
|
-1.16
-7.39% |
$15.30
|
413,130
237.16% of 50 DAV
50 DAV is 174,200
|
$18.10
-19.67%
|
8/7/2013
|
$12.01
|
PP = $13.30
|
|
MB = $13.97
|
Most Recent Note - 8/15/2013 7:15:21 PM
G - Gapped down today for a 4th consecutive loss, retreating toward prior highs in the $13 area which define initial support to watch. The 8/07/13 After Market Update included more details and a new annotated graph under the headline "Found Prompt Support After Undercutting 50-Day Average".
>>> The latest Featured Stock Update with an annotated graph appeared on 8/7/2013. Click here.
View all notes |
Alert me of new notes |
CANSLIM.net Company Profile |
SEC |
Zacks Reports |
StockTalk |
News |
Chart |
Request a new note
C
A N
S L
I M
|
CELG
-
NASDAQ
Celgene Corp
DRUGS - Drug Manufacturers - Major
|
$133.51
|
-3.87
-2.82% |
$136.04
|
2,411,787
89.81% of 50 DAV
50 DAV is 2,685,300
|
$149.92
-10.94%
|
7/11/2013
|
$133.25
|
PP = $131.92
|
|
MB = $138.52
|
Most Recent Note - 8/13/2013 6:43:38 PM
Y - Color code is changed to yellow after retreating below its "max buy" level with a loss today on average volume. Prior highs in the $131 area define initial chart support above its 50 DMA line.
>>> The latest Featured Stock Update with an annotated graph appeared on 7/29/2013. Click here.
View all notes |
Alert me of new notes |
CANSLIM.net Company Profile |
SEC |
Zacks Reports |
StockTalk |
News |
Chart |
Request a new note
C
A N
S L
I M
|
FLT
-
NYSE
Fleetcor Technologies
DIVERSIFIED SERVICES - Business/Management Services
|
$97.52
|
-1.91
-1.92% |
$99.15
|
645,946
94.76% of 50 DAV
50 DAV is 681,700
|
$100.87
-3.32%
|
5/29/2013
|
$86.02
|
PP = $85.66
|
|
MB = $89.94
|
Most Recent Note - 8/12/2013 6:07:52 PM
G- Holding its ground stubbornly, extended from any sound base and perched at all-time highs. Volume totals have been cooling after spiking higher with gains backed by above average volume. See latest FSU analysis for more details and a new annotated graph.
>>> The latest Featured Stock Update with an annotated graph appeared on 8/12/2013. Click here.
View all notes |
Alert me of new notes |
CANSLIM.net Company Profile |
SEC |
Zacks Reports |
StockTalk |
News |
Chart |
Request a new note
C
A N
S L
I M
|
GNRC
-
NYSE
Generac Hldgs Inc
CONSUMER DURABLES - Electronic Equipment
|
$42.30
|
-0.61
-1.42% |
$42.63
|
573,992
50.94% of 50 DAV
50 DAV is 1,126,700
|
$44.30
-4.51%
|
7/30/2013
|
$42.60
|
PP = $42.10
|
|
MB = $44.21
|
Most Recent Note - 8/15/2013 7:17:46 PM
Y - Holding its ground stubbornly after it recently rallied from an advanced "3-weeks tight" base and priced a Secondary Offering. Disciplined investors always limit losses by selling if any stock falls more than -7% from its purchase price.
>>> The latest Featured Stock Update with an annotated graph appeared on 7/30/2013. Click here.
View all notes |
Alert me of new notes |
CANSLIM.net Company Profile |
SEC |
Zacks Reports |
StockTalk |
News |
Chart |
Request a new note
C
A N
S L
I M
|
Symbol/Exchange
Company Name
Industry Group |
PRICE |
CHANGE
(%Change) |
Day High |
Volume
(% DAV)
(% 50 day avg vol) |
52 Wk Hi
% From Hi |
Featured
Date |
Price
Featured |
Pivot Featured |
|
Max Buy |
KORS
-
NYSE
Michael Kors Hldgs Ltd
RETAIL - Apparel Stores
|
$71.23
|
-0.77
-1.07% |
$71.80
|
3,748,003
105.81% of 50 DAV
50 DAV is 3,542,200
|
$72.98
-2.40%
|
8/6/2013
|
$69.66
|
PP = $66.28
|
|
MB = $69.59
|
Most Recent Note - 8/15/2013 7:19:05 PM
G - Holding its ground beyond its "max buy" level. Prior highs in the $66 area define initial support to watch on pullbacks.
>>> The latest Featured Stock Update with an annotated graph appeared on 8/6/2013. Click here.
View all notes |
Alert me of new notes |
CANSLIM.net Company Profile |
SEC |
Zacks Reports |
StockTalk |
News |
Chart |
Request a new note
C
A N
S L
I M
|
LOPE
-
NASDAQ
Grand Canyon Education
DIVERSIFIED SERVICES - Education and; Training Services
|
$33.79
|
-1.15
-3.29% |
$34.70
|
254,496
57.27% of 50 DAV
50 DAV is 444,400
|
$37.17
-9.09%
|
6/19/2013
|
$31.47
|
PP = $34.17
|
|
MB = $35.88
|
Most Recent Note - 8/14/2013 7:11:26 PM
Y - Consolidating above important near-term support. Reported earnings +15% on +19% sales for the Jun '13 quarter, below the +25% minimum earnings guideline (C criteria), raising fundamental concerns. See the latest FSU analysis for more details and a new annotated graph.
>>> The latest Featured Stock Update with an annotated graph appeared on 8/14/2013. Click here.
View all notes |
Alert me of new notes |
CANSLIM.net Company Profile |
SEC |
Zacks Reports |
StockTalk |
News |
Chart |
Request a new note
C
A N
S L
I M
|
PCLN
-
NASDAQ
Priceline.Com Inc
INTERNET - Internet Software and Services
|
$938.79
|
-1.21
-0.13% |
$943.41
|
823,032
116.25% of 50 DAV
50 DAV is 708,000
|
$994.98
-5.65%
|
7/8/2013
|
$878.28
|
PP = $847.43
|
|
MB = $889.80
|
Most Recent Note - 8/9/2013 12:59:35 PM
G - Challenged the $1,000 threshold after it gapped up for a considerable gain and new 52-week high, getting more extended from any sound base. Reported earnings +24% on +27% sales revenues for the Jun '13 quarter, just under the +25% minimum earnings guideline (C criteria).
>>> The latest Featured Stock Update with an annotated graph appeared on 7/25/2013. Click here.
View all notes |
Alert me of new notes |
CANSLIM.net Company Profile |
SEC |
Zacks Reports |
StockTalk |
News |
Chart |
Request a new note
C
A N
S L
I M
|
PRAA
-
NASDAQ
Portfolio Recovery Assoc
DIVERSIFIED SERVICES - Business/Management Services
|
$54.82
|
-1.22
-2.18% |
$55.98
|
390,400
77.83% of 50 DAV
50 DAV is 501,600
|
$57.57
-4.78%
|
7/31/2013
|
$51.43
|
PP = $54.72
|
|
MB = $57.46
|
Most Recent Note - 8/14/2013 1:09:23 PM
Y - Perched at its 52-week high today holding its ground following an impressive spurt of volume-driven gains. It rallied above the pivot point with +130% above average volume on the prior session clinching a new technical buy signal.
>>> The latest Featured Stock Update with an annotated graph appeared on 8/2/2013. Click here.
View all notes |
Alert me of new notes |
CANSLIM.net Company Profile |
SEC |
Zacks Reports |
StockTalk |
News |
Chart |
Request a new note
C
A N
S L
I M
|
PRLB
-
NYSE
Proto Labs Inc
MANUFACTURING - Small Tools and Accessories
|
$65.68
|
-1.15
-1.72% |
$66.40
|
283,709
57.07% of 50 DAV
50 DAV is 497,100
|
$72.08
-8.88%
|
7/29/2013
|
$64.86
|
PP = $67.50
|
|
MB = $70.88
|
Most Recent Note - 8/12/2013 6:12:02 PM
Y - Tallied a 3rd consecutive gain with below or near average volume since again testing support near its 50 DMA line and prior lows when encountering distributional pressure. Disciplined investors always limit losses if any stock falls more than -7% from their purchase price.
>>> The latest Featured Stock Update with an annotated graph appeared on 8/5/2013. Click here.
View all notes |
Alert me of new notes |
CANSLIM.net Company Profile |
SEC |
Zacks Reports |
StockTalk |
News |
Chart |
Request a new note
C
A N
S L
I M
|
Symbol/Exchange
Company Name
Industry Group |
PRICE |
CHANGE
(%Change) |
Day High |
Volume
(% DAV)
(% 50 day avg vol) |
52 Wk Hi
% From Hi |
Featured
Date |
Price
Featured |
Pivot Featured |
|
Max Buy |
QCOR
-
NASDAQ
Questcor Pharmaceuticals
DRUGS - Biotechnology
|
$66.58
|
-0.80
-1.19% |
$69.06
|
1,260,439
59.96% of 50 DAV
50 DAV is 2,102,000
|
$70.55
-5.63%
|
7/31/2013
|
$66.46
|
PP = $59.01
|
|
MB = $61.96
|
Most Recent Note - 8/13/2013 7:04:51 PM
G - Rallied to its second-best close today following a brief consolidation. Quickly got extended beyond its "max buy" level after highlighted in yellow in the 7/31/13 mid-day report (read here) with a weekly graph which illustrated its powerful long-term breakout to new highs.
>>> The latest Featured Stock Update with an annotated graph appeared on 8/1/2013. Click here.
View all notes |
Alert me of new notes |
CANSLIM.net Company Profile |
SEC |
Zacks Reports |
StockTalk |
News |
Chart |
Request a new note
C
A N
S L
I M
|
SFUN
-
NYSE
Soufun Hldgs Ltd Ads A
INTERNET - Internet Information Providers
|
$37.30
|
-3.20
-7.90% |
$40.46
|
855,817
189.97% of 50 DAV
50 DAV is 450,500
|
$42.15
-11.51%
|
7/16/2013
|
$29.54
|
PP = $27.90
|
|
MB = $29.30
|
Most Recent Note - 8/15/2013 12:56:01 PM
G - Pulling back considerably after getting very extended from its latest base. Prior reports noted - "Disciplined investors avoid chasing stocks too extended from sound bases."
>>> The latest Featured Stock Update with an annotated graph appeared on 8/8/2013. Click here.
View all notes |
Alert me of new notes |
CANSLIM.net Company Profile |
SEC |
Zacks Reports |
StockTalk |
News |
Chart |
Request a new note
C
A N
S L
I M
|
SSNC
-
NASDAQ
S S & C Technologies
COMPUTER SOFTWARE and SERVICES - Application Software
|
$34.91
|
-0.39
-1.10% |
$35.15
|
300,187
70.87% of 50 DAV
50 DAV is 423,600
|
$38.80
-10.03%
|
7/11/2013
|
$35.80
|
PP = $34.54
|
|
MB = $36.27
|
Most Recent Note - 8/9/2013 5:21:29 PM
Y - Found prompt support after undercutting its 50 DMA line and prior highs in the $34 area. Disciplined investors always limit losses if ever any stock falls more than -7% from their purchase price. See the latest FSU analysis for more details and a new annotated graph.
>>> The latest Featured Stock Update with an annotated graph appeared on 8/9/2013. Click here.
View all notes |
Alert me of new notes |
CANSLIM.net Company Profile |
SEC |
Zacks Reports |
StockTalk |
News |
Chart |
Request a new note
C
A N
S L
I M
|
SSYS
-
NASDAQ
Stratasys Ltd
COMPUTER HARDWARE - Computer Peripherals
|
$96.78
|
-3.57
-3.56% |
$99.50
|
747,073
91.21% of 50 DAV
50 DAV is 819,100
|
$104.34
-7.24%
|
7/8/2013
|
$91.44
|
PP = $95.00
|
|
MB = $99.75
|
Most Recent Note - 8/13/2013 1:05:00 PM
G - Touched another new 52-week high today. It has rallied beyond its "max buy" level and prior highs in the $86 area define support to watch on pullbacks. Its Relative Strength Rating has improved to 86, above the 80+ minimum guideline for buy candidates under the fact-based investment system.
>>> The latest Featured Stock Update with an annotated graph appeared on 7/24/2013. Click here.
View all notes |
Alert me of new notes |
CANSLIM.net Company Profile |
SEC |
Zacks Reports |
StockTalk |
News |
Chart |
Request a new note
C
A N
S L
I M
|
STMP
-
NASDAQ
Stamps.Com Inc
INTERNET - Internet Software and Services
|
$39.27
|
-0.69
-1.73% |
$39.95
|
123,547
89.33% of 50 DAV
50 DAV is 138,300
|
$46.47
-15.49%
|
7/31/2013
|
$40.00
|
PP = $42.98
|
|
MB = $45.13
|
Most Recent Note - 8/13/2013 6:53:00 PM
Y - Found support at its 50 DMA line again after a recent bout of distributional pressure. Disciplined investors always limit losses if any stock falls more than -7% from their purchase price. Any stock which is sold can be bought again later if strength returns.
>>> The latest Featured Stock Update with an annotated graph appeared on 7/31/2013. Click here.
View all notes |
Alert me of new notes |
CANSLIM.net Company Profile |
SEC |
Zacks Reports |
StockTalk |
News |
Chart |
Request a new note
C
A N
S L
I M
|
Symbol/Exchange
Company Name
Industry Group |
PRICE |
CHANGE
(%Change) |
Day High |
Volume
(% DAV)
(% 50 day avg vol) |
52 Wk Hi
% From Hi |
Featured
Date |
Price
Featured |
Pivot Featured |
|
Max Buy |
VRX
-
NYSE
Valeant Pharmaceuticals
DRUGS - Drug Manufacturers - Other
|
$102.93
|
-0.97
-0.93% |
$103.14
|
1,573,802
98.30% of 50 DAV
50 DAV is 1,601,000
|
$105.40
-2.34%
|
4/30/2013
|
$60.24
|
PP = $76.66
|
|
MB = $80.49
|
Most Recent Note - 8/15/2013 7:10:07 PM
G- Holding its ground after rallying into new 52-week high territory with 9 gains in the span of 10 sessions. Reported earnings +33% on +34% sales revenues for the Jun '13 quarter, above the +25% minimum earnings guideline (C criteria). See the latest FSU analysis for more details and a new annotated graph.
>>> The latest Featured Stock Update with an annotated graph appeared on 8/15/2013. Click here.
View all notes |
Alert me of new notes |
CANSLIM.net Company Profile |
SEC |
Zacks Reports |
StockTalk |
News |
Chart |
Request a new note
C
A N
S L
I M
|
YNDX
-
NASDAQ
Yandex N V Class A
INTERNET - Internet Information Providers
|
$33.00
|
-0.70
-2.08% |
$33.73
|
1,859,789
74.74% of 50 DAV
50 DAV is 2,488,400
|
$34.79
-5.15%
|
7/10/2013
|
$29.29
|
PP = $29.59
|
|
MB = $31.07
|
Most Recent Note - 8/14/2013 1:26:02 PM
G - Hitting a new 52-week high today following a brief consolidation in a tight range with volume totals cooling in recent weeks, a sign that few investors have been headed for the exit. Its 50 DMA line coincides with prior highs in the $29 area defining important near-term support to watch.
>>> The latest Featured Stock Update with an annotated graph appeared on 7/26/2013. Click here.
View all notes |
Alert me of new notes |
CANSLIM.net Company Profile |
SEC |
Zacks Reports |
StockTalk |
News |
Chart |
Request a new note
C
A N
S L
I M
|
|
|
|
THESE ARE NOT BUY RECOMMENDATIONS!
Comments contained in the body of this report are technical
opinions only. The material herein has been obtained
from sources believed to be reliable and accurate, however,
its accuracy and completeness cannot be guaranteed.
This site is not an investment advisor, hence it does
not endorse or recommend any securities or other investments.
Any recommendation contained in this report may not
be suitable for all investors and it is not to be deemed
an offer or solicitation on our part with respect to
the purchase or sale of any securities. All trademarks,
service marks and trade names appearing in this report
are the property of their respective owners, and are
likewise used for identification purposes only.
This report is a service available
only to active Paid Premium Members.
You may opt-out of receiving report notifications
at any time. Questions or comments may be submitted
by writing to Premium Membership Services 665 S.E. 10 Street, Suite 201 Deerfield Beach, FL 33441-5634 or by calling 1-800-965-8307
or 954-785-1121.
|
|
|

