You are not logged in.
This means you
CAN ONLY VIEW reports that were published prior to Monday, April 14, 2025.
You
MUST UPGRADE YOUR MEMBERSHIP if you want to see any current reports.
AFTER MARKET UPDATE - MONDAY, AUGUST 15TH, 2011
Previous After Market Report Next After Market Report >>>
|
|
|
|
DOW |
+213.88 |
11,482.90 |
+1.90% |
|
Volume |
1,105,452,040 |
-12% |
|
Volume |
1,905,861,790 |
-13% |
|
NASDAQ |
+47.22 |
2,555.20 |
+1.88% |
|
Advancers |
2,816 |
89% |
|
Advancers |
2,132 |
79% |
|
S&P 500 |
+25.68 |
1,204.49 |
+2.18% |
|
Decliners |
285 |
9% |
|
Decliners |
501 |
19% |
|
Russell 2000 |
+21.13 |
718.63 |
+3.03% |
|
52 Wk Highs |
11 |
|
|
52 Wk Highs |
14 |
|
|
S&P 600 |
+10.83 |
391.58 |
+2.84% |
|
52 Wk Lows |
6 |
|
|
52 Wk Lows |
49 |
|
|
 |
Indices' Gains Came With Less Volume Conviction
Kenneth J. Gruneisen - Passed the CAN SLIM® Master's Exam
The S&P 500 Index extended its best three-day rally since 2009, and the major averages rose above levels last reached before S&P downgraded America's debt rating. The volume totals on Monday were lighter on the NYSE and on the Nasdaq exchange versus the prior session, however, while the major averages closed with solid gains. The lighter volume revealed a lack of conviction on the buy side from the institutional crowd. Advancing issues beat decliners by nearly 10-1 on the NYSE and by more than 4-1 on the Nasdaq exchange. The new 52-week lows totals have dwindled from Tuesday's inflated total of 1,282 on the NYSE and 725 on the Nasdaq exchange. New 52-week highs edged out new 52-week lows on the NYSE while on the Nasdaq exchange the new 52-week lows total was greater than new highs. Only 10 high-ranked companies from the CANSLIM.net Leaders List made new 52-week highs and appeared on the CANSLIM.net BreakOuts Page, up from the prior session's total of 6 stocks. Gains were posted by 5 of the 7 high-ranked leaders currently included on the Featured Stocks Page.
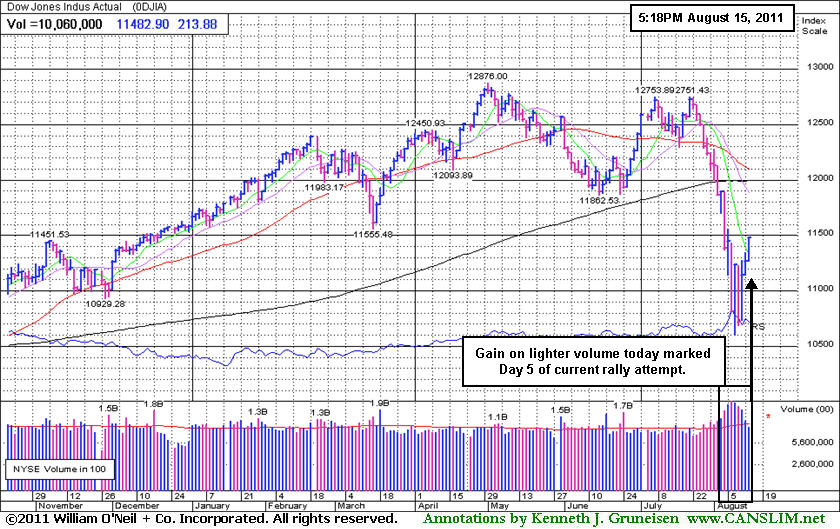
Buying enthusiasm returned to Wall Street, with mergers setting the table for a sharp advance. Monday's quiet session completed Day 5 of a new rally effort after the Dow and S&P 500 hit 11-month lows last Tuesday. Google Inc’s (GOOG -1.16%) $12.5 billion acquisition of Motorola Mobility Holdings Inc (MMI +55.78%) took top billing.
Bank of America Corp (BAC +7.93%) announced it will sell its $8.6 billion card business in Canada. Its gain helped drive financial stocks higher, along with an absence of negative headlines from Europe. Meanwhile, the Federal Reserve said banks loosened credit standards on most types of loans in the second quarter.
A report that Japan's gross domestic product shrank less than expected in the second quarter revived hopes for the global economy. The report signaled the country is rebounding from the earthquake disaster in March.
Energy stocks gained along with the price of crude oil. Oil settled up almost +3% in New York, near $88 per barrel.
Disciplined investors are maintaining a watchlist and waiting for a new rally confirmed by a solid follow-through day (FTD) before any new buying efforts are considered. A considerable higher-volume gain between Day 4 and Day 7 from at least one of the major averages is the ideal FTD confirmation that institutional buying demand has returned in a meaningful way. Meanwhile, the market environment (M criteria) argues for investors to remain cautious and preserve cash on the safe sidelines, staying away from potential harm!
The August 2011 issue of CANSLIM.net News will be published soon! Links to all prior reports are available on the Premium Member Homepage.
PICTURED: The Dow Jones Industrial Average posted a gain on lighter volume marking Day 5 of its current rally attempt.
|
 Kenneth J. Gruneisen started out as a licensed stockbroker in August 1987, a couple of months prior to the historic stock market crash that took the Dow Jones Industrial Average down -22.6% in a single day. He has published daily fact-based fundamental and technical analysis on high-ranked stocks online for two decades. Through FACTBASEDINVESTING.COM, Kenneth provides educational articles, news, market commentary, and other information regarding proven investment systems that work in good times and bad.
Comments contained in the body of this report are technical opinions only and are not necessarily those of Gruneisen Growth Corp. The material herein has been obtained from sources believed to be reliable and accurate, however, its accuracy and completeness cannot be guaranteed. Our firm, employees, and customers may effect transactions, including transactions contrary to any recommendation herein, or have positions in the securities mentioned herein or options with respect thereto. Any recommendation contained in this report may not be suitable for all investors and it is not to be deemed an offer or solicitation on our part with respect to the purchase or sale of any securities. |
|
 |
Financial, Energy-Related, and Tech Groups Led Gainers
Kenneth J. Gruneisen - Passed the CAN SLIM® Master's Exam
Financial shares helped give the market some backbone on Monday as the Bank Index ($BKX +4.19%) and Broker/Dealer Index ($XBD +2.79%) tallied solid gains. Energy-related shares rallied and gave the Integrated Oil Index ($XOI +3.60%) and Oil Services Index ($OSX +3.64%) a solid boost. The Biotechnology Index ($BTK +3.89%) led the tech sector higher while the Networking Index ($NWX +2.29%), Semiconductor Index ($SOX +1.98%), and Internet Index ($IIX +1.26%) tallied smaller gains. The Retail Index ($RLX +1.03%) rose along with defensive groups including the Healthcare Index ($HMO +2.52%) and the Gold & Silver Index ($XAU +2.85%).
Charts courtesy www.stockcharts.com
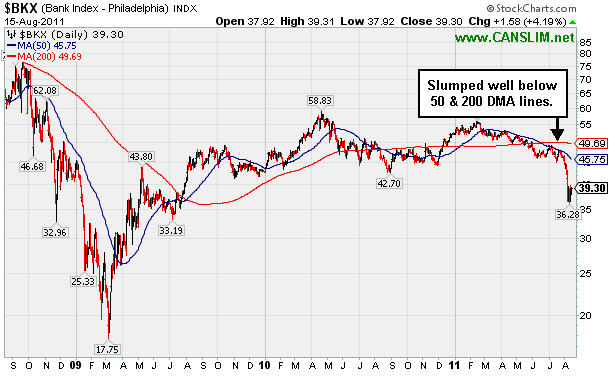
PICTURED: The Bank Index ($BKX +4.19%) recently slumped well below its 50-day and 200-day moving average (DMA) lines.
| Oil Services |
$OSX |
242.50 |
+8.51 |
+3.64% |
-1.07% |
| Healthcare |
$HMO |
1,998.55 |
+49.05 |
+2.52% |
+18.12% |
| Integrated Oil |
$XOI |
1,169.65 |
+40.64 |
+3.60% |
-3.59% |
| Semiconductor |
$SOX |
362.65 |
+7.03 |
+1.98% |
-11.94% |
| Networking |
$NWX |
247.25 |
+5.53 |
+2.29% |
-11.87% |
| Internet |
$IIX |
285.56 |
+3.55 |
+1.26% |
-7.20% |
| Broker/Dealer |
$XBD |
92.23 |
+2.50 |
+2.79% |
-24.10% |
| Retail |
$RLX |
495.58 |
+5.03 |
+1.03% |
-2.52% |
| Gold & Silver |
$XAU |
212.43 |
+5.88 |
+2.85% |
-6.25% |
| Bank |
$BKX |
39.30 |
+1.58 |
+4.19% |
-24.73% |
| Biotech |
$BTK |
1,173.42 |
+43.97 |
+3.89% |
-9.57% |
|
|
|
 |
Slump Below Prior High Closes Raises Concerns
Kenneth J. Gruneisen - Passed the CAN SLIM® Master's Exam
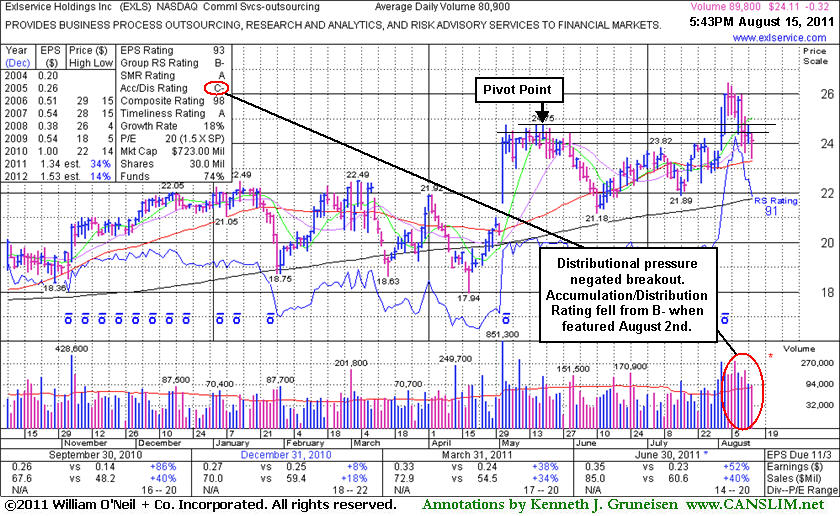
Exlservice Holdings Inc (EXLS -$0.32 or -1.31% to $24.11) suffered a loss today that led to a close below its high closes in May, negating its 8/03/11 breakout and raising more concerns. Its 50-day moving average (DMA) line (now $23.29) defines important support to watch. It was last shown in this FSU section on 8/02/11 with an annotated graph under the headline, "Finish In Lower Half Of Intra-Day Range Indicates Distribution", as it finished in the lower half of its intra-day range and below its pivot point, a sign it was encountering distributional pressure following a considerable gap up gain for a new 52-week high. Although it powered higher on the next session and technically triggered a buy signal, and no resistance remains due to overhead supply, the weak action in the broader market (M criteria) has been noted as an overriding concern arguing against new buying efforts until a new rally confirmed with a solid follow-through day occurs.
Its Accumulation/Distribution rating fell from B- to C- (see small red circle) since August 2nd when it was first featured, raising some concerns. It reported earnings +52% on +40% sales revenues for the quarter ended June 30, 2011 versus the year ago period. Quarterly comparisons (C criteria) have shown mostly impressive sales and earnings increases. Downturn in its FY '08 earnings was previously noted as a small flaw with respect to the A criteria of the fact-based investment system.
 |
|
|
Color Codes Explained :
Y - Better candidates highlighted by our
staff of experts.
G - Previously featured
in past reports as yellow but may no longer be buyable under the
guidelines.
***Last / Change / Volume data in this table is the closing quote data***
Symbol/Exchange
Company Name
Industry Group |
PRICE |
CHANGE
(%Change) |
Day High |
Volume
(% DAV)
(% 50 day avg vol) |
52 Wk Hi
% From Hi |
Featured
Date |
Price
Featured |
Pivot Featured |
|
Max Buy |
EXLS
-
NASDAQ
Exlservice Holdings Inc
DIVERSIFIED SERVICES - Business/Management Services
|
$24.11
|
-0.32
-1.31% |
$24.41
|
90,347
111.68% of 50 DAV
50 DAV is 80,900
|
$26.46
-8.88%
|
8/2/2011
|
$24.85
|
PP = $24.85
|
|
MB = $26.09
|
 Most Recent Note - 8/15/2011 4:08:20 PM
Y - Loss today led to a close below its high closes in May, negating its recent breakout and raising more concerns. Its 50 DMA line (now $23.29) defines important support to watch.
>>> The latest Featured Stock Update with an annotated graph appeared on 8/15/2011. Click here.
View all notes |
Alert me of new notes |
CANSLIM.net Company Profile |
SEC |
Zacks Reports |
StockTalk |
News |
Chart |
Request a new note
C
A N
S L
I M


|
FCFS
-
NASDAQ
First Cash Financial Svs
SPECIALTY RETAIL - Specialty Retail, Other
|
$46.07
|
-0.72
-1.54% |
$47.80
|
473,454
169.64% of 50 DAV
50 DAV is 279,100
|
$47.13
-2.25%
|
5/31/2011
|
$42.00
|
PP = $40.23
|
|
MB = $42.24
|
Most Recent Note - 8/15/2011 4:09:48 PM
G - Reversed into the red today after hitting another new 52-week high, breaking a streak of 4 consecutive volume-driven gains. Prior chart lows near $37-38 define support to watch above its 200 DMA line.
>>> The latest Featured Stock Update with an annotated graph appeared on 8/9/2011. Click here.
View all notes |
Alert me of new notes |
CANSLIM.net Company Profile |
SEC |
Zacks Reports |
StockTalk |
News |
Chart |
Request a new note
C
A N
S L
I M
|
JCOM
-
NASDAQ
J 2 Global Communication
INTERNET - Internet Software and Services
|
$29.36
|
+0.47
1.63% |
$29.45
|
225,886
70.72% of 50 DAV
50 DAV is 319,400
|
$31.72
-7.44%
|
8/8/2011
|
$30.38
|
PP = $29.31
|
|
MB = $30.78
|
Most Recent Note - 8/15/2011 4:11:10 PM
G - Quietly consolidating above its 50 and 200 DMA lines. Last week it churned a lot of volume without making progress since its 8/03/11 gap up.
>>> The latest Featured Stock Update with an annotated graph appeared on 8/8/2011. Click here.
View all notes |
Alert me of new notes |
CANSLIM.net Company Profile |
SEC |
Zacks Reports |
StockTalk |
News |
Chart |
Request a new note
C
A N
S L
I M
|
MA
-
NYSE
Mastercard Inc Cl A
DIVERSIFIED SERVICES - Business/Management Services
|
$335.00
|
+6.93
2.11% |
$338.50
|
1,491,484
102.47% of 50 DAV
50 DAV is 1,455,600
|
$340.42
-1.59%
|
8/3/2011
|
$324.82
|
PP = $322.38
|
|
MB = $338.50
|
Most Recent Note - 8/15/2011 4:14:29 PM
G - Gain today with near average volume, approaching its 8/03/11 all-time high, rallying further above the previously cited pivot point.
>>> The latest Featured Stock Update with an annotated graph appeared on 8/3/2011. Click here.
View all notes |
Alert me of new notes |
CANSLIM.net Company Profile |
SEC |
Zacks Reports |
StockTalk |
News |
Chart |
Request a new note
C
A N
S L
I M
|
MG
-
NYSE
Mistras Group Inc
DIVERSIFIED SERVICES - Bulding and Faci;ity Management Services
|
$19.58
|
+0.59
3.11% |
$19.85
|
198,360
154.97% of 50 DAV
50 DAV is 128,000
|
$19.42
0.85%
|
8/10/2011
|
$17.89
|
PP = $17.58
|
|
MB = $18.46
|
Most Recent Note - 8/15/2011 12:16:00 PM
G - Hit another new 52-week high with today's 5th consecutive gain backed by above average volume. It is extended from its prior base, and previous resistance in the $17-18 area now defines important chart support to watch on pullbacks.
>>> The latest Featured Stock Update with an annotated graph appeared on 8/11/2011. Click here.
View all notes |
Alert me of new notes |
CANSLIM.net Company Profile |
SEC |
Zacks Reports |
StockTalk |
News |
Chart |
Request a new note
C
A N
S L
I M
|
Symbol/Exchange
Company Name
Industry Group |
PRICE |
CHANGE
(%Change) |
Day High |
Volume
(% DAV)
(% 50 day avg vol) |
52 Wk Hi
% From Hi |
Featured
Date |
Price
Featured |
Pivot Featured |
|
Max Buy |
MKTX
-
NASDAQ
Marketaxess Holdings Inc
FINANCIAL SERVICES - Investment Brokerage - Nationa
|
$24.69
|
+0.53
2.19% |
$24.84
|
101,902
63.89% of 50 DAV
50 DAV is 159,500
|
$27.21
-9.26%
|
7/29/2011
|
$25.87
|
PP = $26.35
|
|
MB = $27.67
|
Most Recent Note - 8/15/2011 4:15:42 PM
G - Small gain above its 50 DMA line with light volume today. Recent lows and its 200 DMA define the next support to watch.
>>> The latest Featured Stock Update with an annotated graph appeared on 8/10/2011. Click here.
View all notes |
Alert me of new notes |
CANSLIM.net Company Profile |
SEC |
Zacks Reports |
StockTalk |
News |
Chart |
Request a new note
C
A N
S L
I M
|
PCLN
-
NASDAQ
Priceline.Com Inc
INTERNET - Internet Software and Services
|
$514.35
|
+11.24
2.23% |
$514.93
|
1,064,028
91.25% of 50 DAV
50 DAV is 1,166,000
|
$561.88
-8.46%
|
7/29/2011
|
$539.46
|
PP = $552.15
|
|
MB = $579.76
|
Most Recent Note - 8/15/2011 4:16:37 PM
G - Quiet gain today, inching back above its 50 DMA line. The 200 DMA line and recent chart lows define the next important support to watch.
>>> The latest Featured Stock Update with an annotated graph appeared on 8/12/2011. Click here.
View all notes |
Alert me of new notes |
CANSLIM.net Company Profile |
SEC |
Zacks Reports |
StockTalk |
News |
Chart |
Request a new note
C
A N
S L
I M
|
|
|
|
THESE ARE NOT BUY RECOMMENDATIONS!
Comments contained in the body of this report are technical
opinions only. The material herein has been obtained
from sources believed to be reliable and accurate, however,
its accuracy and completeness cannot be guaranteed.
This site is not an investment advisor, hence it does
not endorse or recommend any securities or other investments.
Any recommendation contained in this report may not
be suitable for all investors and it is not to be deemed
an offer or solicitation on our part with respect to
the purchase or sale of any securities. All trademarks,
service marks and trade names appearing in this report
are the property of their respective owners, and are
likewise used for identification purposes only.
This report is a service available
only to active Paid Premium Members.
You may opt-out of receiving report notifications
at any time. Questions or comments may be submitted
by writing to Premium Membership Services 665 S.E. 10 Street, Suite 201 Deerfield Beach, FL 33441-5634 or by calling 1-800-965-8307
or 954-785-1121.
|
|
|

