You are not logged in.
This means you
CAN ONLY VIEW reports that were published prior to Monday, April 14, 2025.
You
MUST UPGRADE YOUR MEMBERSHIP if you want to see any current reports.
AFTER MARKET UPDATE - WEDNESDAY, AUGUST 14TH, 2013
Previous After Market Report Next After Market Report >>>
|
|
|
|
DOW |
-113.35 |
15,337.66 |
-0.73% |
|
Volume |
621,849,120 |
+1% |
|
Volume |
1,545,078,970 |
-2% |
|
NASDAQ |
-15.17 |
3,669.27 |
-0.41% |
|
Advancers |
976 |
31% |
|
Advancers |
1,033 |
39% |
|
S&P 500 |
-8.77 |
1,685.39 |
-0.52% |
|
Decliners |
2,046 |
65% |
|
Decliners |
1,443 |
55% |
|
Russell 2000 |
-4.19 |
1,047.80 |
-0.40% |
|
52 Wk Highs |
99 |
|
|
52 Wk Highs |
118 |
|
|
S&P 600 |
-2.28 |
592.69 |
-0.38% |
|
52 Wk Lows |
248 |
|
|
52 Wk Lows |
24 |
|
|
 |
New Lows Totals Recently Expanding on NYSE
Kenneth J. Gruneisen - Passed the CAN SLIM® Master's Exam
The major averages ended Wednesday's session in the red. The volume totals were reported mixed, slightly higher than the prior session total on the NYSE while lower on the Nasdaq exchange. Breadth was negative as decliners led advancers by a 2-1 margin on the NYSE and by 7-5 on the Nasdaq exchange. There were 54 high-ranked companies from the CANSLIM.net Leaders List made new 52-week highs and appeared on the CANSLIM.net BreakOuts Page, down from the prior session total of 62 stocks. The list of stocks hitting new 52-week highs contracted yet still outnumbered new 52-week lows on the Nasdaq exchange. However, on the NYSE the new lows total swelled and outnumbered new highs for a second consecutive session. It is not a good sign to see the total number of stocks hitting new 52-week lows expand in a worrisome manner. There were gains for 5 of the 17 high-ranked companies currently included on the Featured Stocks Page. The market (M criteria) endured a number of distributional sessions in recent weeks which put the current rally under pressure. For any rally to be sustained it is absolutely crucial to have a healthy crop of new leaders, so it is most favorable for the list of stocks hitting new highs and appearing on the BreakOuts Page to continue including many companies. As always, individual holdings should be closely monitored for any worrisome technical sell signals.
The major averages erased Tuesday’s advance, but pared early losses after St. Louis Fed President Bullard reiterated that the central bank still needs to see better economic data before tapering its stimulus measures. With the Fed in focus, the economic data was on the back burner. Producer prices were unexpectedly little changed last month and another inflation reading is due out Thursday with the Consumer Price Index expected to increase by +0.2% in July.
Overall, eight of the 10 S&P 500 sectors finished in negative territory. Consumer Discretionary gave up the most ground as Macy's (M -4.47%) fell after posting a weak earnings report. Industrial stocks also lagged behind, led by and Deere & Co (DE -1.87%) after the company delivered a disappointing revenue outlook. Technology managed to eke out minor gains thanks to Apple Inc's (AAPL +1.82%).
In fixed-income, Treasuries gained some ground. The 10-year note was up 2/32 to yield 2.71% and the 30-year bond gained 3/32 to yield 3.75%.
Stay familiar with companies listed on the CANSLIM.net Featured Stocks Page - a page showing the most action-worthy candidates' latest notes and links to additional resources including detailed analysis with data-packed graphs which are annotated by a Certified expert. The Premium Member Homepage - includes "dynamic archives" to all prior pay reports published. Watch for an announcement via email concerning the next WEBCAST.
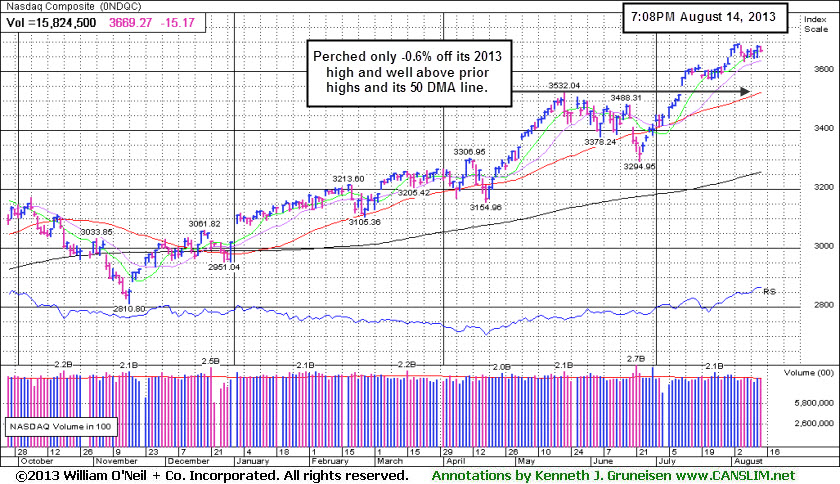
PICTURED: The Nasdaq Composite Index is hovering -0.6% off its 2013 high, remaining well above prior highs and well above its 50-day moving average (DMA). Its Relative Strength line (jagged blue line) has been rising in recent weeks, reflecting the tech sector's recent leadership.
|
 Kenneth J. Gruneisen started out as a licensed stockbroker in August 1987, a couple of months prior to the historic stock market crash that took the Dow Jones Industrial Average down -22.6% in a single day. He has published daily fact-based fundamental and technical analysis on high-ranked stocks online for two decades. Through FACTBASEDINVESTING.COM, Kenneth provides educational articles, news, market commentary, and other information regarding proven investment systems that work in good times and bad.
Comments contained in the body of this report are technical opinions only and are not necessarily those of Gruneisen Growth Corp. The material herein has been obtained from sources believed to be reliable and accurate, however, its accuracy and completeness cannot be guaranteed. Our firm, employees, and customers may effect transactions, including transactions contrary to any recommendation herein, or have positions in the securities mentioned herein or options with respect thereto. Any recommendation contained in this report may not be suitable for all investors and it is not to be deemed an offer or solicitation on our part with respect to the purchase or sale of any securities. |
|
 |
Miners of Metals Outpaced ETF Tracking Bullion
Kenneth J. Gruneisen - Passed the CAN SLIM® Master's Exam
The Semiconductor Index ($SOX -1.61%) led the tech sector's retreat while the Internet Index ($IIX -0.61%) and Biotechnology Index ($BTK -0.48%) suffered smaller losses and the Networking Index ($NWX +0.35%) eked out a small gain. The Retail Index ($RLX -1.51%) created a drag on the major averages along with the Healthcare Index ($HMO -1.08%). Energy-related shares did a better job of holding their ground as the Oil Services Index ($OSX -0.59%) and the Integrated Oil Index ($XOI -0.18%) edged lower. The Bank Index ($BKX +0.00%) finished flat and the Broker/Dealer Index ($XBD -0.34%) ended with a small loss. The Gold & Silver Index ($XAU +4.91%) roared higher again, clearing the July highs.
Charts courtesy www.stockcharts.com
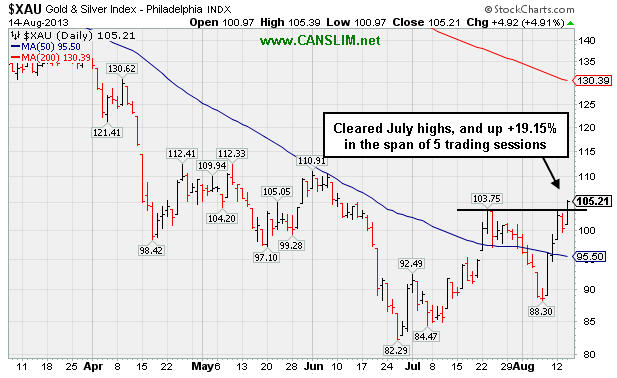
PICTURED 1: The Gold & Silver Index ($XAU +4.91%) roared higher again, clearing the July highs. It has rallied +19.15% in the span of 5 sessions.
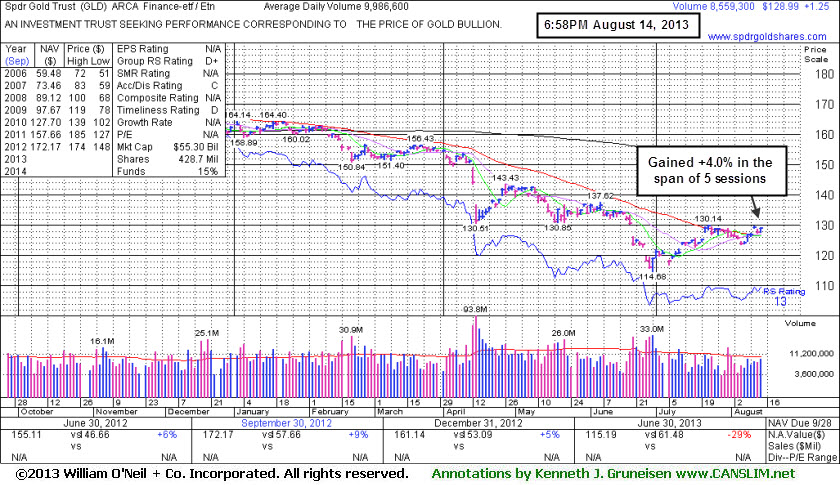
PICTURED 2: Consider the XAU's +19.15% above mentioned gain versus the performance of the ETF tracking the price of gold bullion (GLD) which rose only +4% during the same 5-day span.
| Oil Services |
$OSX |
262.64 |
-1.57 |
-0.59% |
+19.30% |
| Healthcare |
$HMO |
3,387.79 |
-37.02 |
-1.08% |
+34.75% |
| Integrated Oil |
$XOI |
1,374.18 |
-2.46 |
-0.18% |
+10.66% |
| Semiconductor |
$SOX |
471.34 |
-7.73 |
-1.61% |
+22.73% |
| Networking |
$NWX |
299.55 |
+1.03 |
+0.35% |
+32.22% |
| Internet |
$IIX |
408.73 |
-2.52 |
-0.61% |
+24.99% |
| Broker/Dealer |
$XBD |
135.14 |
-0.46 |
-0.34% |
+43.26% |
| Retail |
$RLX |
831.91 |
-12.72 |
-1.51% |
+27.39% |
| Gold & Silver |
$XAU |
105.21 |
+4.92 |
+4.91% |
-36.47% |
| Bank |
$BKX |
65.36 |
+0.00 |
+0.00% |
+27.46% |
| Biotech |
$BTK |
2,064.28 |
-10.00 |
-0.48% |
+33.44% |
|
|
|
 |
Finding Support Near 50-Day Average After Disappointing Quarter
Kenneth J. Gruneisen - Passed the CAN SLIM® Master's Exam
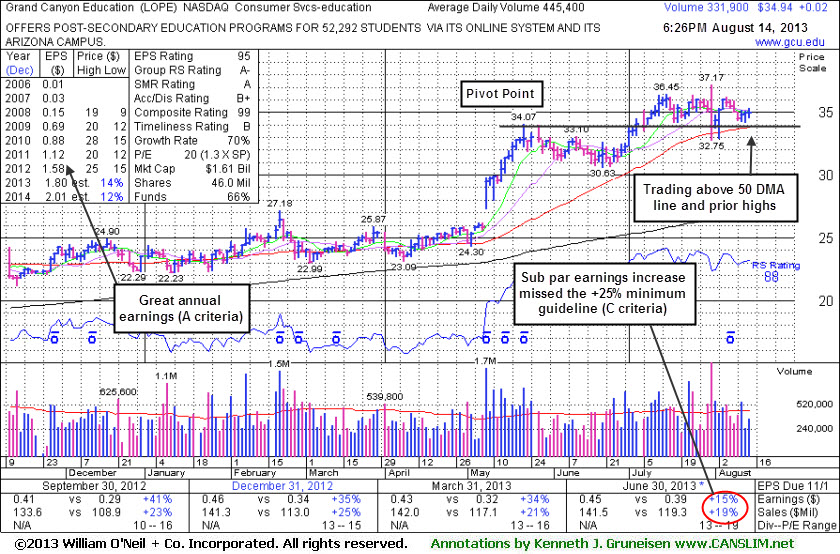
Grand Canyon Education's (LOPE +$0.02 or +0.06% to $34.94) has held its ground despite fundamental concerns raised since it reported earnings +15% on +19% sales for the Jun '13 quarter, below the +25% minimum earnings guideline (C criteria). Prior highs in the $34 area define support along with its 50-day moving average (DMA) line, and subsequent violations would trigger technical sell signals. Its Relative Strength Rating (88) remains above the 80+ minimum guideline, despite its lack of substantial price progress. It marked its high on 7/31/13 with a "negative reversal" after making limited headway since last shown in this FSU section with an annotated graph on 7/19/13 under the headline, "Consolidating Above Prior Highs Following Latest Breakout".
The Commercial Services - Schools group has shown leadership (L criteria) and currently has an A- Rating. As it blasted into all-time high territory back in May, rallying above an earlier pivot point and also above its April 2010 high (N criteria), it was noted - "Showing bullish technical action which may mark the beginning of a meaningful and sustained advance in price." The number of top-rated funds owning its shares rose from 200 in Mar '12 to 306 in Jun '13, a reassuring trend concerning the I criteria. Its small supply (S criteria) of 46 million outstanding shares could contribute to greater price volatility in the event of institutional buying or selling.
|
|
|
Color Codes Explained :
Y - Better candidates highlighted by our
staff of experts.
G - Previously featured
in past reports as yellow but may no longer be buyable under the
guidelines.
***Last / Change / Volume data in this table is the closing quote data***
Symbol/Exchange
Company Name
Industry Group |
PRICE |
CHANGE
(%Change) |
Day High |
Volume
(% DAV)
(% 50 day avg vol) |
52 Wk Hi
% From Hi |
Featured
Date |
Price
Featured |
Pivot Featured |
|
Max Buy |
AMBA
-
NASDAQ
Ambarella Inc
ELECTRONICS - Semiconductor - Specialized
|
$16.89
|
+0.04
0.24% |
$17.06
|
610,627
54.24% of 50 DAV
50 DAV is 1,125,700
|
$19.44
-13.12%
|
7/15/2013
|
$17.87
|
PP = $18.68
|
|
MB = $19.61
|
Most Recent Note - 8/13/2013 6:39:28 PM
G - Its 50 DMA line has acted as resistance following the technical violation which triggered a sell signal on 7/30/13. See the latest FSU analysis for more details and a new annotated graph.
>>> The latest Featured Stock Update with an annotated graph appeared on 8/13/2013. Click here.
View all notes |
Alert me of new notes |
CANSLIM.net Company Profile |
SEC |
Zacks Reports |
StockTalk |
News |
Chart |
Request a new note
C
A N
S L
I M


|
BITA
-
NYSE
Bitauto Hldgs Ltd Ads
INTERNET - Internet Information Providers
|
$15.70
|
-0.30
-1.88% |
$16.02
|
211,351
123.24% of 50 DAV
50 DAV is 171,500
|
$18.10
-13.26%
|
8/7/2013
|
$12.01
|
PP = $13.30
|
|
MB = $13.97
|
Most Recent Note - 8/13/2013 6:41:09 PM
G - Holding its ground stubbornly after 2 consecutive big volume-driven gains for new highs. Prior highs in the $13 area define initial support to watch on pullbacks. The 8/07/13 After Market Update included more details and a new annotated graph under the headline "Found Prompt Support After Undercutting 50-Day Average".
>>> The latest Featured Stock Update with an annotated graph appeared on 8/7/2013. Click here.
View all notes |
Alert me of new notes |
CANSLIM.net Company Profile |
SEC |
Zacks Reports |
StockTalk |
News |
Chart |
Request a new note
C
A N
S L
I M
|
CELG
-
NASDAQ
Celgene Corp
DRUGS - Drug Manufacturers - Major
|
$137.38
|
-0.27
-0.20% |
$139.67
|
1,335,505
48.89% of 50 DAV
50 DAV is 2,731,600
|
$149.92
-8.36%
|
7/11/2013
|
$133.25
|
PP = $131.92
|
|
MB = $138.52
|
Most Recent Note - 8/13/2013 6:43:38 PM
Y - Color code is changed to yellow after retreating below its "max buy" level with a loss today on average volume. Prior highs in the $131 area define initial chart support above its 50 DMA line.
>>> The latest Featured Stock Update with an annotated graph appeared on 7/29/2013. Click here.
View all notes |
Alert me of new notes |
CANSLIM.net Company Profile |
SEC |
Zacks Reports |
StockTalk |
News |
Chart |
Request a new note
C
A N
S L
I M
|
FLT
-
NYSE
Fleetcor Technologies
DIVERSIFIED SERVICES - Business/Management Services
|
$99.43
|
+1.98
2.03% |
$100.30
|
816,941
119.65% of 50 DAV
50 DAV is 682,800
|
$100.87
-1.43%
|
5/29/2013
|
$86.02
|
PP = $85.66
|
|
MB = $89.94
|
Most Recent Note - 8/12/2013 6:07:52 PM
G- Holding its ground stubbornly, extended from any sound base and perched at all-time highs. Volume totals have been cooling after spiking higher with gains backed by above average volume. See latest FSU analysis for more details and a new annotated graph.
>>> The latest Featured Stock Update with an annotated graph appeared on 8/12/2013. Click here.
View all notes |
Alert me of new notes |
CANSLIM.net Company Profile |
SEC |
Zacks Reports |
StockTalk |
News |
Chart |
Request a new note
C
A N
S L
I M
|
GNRC
-
NYSE
Generac Hldgs Inc
CONSUMER DURABLES - Electronic Equipment
|
$42.91
|
+0.22
0.52% |
$43.17
|
694,436
60.98% of 50 DAV
50 DAV is 1,138,700
|
$44.30
-3.14%
|
7/30/2013
|
$42.60
|
PP = $42.10
|
|
MB = $44.21
|
Most Recent Note - 8/8/2013 5:21:29 PM
Y - Holding its ground since gapping down on 8/02/13 after pricing a Secondary Offering. It recently rallied from an advanced "3-weeks tight" base. Disciplined investors always limit losses by selling if any stock falls more than -7% from its purchase price.
>>> The latest Featured Stock Update with an annotated graph appeared on 7/30/2013. Click here.
View all notes |
Alert me of new notes |
CANSLIM.net Company Profile |
SEC |
Zacks Reports |
StockTalk |
News |
Chart |
Request a new note
C
A N
S L
I M
|
Symbol/Exchange
Company Name
Industry Group |
PRICE |
CHANGE
(%Change) |
Day High |
Volume
(% DAV)
(% 50 day avg vol) |
52 Wk Hi
% From Hi |
Featured
Date |
Price
Featured |
Pivot Featured |
|
Max Buy |
KORS
-
NYSE
Michael Kors Hldgs Ltd
RETAIL - Apparel Stores
|
$72.00
|
-0.40
-0.55% |
$72.75
|
3,199,223
90.23% of 50 DAV
50 DAV is 3,545,600
|
$72.98
-1.34%
|
8/6/2013
|
$69.66
|
PP = $66.28
|
|
MB = $69.59
|
Most Recent Note - 8/8/2013 5:24:09 PM
G - Posted a gain with above average volume getting extended beyond its "max buy" level, and its color code is changed to green. Relative Strength rating improved to 83, above the 80+ minimum guideline for buy candidates.
>>> The latest Featured Stock Update with an annotated graph appeared on 8/6/2013. Click here.
View all notes |
Alert me of new notes |
CANSLIM.net Company Profile |
SEC |
Zacks Reports |
StockTalk |
News |
Chart |
Request a new note
C
A N
S L
I M
|
LOPE
-
NASDAQ
Grand Canyon Education
DIVERSIFIED SERVICES - Education and; Training Services
|
$34.94
|
+0.02
0.06% |
$35.30
|
332,754
74.71% of 50 DAV
50 DAV is 445,400
|
$37.17
-6.00%
|
6/19/2013
|
$31.47
|
PP = $34.17
|
|
MB = $35.88
|
 Most Recent Note - 8/14/2013 7:11:26 PM
Y - Consolidating above important near-term support. Reported earnings +15% on +19% sales for the Jun '13 quarter, below the +25% minimum earnings guideline (C criteria), raising fundamental concerns. See the latest FSU analysis for more details and a new annotated graph.
>>> The latest Featured Stock Update with an annotated graph appeared on 8/14/2013. Click here.
View all notes |
Alert me of new notes |
CANSLIM.net Company Profile |
SEC |
Zacks Reports |
StockTalk |
News |
Chart |
Request a new note
C
A N
S L
I M
|
PCLN
-
NASDAQ
Priceline.Com Inc
INTERNET - Internet Software and Services
|
$940.00
|
-13.61
-1.43% |
$958.97
|
834,609
118.91% of 50 DAV
50 DAV is 701,900
|
$994.98
-5.53%
|
7/8/2013
|
$878.28
|
PP = $847.43
|
|
MB = $889.80
|
Most Recent Note - 8/9/2013 12:59:35 PM
G - Challenged the $1,000 threshold after it gapped up for a considerable gain and new 52-week high, getting more extended from any sound base. Reported earnings +24% on +27% sales revenues for the Jun '13 quarter, just under the +25% minimum earnings guideline (C criteria).
>>> The latest Featured Stock Update with an annotated graph appeared on 7/25/2013. Click here.
View all notes |
Alert me of new notes |
CANSLIM.net Company Profile |
SEC |
Zacks Reports |
StockTalk |
News |
Chart |
Request a new note
C
A N
S L
I M
|
PRAA
-
NASDAQ
Portfolio Recovery Assoc
DIVERSIFIED SERVICES - Business/Management Services
|
$56.04
|
-0.84
-1.48% |
$57.53
|
802,353
163.45% of 50 DAV
50 DAV is 490,900
|
$54.62
2.59%
|
7/31/2013
|
$51.43
|
PP = $54.72
|
|
MB = $57.46
|
Most Recent Note - 8/14/2013 1:09:23 PM
Y - Perched at its 52-week high today holding its ground following an impressive spurt of volume-driven gains. It rallied above the pivot point with +130% above average volume on the prior session clinching a new technical buy signal.
>>> The latest Featured Stock Update with an annotated graph appeared on 8/2/2013. Click here.
View all notes |
Alert me of new notes |
CANSLIM.net Company Profile |
SEC |
Zacks Reports |
StockTalk |
News |
Chart |
Request a new note
C
A N
S L
I M
|
PRLB
-
NYSE
Proto Labs Inc
MANUFACTURING - Small Tools and Accessories
|
$66.83
|
-1.60
-2.34% |
$68.57
|
239,883
48.47% of 50 DAV
50 DAV is 494,900
|
$72.08
-7.28%
|
7/29/2013
|
$64.86
|
PP = $67.50
|
|
MB = $70.88
|
Most Recent Note - 8/12/2013 6:12:02 PM
Y - Tallied a 3rd consecutive gain with below or near average volume since again testing support near its 50 DMA line and prior lows when encountering distributional pressure. Disciplined investors always limit losses if any stock falls more than -7% from their purchase price.
>>> The latest Featured Stock Update with an annotated graph appeared on 8/5/2013. Click here.
View all notes |
Alert me of new notes |
CANSLIM.net Company Profile |
SEC |
Zacks Reports |
StockTalk |
News |
Chart |
Request a new note
C
A N
S L
I M
|
Symbol/Exchange
Company Name
Industry Group |
PRICE |
CHANGE
(%Change) |
Day High |
Volume
(% DAV)
(% 50 day avg vol) |
52 Wk Hi
% From Hi |
Featured
Date |
Price
Featured |
Pivot Featured |
|
Max Buy |
QCOR
-
NASDAQ
Questcor Pharmaceuticals
DRUGS - Biotechnology
|
$67.38
|
-1.67
-2.42% |
$69.82
|
1,270,977
60.40% of 50 DAV
50 DAV is 2,104,400
|
$70.55
-4.49%
|
7/31/2013
|
$66.46
|
PP = $59.01
|
|
MB = $61.96
|
Most Recent Note - 8/13/2013 7:04:51 PM
G - Rallied to its second-best close today following a brief consolidation. Quickly got extended beyond its "max buy" level after highlighted in yellow in the 7/31/13 mid-day report (read here) with a weekly graph which illustrated its powerful long-term breakout to new highs.
>>> The latest Featured Stock Update with an annotated graph appeared on 8/1/2013. Click here.
View all notes |
Alert me of new notes |
CANSLIM.net Company Profile |
SEC |
Zacks Reports |
StockTalk |
News |
Chart |
Request a new note
C
A N
S L
I M
|
SFUN
-
NYSE
Soufun Hldgs Ltd Ads A
INTERNET - Internet Information Providers
|
$40.50
|
-0.50
-1.22% |
$41.26
|
1,109,257
256.30% of 50 DAV
50 DAV is 432,800
|
$39.98
1.30%
|
7/16/2013
|
$29.54
|
PP = $27.90
|
|
MB = $29.30
|
Most Recent Note - 8/14/2013 1:18:44 PM
G - Perched at its 52-week high, very extended from its latest base after considerable volume-driven gains. Disciplined investors avoid chasing stocks too extended from sound bases.
>>> The latest Featured Stock Update with an annotated graph appeared on 8/8/2013. Click here.
View all notes |
Alert me of new notes |
CANSLIM.net Company Profile |
SEC |
Zacks Reports |
StockTalk |
News |
Chart |
Request a new note
C
A N
S L
I M
|
SSNC
-
NASDAQ
S S & C Technologies
COMPUTER SOFTWARE and SERVICES - Application Software
|
$35.30
|
-0.31
-0.87% |
$35.76
|
131,102
30.93% of 50 DAV
50 DAV is 423,900
|
$38.80
-9.02%
|
7/11/2013
|
$35.80
|
PP = $34.54
|
|
MB = $36.27
|
Most Recent Note - 8/9/2013 5:21:29 PM
Y - Found prompt support after undercutting its 50 DMA line and prior highs in the $34 area. Disciplined investors always limit losses if ever any stock falls more than -7% from their purchase price. See the latest FSU analysis for more details and a new annotated graph.
>>> The latest Featured Stock Update with an annotated graph appeared on 8/9/2013. Click here.
View all notes |
Alert me of new notes |
CANSLIM.net Company Profile |
SEC |
Zacks Reports |
StockTalk |
News |
Chart |
Request a new note
C
A N
S L
I M
|
SSYS
-
NASDAQ
Stratasys Ltd
COMPUTER HARDWARE - Computer Peripherals
|
$100.35
|
-2.09
-2.04% |
$102.36
|
582,549
70.48% of 50 DAV
50 DAV is 826,500
|
$99.50
0.85%
|
7/8/2013
|
$91.44
|
PP = $95.00
|
|
MB = $99.75
|
Most Recent Note - 8/13/2013 1:05:00 PM
G - Touched another new 52-week high today. It has rallied beyond its "max buy" level and prior highs in the $86 area define support to watch on pullbacks. Its Relative Strength Rating has improved to 86, above the 80+ minimum guideline for buy candidates under the fact-based investment system.
>>> The latest Featured Stock Update with an annotated graph appeared on 7/24/2013. Click here.
View all notes |
Alert me of new notes |
CANSLIM.net Company Profile |
SEC |
Zacks Reports |
StockTalk |
News |
Chart |
Request a new note
C
A N
S L
I M
|
STMP
-
NASDAQ
Stamps.Com Inc
INTERNET - Internet Software and Services
|
$39.96
|
-0.41
-1.02% |
$40.92
|
118,476
84.93% of 50 DAV
50 DAV is 139,500
|
$46.47
-14.01%
|
7/31/2013
|
$40.00
|
PP = $42.98
|
|
MB = $45.13
|
Most Recent Note - 8/13/2013 6:53:00 PM
Y - Found support at its 50 DMA line again after a recent bout of distributional pressure. Disciplined investors always limit losses if any stock falls more than -7% from their purchase price. Any stock which is sold can be bought again later if strength returns.
>>> The latest Featured Stock Update with an annotated graph appeared on 7/31/2013. Click here.
View all notes |
Alert me of new notes |
CANSLIM.net Company Profile |
SEC |
Zacks Reports |
StockTalk |
News |
Chart |
Request a new note
C
A N
S L
I M
|
Symbol/Exchange
Company Name
Industry Group |
PRICE |
CHANGE
(%Change) |
Day High |
Volume
(% DAV)
(% 50 day avg vol) |
52 Wk Hi
% From Hi |
Featured
Date |
Price
Featured |
Pivot Featured |
|
Max Buy |
VRX
-
NYSE
Valeant Pharmaceuticals
DRUGS - Drug Manufacturers - Other
|
$103.90
|
-0.08
-0.08% |
$105.40
|
1,501,179
93.28% of 50 DAV
50 DAV is 1,609,300
|
$102.54
1.33%
|
4/30/2013
|
$60.24
|
PP = $76.66
|
|
MB = $80.49
|
Most Recent Note - 8/13/2013 6:59:54 PM
G- Rallying into new 52-week high territory with 9 gains in the span of 10 sessions. It is extended from a sound base after "wedging" higher with recent gains lacking great volume conviction while rising from a previously noted cup-with-handle base pattern. Reported earnings +33% on +34% sales revenues for the Jun '13 quarter, above the +25% minimum earnings guideline (C criteria), a strong follow-up to sub par Mar '13 results.
>>> The latest Featured Stock Update with an annotated graph appeared on 7/23/2013. Click here.
View all notes |
Alert me of new notes |
CANSLIM.net Company Profile |
SEC |
Zacks Reports |
StockTalk |
News |
Chart |
Request a new note
C
A N
S L
I M
|
YNDX
-
NASDAQ
Yandex N V Class A
INTERNET - Internet Information Providers
|
$33.70
|
+0.50
1.51% |
$34.79
|
3,401,154
138.51% of 50 DAV
50 DAV is 2,455,500
|
$34.27
-1.66%
|
7/10/2013
|
$29.29
|
PP = $29.59
|
|
MB = $31.07
|
Most Recent Note - 8/14/2013 1:26:02 PM
G - Hitting a new 52-week high today following a brief consolidation in a tight range with volume totals cooling in recent weeks, a sign that few investors have been headed for the exit. Its 50 DMA line coincides with prior highs in the $29 area defining important near-term support to watch.
>>> The latest Featured Stock Update with an annotated graph appeared on 7/26/2013. Click here.
View all notes |
Alert me of new notes |
CANSLIM.net Company Profile |
SEC |
Zacks Reports |
StockTalk |
News |
Chart |
Request a new note
C
A N
S L
I M
|
|
|
|
THESE ARE NOT BUY RECOMMENDATIONS!
Comments contained in the body of this report are technical
opinions only. The material herein has been obtained
from sources believed to be reliable and accurate, however,
its accuracy and completeness cannot be guaranteed.
This site is not an investment advisor, hence it does
not endorse or recommend any securities or other investments.
Any recommendation contained in this report may not
be suitable for all investors and it is not to be deemed
an offer or solicitation on our part with respect to
the purchase or sale of any securities. All trademarks,
service marks and trade names appearing in this report
are the property of their respective owners, and are
likewise used for identification purposes only.
This report is a service available
only to active Paid Premium Members.
You may opt-out of receiving report notifications
at any time. Questions or comments may be submitted
by writing to Premium Membership Services 665 S.E. 10 Street, Suite 201 Deerfield Beach, FL 33441-5634 or by calling 1-800-965-8307
or 954-785-1121.
|
|
|

