You are not logged in.
This means you
CAN ONLY VIEW reports that were published prior to Monday, April 14, 2025.
You
MUST UPGRADE YOUR MEMBERSHIP if you want to see any current reports.
AFTER MARKET UPDATE - FRIDAY, AUGUST 14TH, 2009
Previous After Market Report Next After Market Report >>>
|
|
|
|
DOW |
-76.79 |
9,321.40 |
-0.82% |
|
Volume |
1,094,289,170 |
+41% |
|
Volume |
1,989,444,710 |
-7% |
|
NASDAQ |
-23.83 |
1,985.52 |
-1.19% |
|
Advancers |
859 |
28% |
|
Advancers |
602 |
21% |
|
S&P 500 |
-8.64 |
1,004.09 |
-0.85% |
|
Decliners |
2,160 |
69% |
|
Decliners |
2,104 |
75% |
|
Russell 2000 |
-11.29 |
563.90 |
-1.96% |
|
52 Wk Highs |
47 |
|
|
52 Wk Highs |
15 |
|
|
S&P 600 |
-5.58 |
299.18 |
-1.83% |
|
52 Wk Lows |
2 |
|
|
52 Wk Lows |
1 |
|
|
 |
Major Averages Quietly Break 4 Week Winning Streak
Adam Sarhan, Contributing Writer,
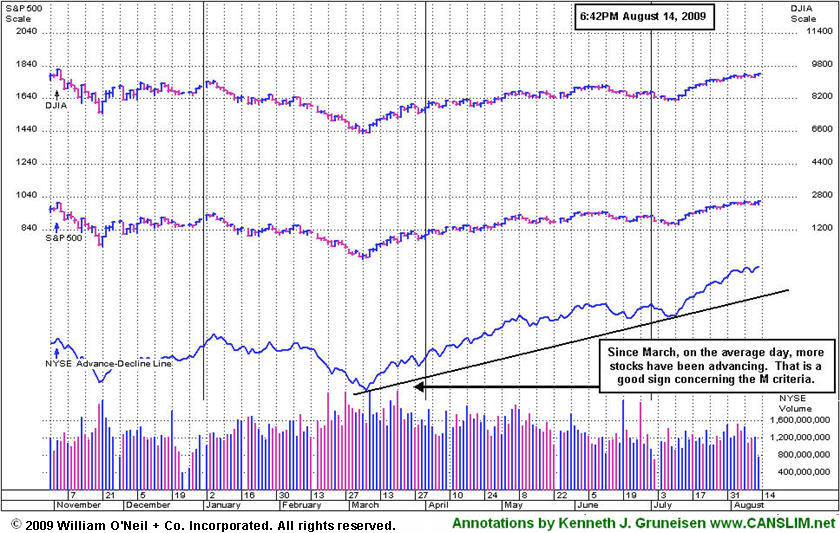
The volume total reported on the NYSE was higher while the Nasdaq exchange total was lower than the prior session (both totals still below average) as the major averages collectively ended Friday's session with losses and broke a 4-week winning streak. Decliners led advancers by more than a 2-to-1 ratio on the NYSE and by more than a 3-to-1 ratio on the Nasdaq exchange. There were only 6 high-ranked companies from the CANSLIM.net Leaders List that made a new 52-week high and appeared on the CANSLIM.net BreakOuts Page, down from than the 17 issues that appeared on the prior session. On both exchanges new 52-week highs still outnumbered 52-week lows, and new lows were in the single digits.
On Monday, the major averages ended unanimously lower as traders returned from one of the last few weekends of the summer. The benchmark S&P 500's P/E ratio jumped to 18.6 which is the highest ratio since December 2004. Even though the index as rallied smartly since its March low of 666, the index must rally another +55% to surpass its all-time high of 1,565.15 set on October 9, 2007. For those of you that like market trivia - before November 2008, the S&P 500 had remained above the 1,000 mark for five consecutive years.
On Tuesday, the major averages got smacked, led lower by financials, after a flurry of downgrades weighed on the market. CIT Group (CIT -2.76%) and MBIA Inc (MBIA) both dragged financials lower. As CIT struggles to stay alive, the country's largest bond insurer plunged after an analyst from JPMorgan Chase & Co (JPM -1.05%) lowered the stock to a rating of "underweight." These disappointments coupled with negative comments from famous bank analyst Dick Bove sent a slew of financials lower on Tuesday. Bove, a famous banking analyst, said he expects shares of lenders to retreat after their recent gains.
Stocks bounced back sharply on Wednesday as the Federal Reserve held rates steady and concluded their two-day meeting. The Federal Reserve left its benchmark interest rate between zero and 0.25% and said economic conditions will remain "exceptionally low" for an "extended period." The decision to hold rates near steady was unanimous. As the economy begins to show small signs of recovering, the Fed said it will slow the pace of its $300 billion program to buy US Treasuries while the recession eases. In their post meeting commentary, the committee said, "To promote a smooth transition in markets as these purchases of Treasury securities are completed, the committee has decided to gradually slow the pace of these transactions and anticipates that the full amount will be purchased by the end of October." Previously, the buying was scheduled to end in September. In economic news, the US trade deficit widened less than forecast in June, which reflected a second consecutive gain in exports. Stronger exports are largely a two-fold function: a weaker dollar coupled with healthier economies around the world. The Commerce Department said the gap expanded 4% to $27 billion from $26 billion in May. This was the lowest reading in nearly a decade. Exports rose +2% while imports rose +2.3%, led by higher oil prices.
On Thursday, the market was a relatively quiet as investors digested the large price swings from earlier in the week. Retail giant, Wal-Mart Stores Inc. (WMT -0.17%) vaulted above its downward sloping 200-day moving average (DMA) line after it reported a stronger-than-expected earnings report for the second quarter.This helped offset an unexpected slump in retail sales which serves as a strong proxy for the broader economy. Retail sales slid -0.1% in July which was the first decline in three months and below the Street's estimates.
Stocks sold off again on Friday, sending the major averages back to the lower end of their respective short-term trading ranges after a lower-than-expected consumer confidence report added to concerns that the current five-month rally has run its course. Elsewhere, the Labor Department said Friday that consumer prices showed no changed in July which matched Wall Street's expectations and much lower than the +0.7% jump in June. Consumer prices fell -2.1% over the past 12 months which was the largest annual decline since a similar drop in the period ending in January 1950! Taking a closer look at the data shows that the vast majority of the decline reflects falling energy prices which are off nearly -50% since peaking in July 2008.
PICTURED: Since March, on the average day, more stocks have been advancing. That is a good sign concerning the M criteria.
|
|
|
 |
Tech, Commodity, and Retail Groups Pull Back
Kenneth J. Gruneisen - Passed the CAN SLIM® Master's Exam
The Bank Index ($BKX +0.17%) posted a tiny gain on Friday, but the negative influence of the Broker/Dealer Index ($XBD -1.92%) and Retail Index ($RLX -1.69%) and many other groups dragged the major averages lower. Commodity-linked areas were weak as the Oil Services Index ($OSX -2.87%), Integrated Oil Index ($XOI -1.02%) and the Gold & Silver Index ($XAU -2.08%) lost ground. The Semiconductor Index ($SOX -2.55%) led the tech sectors' declines and the Biotechnology Index ($BTK -1.92%), Networking Index ($NWX -1.64%), and Internet Index ($IIX -1.15%) collectively ended in the red. A modest loss for the Healthcare Index ($HMO -0.81%) group rounded out the quiet and mostly negative session.
Charts courtesy www.stockcharts.com
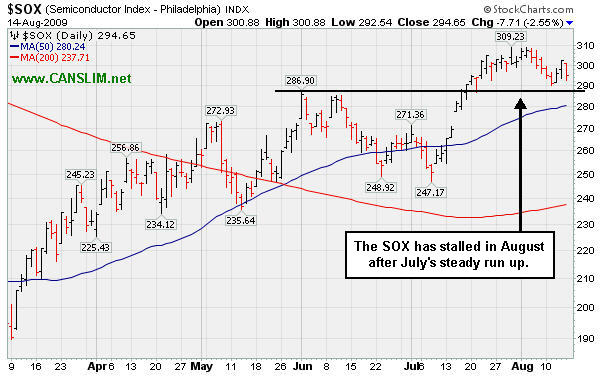
PICTURED: The Semiconductor Index ($SOX -2.55%) stalled in August, consolidating after July's steady run up.
| Oil Services |
$OSX |
171.21 |
-5.05 |
-2.87% |
+41.04% |
| Healthcare |
$HMO |
1,184.47 |
-9.73 |
-0.81% |
+23.36% |
| Integrated Oil |
$XOI |
952.46 |
-9.79 |
-1.02% |
-2.78% |
| Semiconductor |
$SOX |
294.65 |
-7.71 |
-2.55% |
+38.87% |
| Networking |
$NWX |
208.62 |
-3.48 |
-1.64% |
+44.99% |
| Internet |
$IIX |
202.38 |
-2.36 |
-1.15% |
+51.29% |
| Broker/Dealer |
$XBD |
109.75 |
-2.15 |
-1.92% |
+41.67% |
| Retail |
$RLX |
361.69 |
-6.21 |
-1.69% |
+29.52% |
| Gold & Silver |
$XAU |
145.89 |
-3.10 |
-2.08% |
+17.80% |
| Bank |
$BKX |
45.82 |
+0.08 |
+0.17% |
+3.38% |
| Biotech |
$BTK |
858.56 |
-16.85 |
-1.92% |
+32.66% |
|
|
|
 |
Increase In Share Supply May Be A Hindrance
Kenneth J. Gruneisen - Passed the CAN SLIM® Master's Exam
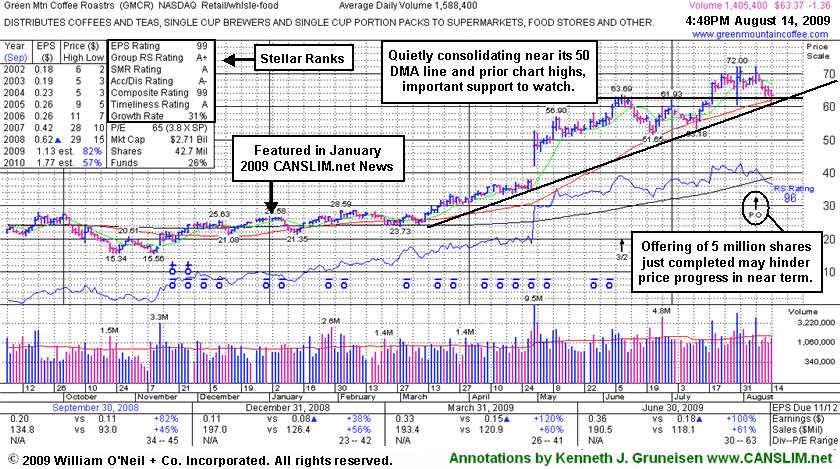
Green Mountain Coffee Roasters (GMCR -1.36 or -2.10% to $63.37) fell for a 5th consecutive session on below average volume. It has been consolidating toward its 50 DMA line ever since it completed an offering of 5 million common shares. Strong leaders tend to keep on leading, however those who are watching for early sell signals should look out for a violation of the multi-month upward trendline, any subsequent deterioration under prior highs in the $62-63 area, or a violation of its 50-day moving average (DMA) line (now $61.68). If you have "force fed" your winners over time, accumulating at multiple buy points, always be disciplined about limiting losses by selling any higher priced shares you may have bought if the stock falls more than -7% from the price you paid for them. You might decide to hold shares owned at a lower cost basis, but be prompt to lock in profits whenever clear technical sell signals occur.
Bank of America Merrill Lynch was the "sole" book-running manager of the recent offering, with Canaccord Adams "co-lead manager." William Blair & Co, SunTrust Robinson Humphrey, and Janney Montgomery Scott were co-managers (see here). Numerous high-ranked leaders have taken advantage of investment bankers' eagerness to raise capital for publicly traded companies, and it is admirable to see these large financial institutions actually underwriting deals that raise money for those in need other than themselves. Investors have reasons to be a bit cynical and skeptical, especially when companies that are generating record revenue and earnings are "in need" of additional working capital. But don't let that scare you, simply rely upon the price volume action to let you know what direction the institutional holders are rushing. Thus far, this leader has been finding great support from the institutional crowd.
Often times, new share offerings can hinder the upward price progress in companies for the near term. Do not be confused by the 3:2 stock split effective 6/09/09. That also had the effect of increasing the number of GMCR shares. the supply (the S criteria) of outstanding shares now sits at 42.7 million shares, up from 24.6 million shares at the beginning of the year when it was featured in the January 2009 issue of CANSLIM.net News. That is a +73.5% increase in total shares outstanding! GMCR has traded as much as +176.28% since appearing with an annotated graph under the headline "It May Soon Be Time To Go Green" in the January 2009 CANSLIM.net News (read here).
Greater than usual volume and volatility are common around earnings news, and this earnings season has offered up numerous examples of shakeouts and some ugly technical failures. [On Tuesday an earnings announcement is coming from Longtop Financl Tech Ads (LFT).] GMCR positively reversed on July 30th and rallied to new highs after initially gapping down following another strong financial report for the latest quarter ended June 30, 2009. It had held its ground stubbornly since July 20th, when its rally above its latest pivot point to a new all-time high with three times average volume triggered a technical buy signal. Using the "view all notes" link, one can see that from July 17-22 it was color coded yellow (Y- at the front of the notes) after the latest pivot point was identified. Its color code was changed to green after it rose more than +5% above its pivot point, indicating that it was getting extended from an ideal entry point within the investment system's guidelines.
|
|
|
Color Codes Explained :
Y - Better candidates highlighted by our
staff of experts.
G - Previously featured
in past reports as yellow but may no longer be buyable under the
guidelines.
***Last / Change / Volume quote data in this table corresponds with the timestamp on the note***
Symbol/Exchange
Company Name
Industry Group |
Last |
Chg. |
Vol
% DAV |
Date Featured |
Price Featured |
Latest Pivot Point
Featured |
Status |
| Latest Max Buy Price |
ASIA
-
|
$16.96
|
-0.60
|
403,730
52% DAV
779,700
|
8/2/2009
(Date
Featured) |
$19.27
(Price
Featured) |
PP = $22.19 |
G |
| MB = $23.30 |
Most Recent Note - 8/14/2009 4:03:03 PM
G - Struggling under its 50 DMA line which is now downward sloping, and prior lows in the $15 area are the next chart support level. It has not followed through with additional gains on volume, and instead, totally negated its big 7/30/09 gap up gain on heavy volume. Color code was changed to green, and it would need to rally above its recent highs in the $20 area for its outlook to improve. Recently featured in the August 2009 CANSLIM.net News here
There are no Featured Stock Updates™ available for this stock at this time. You may request one by clicking here
|
|
C
A
S
I |
News |
Chart |
SEC
View all notes Alert
me of new notes
Company
Profile
|
CPLA
- NASDAQ
Capella Education Co
DIVERSIFIED SERVICES - Education and Training Services
|
$64.44
|
+0.77
|
142,204
68% DAV
207,900
|
7/9/2009
(Date
Featured) |
$59.69
(Price
Featured) |
PP = $62.06 |
Y |
| MB = $65.16 |
Most Recent Note - 8/14/2009 4:03:50 PM
Y - Quietly hovering just -1% off its 52-week high, still above its pivot point. Featured in yellow in the 7/09/09 Mid-Day BreakOuts Report (read here). The Commercial Services-Schools Group has shown some leadership but has low ranks, and CPLA's Relative Strength rank has slumped to 66, under the 80+ guideline. Its small supply of only 13.9 million shares in the float could contribute to greater price volatility in the event of institutional accumulation or distribution. The number of top-rated funds owning an interest rose from 91 in Sept '08, to 133 as of March '09, which is reassuring with respect to the I criteria. It has a very good earnings history that satisfies the C & A criteria, while recent quarters showed steady sales revenues increases in the +17-18% range.
>>> The latest Featured Stock Update with an annotated graph appeared on 8/6/2009. click here.
|
|
C
A
S
I |
News |
Chart |
SEC
View all notes Alert
me of new notes
Company
Profile
|
GMCR
- NASDAQ
Green Mtn Coffee Roastrs
FOOD & BEVERAGE - Processed & Packaged Goods
|
$63.10
|
-1.63
|
1,287,798
81% DAV
1,588,400
|
7/17/2009
(Date
Featured) |
$60.15
(Price
Featured) |
PP = $63.79 |
G |
| MB = $66.98 |
Most Recent Note - 8/14/2009 4:04:10 PM
G - Today was its 5th consecutive loss on below average volume, consolidating toward its 50 DMA line since offering 5 million common shares. Prior highs in the $62-63 area are initial chart support to watch above its 50 DMA line. Do not be confused by the 3:2 stock split effective 6/09/09. GMCR traded up more than +168% since appearing with an annotated graph under the headline "It May Soon Be Time To Go Green" when featured in the January 2009 CANSLIM.net News (read here).
>>> The latest Featured Stock Update with an annotated graph appeared on 8/14/2009. click here.
|
|
C
A
S
I |
News |
Chart |
SEC
View all notes Alert
me of new notes
Company
Profile
|
LFT
-
|
$29.65
|
-1.38
|
655,644
83% DAV
790,600
|
8/10/2009
(Date
Featured) |
$31.49
(Price
Featured) |
PP = $30.57 |
Y |
| MB = $32.10 |
Most Recent Note - 8/14/2009 4:05:22 PM
Y - Loss today on below average volume, slumping under its pivot point after gains earlier this week with above average volume helped it rally above its new pivot point - see the latest FSU analysis from 8/12/09.
>>> The latest Featured Stock Update with an annotated graph appeared on 8/12/2009. click here.
|
|
C
A
S
I |
News |
Chart |
SEC
View all notes Alert
me of new notes
Company
Profile
|
NTES
- NASDAQ
Netease Inc Adr
INTERNET - Internet Information Providers
|
$41.56
|
-0.28
|
3,038,049
126% DAV
2,403,700
|
7/17/2009
(Date
Featured) |
$39.29
(Price
Featured) |
PP = $38.74 |
G |
| MB = $40.68 |
Most Recent Note - 8/14/2009 4:05:48 PM
G - Held its ground today after a 8/13/09 gap down for a considerable loss on nearly 4 times average volume, triggering a technical sell signal. Results for the quarter ended June 30, 2009 showed a big earnings per share increase, but sales revenues were reported at -1% versus the year ago period, continuing its pattern of worrisome sequential deceleration in sales revenues increases from +79%, +59%, +42% in the Jun, Sep, Dec '08 comparisons and +24% in Mar '09. The nearest chart support is at its pivot point, 50 DMA line, and prior chart highs, all of which are in the $39 area. First featured at $26.75 in the 3/31/09 CANSLIM.net Mid-Day Breakouts Report (read here).
>>> The latest Featured Stock Update with an annotated graph appeared on 8/13/2009. click here.
|
|
C
A
S
I |
News |
Chart |
SEC
View all notes Alert
me of new notes
Company
Profile
|
NVEC
- NASDAQ
N V E Corp
ELECTRONICS - Semiconductor - Specialized
|
$52.76
|
-1.48
|
43,237
45% DAV
96,000
|
3/13/2009
(Date
Featured) |
$33.85
(Price
Featured) |
PP = $49.60 |
G |
| MB = $52.08 |
Most Recent Note - 8/14/2009 4:06:08 PM
G - Volume has been drying up while consolidating above prior chart highs that are now an important support level above its 50 DMA line. Deterioration under its prior chart high ($49.50) would raise concerns. Featured in the 7/23/09 Mid-Day BreakOuts Report (read here) after it gapped up for a considerable gain on heavy volume following news of stronger sales revenues (+41%) and solid earnings increases for the quarter ended June 30, 2009. The technical action was described as a "breakaway gap" from a valid ascending base. Quarterly sales revenues in the 6 million dollar range are still rather minuscule, leaving concerns.
>>> The latest Featured Stock Update with an annotated graph appeared on 8/3/2009. click here.
|
|
C
A
S
I |
News |
Chart |
SEC
View all notes Alert
me of new notes
Company
Profile
|
PEGA
- NASDAQ
Pegasystems Inc
COMPUTER SOFTWARE & SERVICES - Business Software & Services
|
$29.39
|
-1.09
|
247,750
84% DAV
296,300
|
7/29/2009
(Date
Featured) |
$27.53
(Price
Featured) |
PP = $27.49 |
G |
| MB = $28.86 |
Most Recent Note - 8/14/2009 4:06:26 PM
G - Loss today on below average volume, pulling back toward prior chart highs, but still above its "max buy" level. Previous resistance in the mid-$27 area is an important technical support level to watch above its 50 DMA line. Considerable 8/05/09 gain with nearly 5 times average volume followed strong Q2 earnings and raised guidance. The high-ranked software firm triggered a technical buy signal when rising from the "double bottom" base when it was featured in the 7/29/09 mid-day report (read here).
>>> The latest Featured Stock Update with an annotated graph appeared on 8/11/2009. click here.
|
|
C
A
S
I |
News |
Chart |
SEC
View all notes Alert
me of new notes
Company
Profile
|
UTA
-
|
$13.46
|
+0.20
|
656,103
122% DAV
537,500
|
7/28/2009
(Date
Featured) |
$12.87
(Price
Featured) |
PP = $12.70 |
G |
| MB = $13.34 |
Most Recent Note - 8/14/2009 4:07:31 PM
G - Held its ground today after a negative reversal on 8/13/09 for a loss on very heavy volume, a clear sign of worrisome distributional pressure. Wider intra-day swings of late were noted as a sign of uncertainty raising concerns while it is consolidating above prior chart highs that were previously noted as "an important support level to watch on pullbacks." Strong action prompted it to be featured in yellow with pivot point and max buy levels noted in the 7/28/09 mid-day breakouts report (read here), with additional analysis included in the after market update (read here). This Chinese provider of airline tickets and travel related services gapped up on 7/28/09, rising from a choppy 6-week base with a considerable gain on very heavy volume.
>>> The latest Featured Stock Update with an annotated graph appeared on 8/7/2009. click here.
|
|
C
A
S
I |
News |
Chart |
SEC
View all notes Alert
me of new notes
Company
Profile
|
|
|
|
THESE ARE NOT BUY RECOMMENDATIONS!
Comments contained in the body of this report are technical
opinions only. The material herein has been obtained
from sources believed to be reliable and accurate, however,
its accuracy and completeness cannot be guaranteed.
This site is not an investment advisor, hence it does
not endorse or recommend any securities or other investments.
Any recommendation contained in this report may not
be suitable for all investors and it is not to be deemed
an offer or solicitation on our part with respect to
the purchase or sale of any securities. All trademarks,
service marks and trade names appearing in this report
are the property of their respective owners, and are
likewise used for identification purposes only.
This report is a service available
only to active Paid Premium Members.
You may opt-out of receiving report notifications
at any time. Questions or comments may be submitted
by writing to Premium Membership Services 665 S.E. 10 Street, Suite 201 Deerfield Beach, FL 33441-5634 or by calling 1-800-965-8307
or 954-785-1121.
|
|
|


