You are not logged in.
This means you
CAN ONLY VIEW reports that were published prior to Monday, April 14, 2025.
You
MUST UPGRADE YOUR MEMBERSHIP if you want to see any current reports.
AFTER MARKET UPDATE - TUESDAY, AUGUST 13TH, 2013
Previous After Market Report Next After Market Report >>>
|
|
|
|
DOW |
+31.33 |
15,451.01 |
+0.20% |
|
Volume |
618,610,190 |
+6% |
|
Volume |
1,581,723,710 |
+16% |
|
NASDAQ |
+14.49 |
3,684.44 |
+0.39% |
|
Advancers |
1,241 |
40% |
|
Advancers |
1,251 |
48% |
|
S&P 500 |
+4.69 |
1,694.16 |
+0.28% |
|
Decliners |
1,801 |
57% |
|
Decliners |
1,275 |
49% |
|
Russell 2000 |
-1.68 |
1,051.99 |
-0.16% |
|
52 Wk Highs |
134 |
|
|
52 Wk Highs |
127 |
|
|
S&P 600 |
-0.16 |
594.97 |
-0.03% |
|
52 Wk Lows |
191 |
|
|
52 Wk Lows |
29 |
|
|
 |
Major Averages Erased Early Losses To Post Small Gains
Kenneth J. Gruneisen - Passed the CAN SLIM® Master's Exam
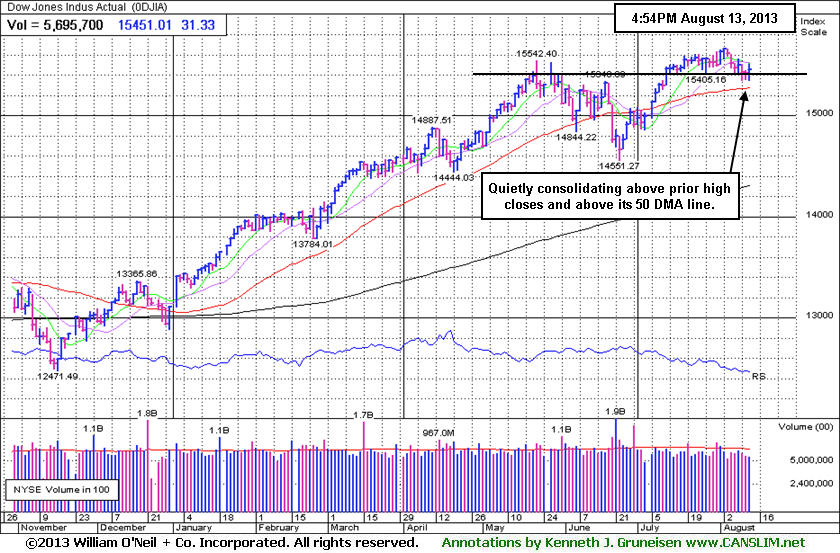
The major averages avoided losing ground for the third-straight session, finishing Tuesday's session with small gains after spending the morning trading in the red. The volume totals were reported higher than the prior session totals on the Nasdaq exchange and on the NYSE. Breadth was negative as decliners led advancers by a 3-2 margin on the NYSE while the mix was near even on the Nasdaq exchange. There were 62 high-ranked companies from the CANSLIM.net Leaders List made new 52-week highs and appeared on the CANSLIM.net BreakOuts Page, up from the prior session total of 42 stocks. The list of stocks hitting new 52-week highs expanded and easily outnumbered new 52-week lows on the Nasdaq exchange, however on the NYSE the new lows total swelled and outnumbered new highs. There were gains for 11 of the 18 high-ranked companies currently included on the Featured Stocks Page. The market (M criteria) endured a number of distributional sessions in recent weeks which put the current rally under pressure. For any rally to be sustained it is absolutely crucial to have a healthy crop of new leaders, so it is most favorable for the list of stocks hitting new highs and appearing on the BreakOuts Page to continue including many companies. As always, individual holdings should be closely monitored for any worrisome technical sell signals.
A batch of weak economic data included Retail Sales up by just +0.2% in July, missing analyst estimates for a gain of +0.3%. Business inventories also failed to top expectations as stockpiles were little changed in June. A separate report showed the cost of goods imported into the U.S. increased by a less than anticipated +0.2% last month.
Stocks rebounded following comments from out of the Fed. Regional president Lockhart said recent economic performance is too mixed for the central bank to begin tapering its bond-buying program in September.
Eight of the 10 S&P 500 sectors finished higher. Technology was the best performing group as Apple Inc (AAPL +4.75%) rose after activist investor Carl Icahn revealed a "large position" in the company. Financials also paced the advance as Citigroup Inc (C +1.71%) . The more defensive Telecommunications and Utilities sectors lagged behind with Verizon Communications Inc (VZ -1.01%) and Exelon Corp (EXC -1.07%) ending with small losses.
In fixed-income, Treasuries finished lower for a second day. The 10-year note was down 25/32 to yield 2.71% and the 30-year bond lost over a full point to yield 3.76%.
Stay familiar with companies listed on the CANSLIM.net Featured Stocks Page - a page showing the most action-worthy candidates' latest notes and links to additional resources including detailed analysis with data-packed graphs which are annotated by a Certified expert. The Premium Member Homepage - includes "dynamic archives" to all prior pay reports published. Watch for an announcement via email concerning the next WEBCAST.
PICTURED: The Dow Jones Industrial Average has been consolidating near all-time highs, remaining perched above prior highs and above its 50-day moving average (DMA).
|
 Kenneth J. Gruneisen started out as a licensed stockbroker in August 1987, a couple of months prior to the historic stock market crash that took the Dow Jones Industrial Average down -22.6% in a single day. He has published daily fact-based fundamental and technical analysis on high-ranked stocks online for two decades. Through FACTBASEDINVESTING.COM, Kenneth provides educational articles, news, market commentary, and other information regarding proven investment systems that work in good times and bad.
Comments contained in the body of this report are technical opinions only and are not necessarily those of Gruneisen Growth Corp. The material herein has been obtained from sources believed to be reliable and accurate, however, its accuracy and completeness cannot be guaranteed. Our firm, employees, and customers may effect transactions, including transactions contrary to any recommendation herein, or have positions in the securities mentioned herein or options with respect thereto. Any recommendation contained in this report may not be suitable for all investors and it is not to be deemed an offer or solicitation on our part with respect to the purchase or sale of any securities. |
|
 |
Internet Index Trades Into New High Territory
Kenneth J. Gruneisen - Passed the CAN SLIM® Master's Exam
Financial stocks were a positive influence on the major averages as the Broker/Dealer Index ($XBD +1.20%) rose and the Bank Index ($BKX +0.31%) followed with a smaller gain. The Gold & Silver Index ($XAU -2.38%) pulled back and was among the biggest of group decliners on Tuesday following its 3-day +15.6% sprint noted in yesterday's Industry Group Watch section (read here). Gains in the tech sector were led by the Networking Index ($NWX +1.10%) and the Semiconductor Index ($SOX +1.15%) while the Internet Index ($IIX +0.43%) posted a smaller gain and the Biotechnology Index ($BTK -0.39%) edged lower. Energy-related shares had a slightly positive bias as the Integrated Oil Index ($XOI +0.26%) and the Oil Services Index ($OSX +0.36%) edged higher. The Retail Index ($RLX +0.11%) and Healthcare Index ($HMO +0.19%) inched higher.
Charts courtesy www.stockcharts.com
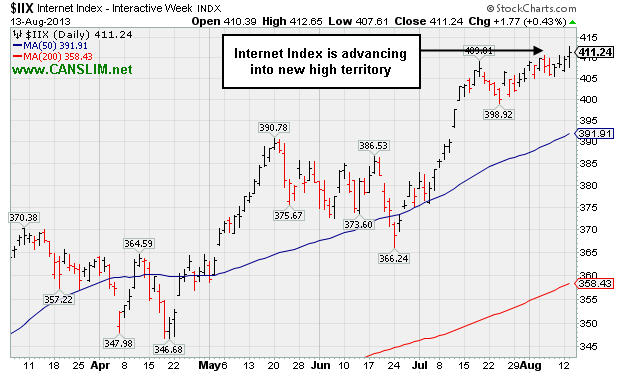
PICTURED: The Internet Index ($IIX +0.43%) is currently advancing into new high territory. Leadership in the group (L criteria) bodes well for companies in that group and hints that investors odds are favorable in that area of the market. At the present time, 4 of the 18 stocks included on the Featured Stocks page are hailing from the Internet group.
| Oil Services |
$OSX |
264.21 |
+0.95 |
+0.36% |
+20.01% |
| Healthcare |
$HMO |
3,424.81 |
+6.44 |
+0.19% |
+36.22% |
| Integrated Oil |
$XOI |
1,376.63 |
+3.56 |
+0.26% |
+10.86% |
| Semiconductor |
$SOX |
479.07 |
+5.45 |
+1.15% |
+24.74% |
| Networking |
$NWX |
298.52 |
+3.24 |
+1.10% |
+31.77% |
| Internet |
$IIX |
411.24 |
+1.77 |
+0.43% |
+25.76% |
| Broker/Dealer |
$XBD |
135.59 |
+1.60 |
+1.20% |
+43.74% |
| Retail |
$RLX |
844.63 |
+0.92 |
+0.11% |
+29.33% |
| Gold & Silver |
$XAU |
100.29 |
-2.44 |
-2.38% |
-39.44% |
| Bank |
$BKX |
65.36 |
+0.20 |
+0.31% |
+27.46% |
| Biotech |
$BTK |
2,074.29 |
-8.16 |
-0.39% |
+34.08% |
|
|
|
 |
50-Day Moving Average Recently Acted As Resistance
Kenneth J. Gruneisen - Passed the CAN SLIM® Master's Exam
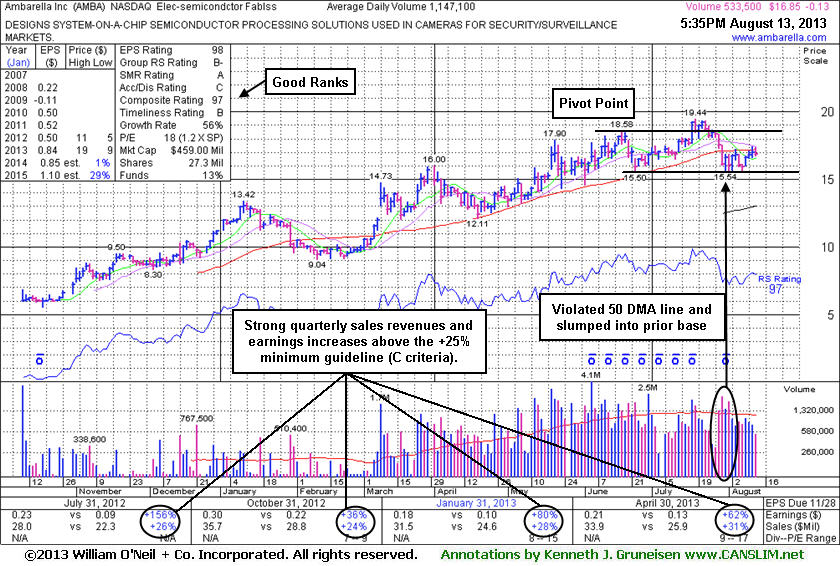
Ambarella Corporation (AMBA -$0.13 or -0.77% to $16.85) has been encountering resistance at its 50-day moving average (DMA) line. A technical violation triggered a sell signal on 7/30/13 as it completely negated the latest breakout and slumped back into its prior base. A prompt rebound above that important short-term average would help its outlook improve. The stock made limited headway after last shown in this FSU section on 7/17/13 with an annotated graph under the headline, "Technical Breakout Backed By +65% Above Average", when breaking out from a short "square box" base pattern. That summary contrasted the stock's +27.9% gain in under 5 months time, with the S&P 500 Index's +17.8% year-to-date gain, a vivid example of the potential advantages investors may gain when carefully selecting individual stocks using the fact-based investment system.
AMBA closed today's session still well above $15.04 as it was priced when first shown in this FSU section under the headline, "Volume-Driven Gain From Cup-With-High-Handle to New 52-Week High - Tuesday, March 26, 2013 ". While it may go on to form a sound new base pattern, for now its consolidation has been too brief. Keep in mind that any stock that is sold can always be bought again if strength returns. Disciplined investors do not make excuses for any stock that falls more than -7% from their purchase price. Investors could have better odds by pouncing on another stock staging a fresh and powerful technical breakout, rather than holding on to any lagging stock trading below its 50 DMA line. The longer a stock remains trading below its 50 DMA line the worse its outlook gets, and it may meanwhile be prone to an even deeper consolidation.
The high-ranked Electronics - Semiconductor firm recently reported strong earnings and revenues increases for the April '13 quarter, continuing its streak of strong quarterly earnings comparisons versus the year ago periods - satisfying the C criteria with increases above the +25% minimum guideline. The number of top-rated funds owning its shares rise from 51 in Dec '12 to 78 in Jun '13, a reassuring indication concerning the I criteria. Its current Up/Down Volume Ratio of 1.2 is also an unbiased indication that its shares have been under slight accumulation over the past 50 days. Its small supply (S criteria) of only 13.9 million shares in the public float can contribute to great price volatility in the event of institutional buying or selling. It has been a while since the stock flashed any signs of heavy institutional buying demand.
|
|
|
Color Codes Explained :
Y - Better candidates highlighted by our
staff of experts.
G - Previously featured
in past reports as yellow but may no longer be buyable under the
guidelines.
***Last / Change / Volume data in this table is the closing quote data***
Symbol/Exchange
Company Name
Industry Group |
PRICE |
CHANGE
(%Change) |
Day High |
Volume
(% DAV)
(% 50 day avg vol) |
52 Wk Hi
% From Hi |
Featured
Date |
Price
Featured |
Pivot Featured |
|
Max Buy |
AMBA
-
NASDAQ
Ambarella Inc
ELECTRONICS - Semiconductor - Specialized
|
$16.85
|
-0.13
-0.77% |
$17.36
|
533,741
46.53% of 50 DAV
50 DAV is 1,147,100
|
$19.44
-13.32%
|
7/15/2013
|
$17.87
|
PP = $18.68
|
|
MB = $19.61
|
 Most Recent Note - 8/13/2013 6:39:28 PM
G - Its 50 DMA line has acted as resistance following the technical violation which triggered a sell signal on 7/30/13. See the latest FSU analysis for more details and a new annotated graph.
>>> The latest Featured Stock Update with an annotated graph appeared on 8/13/2013. Click here.
View all notes |
Alert me of new notes |
CANSLIM.net Company Profile |
SEC |
Zacks Reports |
StockTalk |
News |
Chart |
Request a new note
C
A N
S L
I M


|
BITA
-
NYSE
Bitauto Hldgs Ltd Ads
INTERNET - Internet Information Providers
|
$16.00
|
-0.24
-1.48% |
$16.20
|
330,470
198.24% of 50 DAV
50 DAV is 166,700
|
$18.10
-11.60%
|
8/7/2013
|
$12.01
|
PP = $13.30
|
|
MB = $13.97
|
Most Recent Note - 8/13/2013 6:41:09 PM
G - Holding its ground stubbornly after 2 consecutive big volume-driven gains for new highs. Prior highs in the $13 area define initial support to watch on pullbacks. The 8/07/13 After Market Update included more details and a new annotated graph under the headline "Found Prompt Support After Undercutting 50-Day Average".
>>> The latest Featured Stock Update with an annotated graph appeared on 8/7/2013. Click here.
View all notes |
Alert me of new notes |
CANSLIM.net Company Profile |
SEC |
Zacks Reports |
StockTalk |
News |
Chart |
Request a new note
C
A N
S L
I M
|
CELG
-
NASDAQ
Celgene Corp
DRUGS - Drug Manufacturers - Major
|
$137.65
|
-3.18
-2.26% |
$141.20
|
2,919,861
105.51% of 50 DAV
50 DAV is 2,767,500
|
$149.92
-8.18%
|
7/11/2013
|
$133.25
|
PP = $131.92
|
|
MB = $138.52
|
Most Recent Note - 8/13/2013 6:43:38 PM
Y - Color code is changed to yellow after retreating below its "max buy" level with a loss today on average volume. Prior highs in the $131 area define initial chart support above its 50 DMA line.
>>> The latest Featured Stock Update with an annotated graph appeared on 7/29/2013. Click here.
View all notes |
Alert me of new notes |
CANSLIM.net Company Profile |
SEC |
Zacks Reports |
StockTalk |
News |
Chart |
Request a new note
C
A N
S L
I M
|
FLT
-
NYSE
Fleetcor Technologies
DIVERSIFIED SERVICES - Business/Management Services
|
$97.45
|
+0.20
0.21% |
$97.65
|
738,829
107.61% of 50 DAV
50 DAV is 686,600
|
$100.87
-3.39%
|
5/29/2013
|
$86.02
|
PP = $85.66
|
|
MB = $89.94
|
Most Recent Note - 8/12/2013 6:07:52 PM
G- Holding its ground stubbornly, extended from any sound base and perched at all-time highs. Volume totals have been cooling after spiking higher with gains backed by above average volume. See latest FSU analysis for more details and a new annotated graph.
>>> The latest Featured Stock Update with an annotated graph appeared on 8/12/2013. Click here.
View all notes |
Alert me of new notes |
CANSLIM.net Company Profile |
SEC |
Zacks Reports |
StockTalk |
News |
Chart |
Request a new note
C
A N
S L
I M
|
GNRC
-
NYSE
Generac Hldgs Inc
CONSUMER DURABLES - Electronic Equipment
|
$42.69
|
+0.04
0.09% |
$42.74
|
342,153
29.29% of 50 DAV
50 DAV is 1,168,200
|
$44.30
-3.63%
|
7/30/2013
|
$42.60
|
PP = $42.10
|
|
MB = $44.21
|
Most Recent Note - 8/8/2013 5:21:29 PM
Y - Holding its ground since gapping down on 8/02/13 after pricing a Secondary Offering. It recently rallied from an advanced "3-weeks tight" base. Disciplined investors always limit losses by selling if any stock falls more than -7% from its purchase price.
>>> The latest Featured Stock Update with an annotated graph appeared on 7/30/2013. Click here.
View all notes |
Alert me of new notes |
CANSLIM.net Company Profile |
SEC |
Zacks Reports |
StockTalk |
News |
Chart |
Request a new note
C
A N
S L
I M
|
Symbol/Exchange
Company Name
Industry Group |
PRICE |
CHANGE
(%Change) |
Day High |
Volume
(% DAV)
(% 50 day avg vol) |
52 Wk Hi
% From Hi |
Featured
Date |
Price
Featured |
Pivot Featured |
|
Max Buy |
KORS
-
NYSE
Michael Kors Hldgs Ltd
RETAIL - Apparel Stores
|
$72.40
|
+0.40
0.56% |
$72.98
|
2,292,791
63.56% of 50 DAV
50 DAV is 3,607,200
|
$72.53
-0.18%
|
8/6/2013
|
$69.66
|
PP = $66.28
|
|
MB = $69.59
|
Most Recent Note - 8/8/2013 5:24:09 PM
G - Posted a gain with above average volume getting extended beyond its "max buy" level, and its color code is changed to green. Relative Strength rating improved to 83, above the 80+ minimum guideline for buy candidates.
>>> The latest Featured Stock Update with an annotated graph appeared on 8/6/2013. Click here.
View all notes |
Alert me of new notes |
CANSLIM.net Company Profile |
SEC |
Zacks Reports |
StockTalk |
News |
Chart |
Request a new note
C
A N
S L
I M
|
LOPE
-
NASDAQ
Grand Canyon Education
DIVERSIFIED SERVICES - Education and; Training Services
|
$34.92
|
+0.12
0.34% |
$35.09
|
252,455
56.46% of 50 DAV
50 DAV is 447,100
|
$37.17
-6.05%
|
6/19/2013
|
$31.47
|
PP = $34.17
|
|
MB = $35.88
|
Most Recent Note - 8/8/2013 5:26:10 PM
Y - Reported earnings +15% on +19% sales for the Jun '13 quarter, below the +25% minimum earnings guideline (C criteria), raising fundamental concerns. Consolidating below its "max buy" level. Prior highs in the $34 area define support along with its 50 DMA line.
>>> The latest Featured Stock Update with an annotated graph appeared on 7/19/2013. Click here.
View all notes |
Alert me of new notes |
CANSLIM.net Company Profile |
SEC |
Zacks Reports |
StockTalk |
News |
Chart |
Request a new note
C
A N
S L
I M
|
PCLN
-
NASDAQ
Priceline.Com Inc
INTERNET - Internet Software and Services
|
$953.61
|
-4.41
-0.46% |
$963.37
|
670,484
95.65% of 50 DAV
50 DAV is 701,000
|
$994.98
-4.16%
|
7/8/2013
|
$878.28
|
PP = $847.43
|
|
MB = $889.80
|
Most Recent Note - 8/9/2013 12:59:35 PM
G - Challenged the $1,000 threshold after it gapped up for a considerable gain and new 52-week high, getting more extended from any sound base. Reported earnings +24% on +27% sales revenues for the Jun '13 quarter, just under the +25% minimum earnings guideline (C criteria).
>>> The latest Featured Stock Update with an annotated graph appeared on 7/25/2013. Click here.
View all notes |
Alert me of new notes |
CANSLIM.net Company Profile |
SEC |
Zacks Reports |
StockTalk |
News |
Chart |
Request a new note
C
A N
S L
I M
|
PRAA
-
NASDAQ
Portfolio Recovery Assoc
DIVERSIFIED SERVICES - Business/Management Services
|
$56.88
|
+2.35
4.31% |
$57.57
|
1,090,097
229.88% of 50 DAV
50 DAV is 474,200
|
$54.62
4.13%
|
7/31/2013
|
$51.43
|
PP = $54.72
|
|
MB = $57.46
|
Most Recent Note - 8/13/2013 1:01:14 PM
Y - Rising above its pivot point with today's solid gain backed by above average volume. A strong finish above the pivot point with at least +40% above average volume may clinch a technical buy signal.
>>> The latest Featured Stock Update with an annotated graph appeared on 8/2/2013. Click here.
View all notes |
Alert me of new notes |
CANSLIM.net Company Profile |
SEC |
Zacks Reports |
StockTalk |
News |
Chart |
Request a new note
C
A N
S L
I M
|
PRLB
-
NYSE
Proto Labs Inc
MANUFACTURING - Small Tools and Accessories
|
$68.43
|
+0.27
0.40% |
$69.69
|
352,627
71.34% of 50 DAV
50 DAV is 494,300
|
$72.08
-5.06%
|
7/29/2013
|
$64.86
|
PP = $67.50
|
|
MB = $70.88
|
Most Recent Note - 8/12/2013 6:12:02 PM
Y - Tallied a 3rd consecutive gain with below or near average volume since again testing support near its 50 DMA line and prior lows when encountering distributional pressure. Disciplined investors always limit losses if any stock falls more than -7% from their purchase price.
>>> The latest Featured Stock Update with an annotated graph appeared on 8/5/2013. Click here.
View all notes |
Alert me of new notes |
CANSLIM.net Company Profile |
SEC |
Zacks Reports |
StockTalk |
News |
Chart |
Request a new note
C
A N
S L
I M
|
Symbol/Exchange
Company Name
Industry Group |
PRICE |
CHANGE
(%Change) |
Day High |
Volume
(% DAV)
(% 50 day avg vol) |
52 Wk Hi
% From Hi |
Featured
Date |
Price
Featured |
Pivot Featured |
|
Max Buy |
QCOR
-
NASDAQ
Questcor Pharmaceuticals
DRUGS - Biotechnology
|
$69.05
|
+2.91
4.40% |
$69.33
|
1,932,416
92.53% of 50 DAV
50 DAV is 2,088,400
|
$70.55
-2.13%
|
7/31/2013
|
$66.46
|
PP = $59.01
|
|
MB = $61.96
|
Most Recent Note - 8/13/2013 7:04:51 PM
G - Rallied to its second-best close today following a brief consolidation. Quickly got extended beyond its "max buy" level after highlighted in yellow in the 7/31/13 mid-day report (read here) with a weekly graph which illustrated its powerful long-term breakout to new highs.
>>> The latest Featured Stock Update with an annotated graph appeared on 8/1/2013. Click here.
View all notes |
Alert me of new notes |
CANSLIM.net Company Profile |
SEC |
Zacks Reports |
StockTalk |
News |
Chart |
Request a new note
C
A N
S L
I M
|
RRTS
-
NYSE
Roadrunner Trans Systems
TRANSPORTATION - Air Delivery and Freight Service
|
$27.89
|
-1.82
-6.13% |
$29.37
|
334,982
249.99% of 50 DAV
50 DAV is 134,000
|
$30.98
-9.99%
|
4/3/2013
|
$22.77
|
PP = $23.75
|
|
MB = $24.94
|
Most Recent Note - 8/13/2013 6:48:58 PM
Violated its 50 DMA line with today's damaging loss on above average volume triggering a technical sell signal. A prompt rebound above that short-term average would help its outlook improve. The weak action came as it announced a Public Offering of 3.5 million shares of common stock (2 million by selling stockholders). Based on weakness and previously noted fundamental concerns it will be dropped from the featured stocks list tonight.
>>> The latest Featured Stock Update with an annotated graph appeared on 7/22/2013. Click here.
View all notes |
Alert me of new notes |
CANSLIM.net Company Profile |
SEC |
Zacks Reports |
StockTalk |
News |
Chart |
Request a new note
C
A N
S L
I M
|
SFUN
-
NYSE
Soufun Hldgs Ltd Ads A
INTERNET - Internet Information Providers
|
$41.00
|
+2.50
6.49% |
$41.49
|
1,592,625
393.53% of 50 DAV
50 DAV is 404,700
|
$39.98
2.55%
|
7/16/2013
|
$29.54
|
PP = $27.90
|
|
MB = $29.30
|
Most Recent Note - 8/13/2013 1:02:27 PM
G - Rallying again today with above average volume and poised for a best-ever close. It is very extended from its latest base after another considerable volume-driven gain. Disciplined investors avoid chasing stocks too extended from sound bases.
>>> The latest Featured Stock Update with an annotated graph appeared on 8/8/2013. Click here.
View all notes |
Alert me of new notes |
CANSLIM.net Company Profile |
SEC |
Zacks Reports |
StockTalk |
News |
Chart |
Request a new note
C
A N
S L
I M
|
SSNC
-
NASDAQ
S S & C Technologies
COMPUTER SOFTWARE and SERVICES - Application Software
|
$35.61
|
+0.01
0.03% |
$35.75
|
177,051
41.62% of 50 DAV
50 DAV is 425,400
|
$38.80
-8.22%
|
7/11/2013
|
$35.80
|
PP = $34.54
|
|
MB = $36.27
|
Most Recent Note - 8/9/2013 5:21:29 PM
Y - Found prompt support after undercutting its 50 DMA line and prior highs in the $34 area. Disciplined investors always limit losses if ever any stock falls more than -7% from their purchase price. See the latest FSU analysis for more details and a new annotated graph.
>>> The latest Featured Stock Update with an annotated graph appeared on 8/9/2013. Click here.
View all notes |
Alert me of new notes |
CANSLIM.net Company Profile |
SEC |
Zacks Reports |
StockTalk |
News |
Chart |
Request a new note
C
A N
S L
I M
|
SSYS
-
NASDAQ
Stratasys Ltd
COMPUTER HARDWARE - Computer Peripherals
|
$102.44
|
-0.67
-0.65% |
$104.34
|
1,014,183
120.31% of 50 DAV
50 DAV is 843,000
|
$99.50
2.95%
|
7/8/2013
|
$91.44
|
PP = $95.00
|
|
MB = $99.75
|
Most Recent Note - 8/13/2013 1:05:00 PM
G - Touched another new 52-week high today. It has rallied beyond its "max buy" level and prior highs in the $86 area define support to watch on pullbacks. Its Relative Strength Rating has improved to 86, above the 80+ minimum guideline for buy candidates under the fact-based investment system.
>>> The latest Featured Stock Update with an annotated graph appeared on 7/24/2013. Click here.
View all notes |
Alert me of new notes |
CANSLIM.net Company Profile |
SEC |
Zacks Reports |
StockTalk |
News |
Chart |
Request a new note
C
A N
S L
I M
|
Symbol/Exchange
Company Name
Industry Group |
PRICE |
CHANGE
(%Change) |
Day High |
Volume
(% DAV)
(% 50 day avg vol) |
52 Wk Hi
% From Hi |
Featured
Date |
Price
Featured |
Pivot Featured |
|
Max Buy |
STMP
-
NASDAQ
Stamps.Com Inc
INTERNET - Internet Software and Services
|
$40.37
|
-0.12
-0.30% |
$40.98
|
112,032
78.78% of 50 DAV
50 DAV is 142,200
|
$46.47
-13.13%
|
7/31/2013
|
$40.00
|
PP = $42.98
|
|
MB = $45.13
|
Most Recent Note - 8/13/2013 6:53:00 PM
Y - Found support at its 50 DMA line again after a recent bout of distributional pressure. Disciplined investors always limit losses if any stock falls more than -7% from their purchase price. Any stock which is sold can be bought again later if strength returns.
>>> The latest Featured Stock Update with an annotated graph appeared on 7/31/2013. Click here.
View all notes |
Alert me of new notes |
CANSLIM.net Company Profile |
SEC |
Zacks Reports |
StockTalk |
News |
Chart |
Request a new note
C
A N
S L
I M
|
VRX
-
NYSE
Valeant Pharmaceuticals
DRUGS - Drug Manufacturers - Other
|
$103.98
|
+2.03
1.99% |
$104.00
|
1,649,935
102.31% of 50 DAV
50 DAV is 1,612,700
|
$102.54
1.40%
|
4/30/2013
|
$60.24
|
PP = $76.66
|
|
MB = $80.49
|
Most Recent Note - 8/13/2013 6:59:54 PM
G- Rallying into new 52-week high territory with 9 gains in the span of 10 sessions. It is extended from a sound base after "wedging" higher with recent gains lacking great volume conviction while rising from a previously noted cup-with-handle base pattern. Reported earnings +33% on +34% sales revenues for the Jun '13 quarter, above the +25% minimum earnings guideline (C criteria), a strong follow-up to sub par Mar '13 results.
>>> The latest Featured Stock Update with an annotated graph appeared on 7/23/2013. Click here.
View all notes |
Alert me of new notes |
CANSLIM.net Company Profile |
SEC |
Zacks Reports |
StockTalk |
News |
Chart |
Request a new note
C
A N
S L
I M
|
YNDX
-
NASDAQ
Yandex N V Class A
INTERNET - Internet Information Providers
|
$33.20
|
+0.52
1.59% |
$33.56
|
1,326,169
53.92% of 50 DAV
50 DAV is 2,459,500
|
$34.27
-3.12%
|
7/10/2013
|
$29.29
|
PP = $29.59
|
|
MB = $31.07
|
Most Recent Note - 8/13/2013 7:02:38 PM
G - Still holding its ground stubbornly near its 52-week high with volume totals cooling in recent weeks, a sign that few investors have been headed for the exit. Its 50 DMA line coincides with prior highs in the $29 area defining important near-term support to watch.
>>> The latest Featured Stock Update with an annotated graph appeared on 7/26/2013. Click here.
View all notes |
Alert me of new notes |
CANSLIM.net Company Profile |
SEC |
Zacks Reports |
StockTalk |
News |
Chart |
Request a new note
C
A N
S L
I M
|
|
|
|
THESE ARE NOT BUY RECOMMENDATIONS!
Comments contained in the body of this report are technical
opinions only. The material herein has been obtained
from sources believed to be reliable and accurate, however,
its accuracy and completeness cannot be guaranteed.
This site is not an investment advisor, hence it does
not endorse or recommend any securities or other investments.
Any recommendation contained in this report may not
be suitable for all investors and it is not to be deemed
an offer or solicitation on our part with respect to
the purchase or sale of any securities. All trademarks,
service marks and trade names appearing in this report
are the property of their respective owners, and are
likewise used for identification purposes only.
This report is a service available
only to active Paid Premium Members.
You may opt-out of receiving report notifications
at any time. Questions or comments may be submitted
by writing to Premium Membership Services 665 S.E. 10 Street, Suite 201 Deerfield Beach, FL 33441-5634 or by calling 1-800-965-8307
or 954-785-1121.
|
|
|

