You are not logged in.
This means you
CAN ONLY VIEW reports that were published prior to Monday, April 14, 2025.
You
MUST UPGRADE YOUR MEMBERSHIP if you want to see any current reports.
AFTER MARKET UPDATE - THURSDAY, AUGUST 13TH, 2009
Previous After Market Report Next After Market Report >>>
|
|
|
|
DOW |
+36.58 |
9,398.19 |
+0.39% |
|
Volume |
777,233,190 |
-37% |
|
Volume |
2,140,902,440 |
-4% |
|
NASDAQ |
+10.63 |
2,009.35 |
+0.53% |
|
Advancers |
1,995 |
64% |
|
Advancers |
1,501 |
53% |
|
S&P 500 |
+6.92 |
1,012.73 |
+0.69% |
|
Decliners |
1,037 |
33% |
|
Decliners |
1,210 |
43% |
|
Russell 2000 |
+3.02 |
575.19 |
+0.53% |
|
52 Wk Highs |
89 |
|
|
52 Wk Highs |
53 |
|
|
S&P 600 |
+1.08 |
304.76 |
+0.36% |
|
52 Wk Lows |
3 |
|
|
52 Wk Lows |
4 |
|
|
 |
Volume Recedes As Indices Edge Higher
Adam Sarhan, Contributing Writer,
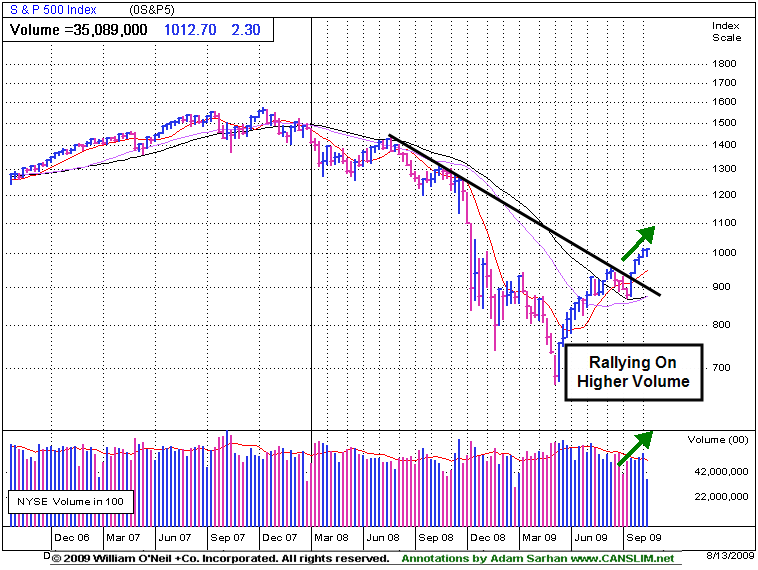
Thursday was a relatively quiet day on Wall Street, yet the major averages posted small gains as investors digested the large price swings from earlier in the week. Volume totals reported on the NYSE and Nasdaq exchange were lower than the prior session totals and below average. Advancers led decliners by nearly a 2-to-1 ratio on the NYSE and by narrower 5-to-4 ratio on the Nasdaq exchange. There were 17 high-ranked companies from the CANSLIM.net Leaders List that made a new 52-week high and appeared on the CANSLIM.net BreakOuts Page, one more than the 16 issues that appeared on the prior session. On both exchanges new 52-week highs still significantly outnumbered 52-week lows, and new lows were in the single digits again.
The market traded back and forth between positive and negative territory for most of the session as stocks digested Tuesday's sharp moved down followed by Wednesday's sharp move higher. Retail giant, Wal-Mart Stores Inc. (WMT +2.71%) jumped above its downward sloping 200-day moving average (DMA) line after it reported a stronger-than-expected earnings report. This helped offset an unexpected slump in retail sales which serves as a strong proxy for the broader economy. On that note, retail sales slid -0.1% in July which was the first decline in three months and below the Street's estimates.
Elsewhere on the economic front, initial jobless claims were also worse than economists expected which weighed on the notion that the US economic recovery is strong. The Labor Department said that the number of Americans filing initial claims for jobless benefits rose to 558,000. Since the recession officially began in December 2007 US employers slashed -6.7 million jobs in an attempt to cut costs and survive this economic contraction.
According to Bloomberg.com, thus far, per-share earnings data for the second quarter has exceeded the average analysts’ estimates by +10% for the 458 companies in the S&P 500 Index that have released results. It is important to note that even though earnings were above estimates they were still down -30% on average in the second quarter, which is a record eighth straight quarter of negative earnings.
Money Management Services - How Can We Help You?
Are you looking for a money manager who follows a proven set of trading rules? If you are frustrated because your broker/money manager does not follow all of the rules of this powerful investment system, contact us. We have veterans who have been in business for over 20 years who pride themselves on their ability to closely follow all the rules of the investment system in both bull and bear markets. You will receive customized solutions for your portfolio and develop a relationship with one of our portfolio managers. You may inquire about having your account professionally managed using this fact-based investment system by clicking HERE. *Accounts over $250,000 please. ** Serious inquiries only.
PICTURED: The weekly chart of the S&P 500 Index shows that volume has increased in recent weeks as the market advanced.
|
|
|
 |
Tech Sector Strength Bodes Well For Growth Investors
Kenneth J. Gruneisen - Passed the CAN SLIM® Master's Exam
The major averages got a boost from the Bank Index ($BKX +3.11%) and tech shares, with the Networking Index ($NWX +3.45%) and Semiconductor Index ($SOX +2.19%) posting solid gains. The Gold & Silver Index ($XAU +2.99%) and Oil Services Index ($OSX +2.92%) also were among Thursday's best gainers, and the Healthcare Index ($HMO +2.08%) showed strength. Meanwhile, the Integrated Oil Index ($XOI +0.61%) and Internet Index ($IIX +0.50%) posted modest gains, and the Broker/Dealer Index ($XBD +0.11%) and Retail Index ($RLX +0.26%) edged higher while the Biotechnology Index ($BTK -0.03%) ended flat.
Charts courtesy www.stockcharts.com
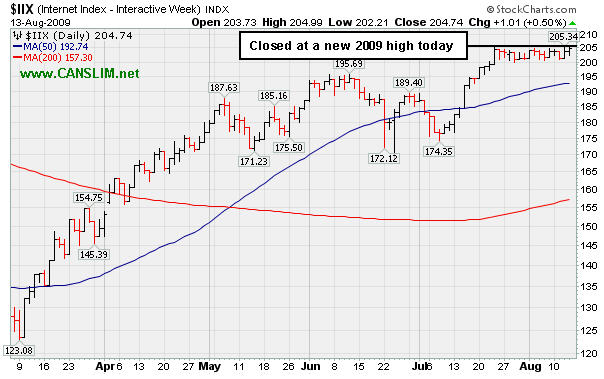
PICTURED: The Internet Index ($IIX +0.50%) has been trading in a very tight range for the past few weeks and today it appears to have closed at a new 2009 high. Yesterday's IGW section showed the Networking Index ($NWX +3.45%) hitting a new 2009 high (read here). We will be keeping an eye out for new leadership. For growth oriented investors, the tech sector's ongoing strength is very encouraging news.
| Oil Services |
$OSX |
176.26 |
+5.00 |
+2.92% |
+45.20% |
| Healthcare |
$HMO |
1,194.20 |
+24.33 |
+2.08% |
+24.37% |
| Integrated Oil |
$XOI |
962.25 |
+5.85 |
+0.61% |
-1.78% |
| Semiconductor |
$SOX |
302.36 |
+6.48 |
+2.19% |
+42.51% |
| Networking |
$NWX |
212.10 |
+7.08 |
+3.45% |
+47.40% |
| Internet |
$IIX |
204.74 |
+1.01 |
+0.50% |
+53.05% |
| Broker/Dealer |
$XBD |
111.90 |
+0.12 |
+0.11% |
+44.44% |
| Retail |
$RLX |
367.90 |
+0.95 |
+0.26% |
+31.74% |
| Gold & Silver |
$XAU |
148.99 |
+4.32 |
+2.99% |
+20.30% |
| Bank |
$BKX |
45.74 |
+1.38 |
+3.11% |
+3.20% |
| Biotech |
$BTK |
875.41 |
-0.22 |
-0.03% |
+35.27% |
|
|
|
 |
Gap Down Loss on Heavy Volume Triggers Sell Signal
Kenneth J. Gruneisen - Passed the CAN SLIM® Master's Exam
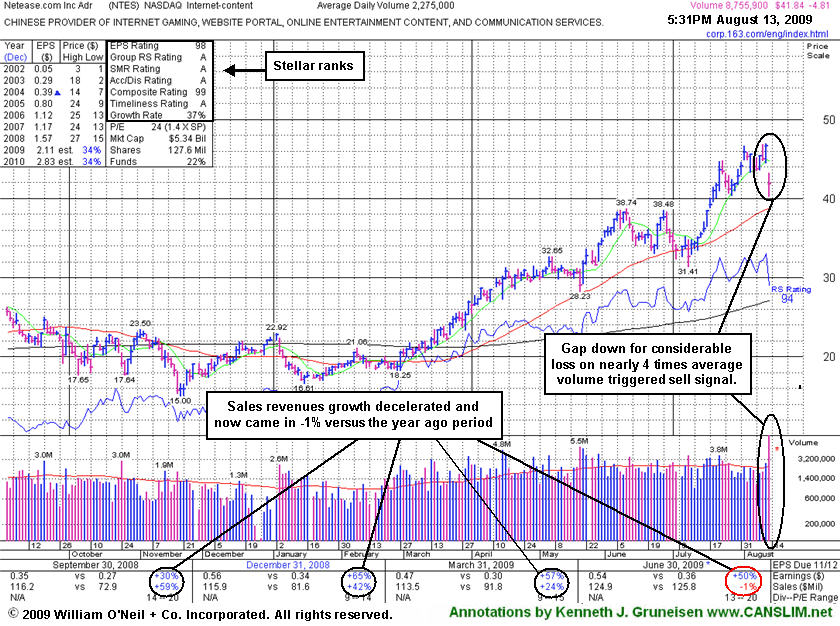
Netease.com Inc (NTES -$4.81 or -10.31% to $41.84) gapped down today after reporting results for the quarter ended June 30, 2009 which showed a +50% earnings per share increase. The market's negative reaction was likely due to the fact that sales revenues were reported at -1% versus the year ago period, which was a continuation of its steady sequential deceleration in sales revenues increases from +79%, +59%, +42% in the Jun, Sep, Dec '08 comparisons and +24% in Mar '09. Gaps are often a dead giveaway that large institutional investors are rushing in one direction. In this case, the weak technical action may be considered an early sell signal while it is diving toward the nearest chart support at its pivot point, 50 DMA line, and prior chart highs, all of which come into play in the $39 area.
It is an especially ominous sign, after a considerable run up, when a stock experiences its biggest point loss on the highest volume ever. Today's action fits that description, which raises a big red flag! The prior NTES appearance in this FSU section on 8/10/09 was framed up under the headline "Chinese Internet Content Firm Is Extended From Sound Base" and included the remark that, "Caution is advised because it is extended from its latest base" (read here). Disciplined investors know to avoid chasing any stock and buying it more than +5% above its pivot point. Those investors who were reckless and made sloppy buys should take note that, even after today's considerable loss, the stock still ended the day above the "max buy" level that was cited in prior reports.
|
|
|
Color Codes Explained :
Y - Better candidates highlighted by our
staff of experts.
G - Previously featured
in past reports as yellow but may no longer be buyable under the
guidelines.
***Last / Change / Volume quote data in this table corresponds with the timestamp on the note***
Symbol/Exchange
Company Name
Industry Group |
Last |
Chg. |
Vol
% DAV |
Date Featured |
Price Featured |
Latest Pivot Point
Featured |
Status |
| Latest Max Buy Price |
ASIA
-
|
$17.56
|
+0.50
|
803,730
102% DAV
790,100
|
8/2/2009
(Date
Featured) |
$19.27
(Price
Featured) |
PP = $22.19 |
G |
| MB = $23.30 |
Most Recent Note - 8/13/2009 5:35:08 PM
G - Halted its slide after 5 consecutive losses drove it well below its 50 DMA line. Prior lows in the $15 area are the next chart support level. It has not followed through with additional gains on volume, and instead, totally negated its big 7/30/09 gap up gain on heavy volume. Color code was changed to green, and it would need to rally above its recent highs in the $20 area for its outlook to improve. Recently featured in the August 2009 CANSLIM.net News here
There are no Featured Stock Updates™ available for this stock at this time. You may request one by clicking here
|
|
C
A
S
I |
News |
Chart |
SEC
View all notes Alert
me of new notes
Company
Profile
|
CPLA
- NASDAQ
Capella Education Co
DIVERSIFIED SERVICES - Education and Training Services
|
$63.67
|
+0.00
|
76,869
36% DAV
211,500
|
7/9/2009
(Date
Featured) |
$59.69
(Price
Featured) |
PP = $62.06 |
Y |
| MB = $65.16 |
Most Recent Note - 8/13/2009 5:37:24 PM
Y - Quietly hovering just -2% off its 52-week high, still above its pivot point. Featured in yellow in the 7/09/09 Mid-Day BreakOuts Report (read here). The Commercial Services-Schools Group has shown some leadership but has low ranks, and CPLA's Relative Strength rank has slumped to 65, under the 80+ guideline. Its small supply of only 13.9 million shares in the float could contribute to greater price volatility in the event of institutional accumulation or distribution. The number of top-rated funds owning an interest rose from 91 in Sept '08, to 133 as of March '09, which is reassuring with respect to the I criteria. It has a very good earnings history that satisfies the C & A criteria, while recent quarters showed steady sales revenues increases in the +17-18% range.
>>> The latest Featured Stock Update with an annotated graph appeared on 8/6/2009. click here.
|
|
C
A
S
I |
News |
Chart |
SEC
View all notes Alert
me of new notes
Company
Profile
|
GMCR
- NASDAQ
Green Mtn Coffee Roastrs
FOOD & BEVERAGE - Processed & Packaged Goods
|
$64.73
|
-0.11
|
1,053,124
67% DAV
1,571,300
|
7/17/2009
(Date
Featured) |
$60.15
(Price
Featured) |
PP = $63.79 |
G |
| MB = $66.98 |
Most Recent Note - 8/13/2009 5:39:52 PM
G - Today was its 4th consecutive loss on below average volume, consolidating toward its 50 DMA line since offering 5 million common shares. Prior highs in the $62-63 area are initial chart support to watch above its 50 DMA line. Do not be confused by the 3:2 stock split effective 6/09/09. GMCR traded up more than +168% since appearing with an annotated graph under the headline "It May Soon Be Time To Go Green" when featured in the January 2009 CANSLIM.net News (read here).
>>> The latest Featured Stock Update with an annotated graph appeared on 7/30/2009. click here.
|
|
C
A
S
I |
News |
Chart |
SEC
View all notes Alert
me of new notes
Company
Profile
|
LFT
-
|
$31.03
|
-0.54
|
879,590
115% DAV
765,900
|
8/10/2009
(Date
Featured) |
$31.49
(Price
Featured) |
PP = $30.57 |
Y |
| MB = $32.10 |
Most Recent Note - 8/13/2009 5:47:25 PM
Y - Small loss today on near average volume, closing at its second best level this year. No overhead supply remains to act as resistance after gains this week with above average volume helped it rally above its new pivot point - see the latest FSU analysis from 8/12/09.
>>> The latest Featured Stock Update with an annotated graph appeared on 8/12/2009. click here.
|
|
C
A
S
I |
News |
Chart |
SEC
View all notes Alert
me of new notes
Company
Profile
|
NTES
- NASDAQ
Netease Inc Adr
INTERNET - Internet Information Providers
|
$41.84
|
-4.81
|
8,762,018
389% DAV
2,251,700
|
7/17/2009
(Date
Featured) |
$39.29
(Price
Featured) |
PP = $38.74 |
G |
| MB = $40.68 |
Most Recent Note - 8/13/2009 6:24:00 PM
G - Gapped down today for a considerable loss on nearly 4 times average volume, triggering a technical sell signal. Results for the quarter ended June 30, 2009 showed a +50% earnings per share increase, but sales revenues were reported at -1% versus the year ago period, continuing its pattern of worrisome sequential deceleration in sales revenues increases from +79%, +59%, +42% in the Jun, Sep, Dec '08 comparisons and +24% in Mar '09. The nearest chart support is at its pivot point, 50 DMA line, and prior chart highs, all of which are in the $39 area. First featured at $26.75 in the 3/31/09 CANSLIM.net Mid-Day Breakouts Report (read here).
>>> The latest Featured Stock Update with an annotated graph appeared on 8/13/2009. click here.
|
|
C
A
S
I |
News |
Chart |
SEC
View all notes Alert
me of new notes
Company
Profile
|
NVEC
- NASDAQ
N V E Corp
ELECTRONICS - Semiconductor - Specialized
|
$54.24
|
+0.74
|
44,200
46% DAV
96,700
|
3/13/2009
(Date
Featured) |
$33.85
(Price
Featured) |
PP = $49.60 |
G |
| MB = $52.08 |
Most Recent Note - 8/13/2009 5:49:30 PM
G - Still quietly consolidating above prior chart highs that are now an important support level above its 50 DMA line. Deterioration under its prior chart high ($49.50) would raise concerns. Featured in the 7/23/09 Mid-Day BreakOuts Report (read here) after it gapped up for a considerable gain on heavy volume following news of stronger sales revenues (+41%) and solid earnings increases for the quarter ended June 30, 2009. The technical action was described as a "breakaway gap" from a valid ascending base. Quarterly sales revenues in the 6 million dollar range are still rather minuscule, leaving concerns.
>>> The latest Featured Stock Update with an annotated graph appeared on 8/3/2009. click here.
|
|
C
A
S
I |
News |
Chart |
SEC
View all notes Alert
me of new notes
Company
Profile
|
PEGA
- NASDAQ
Pegasystems Inc
COMPUTER SOFTWARE & SERVICES - Business Software & Services
|
$30.48
|
+0.13
|
165,623
55% DAV
298,700
|
7/29/2009
(Date
Featured) |
$27.53
(Price
Featured) |
PP = $27.49 |
G |
| MB = $28.86 |
Most Recent Note - 8/13/2009 5:51:40 PM
G - Quietly holding its ground, still a bit extended from its prior base. Previous resistance in the mid-$27 area is an important technical support level to watch above its 50 DMA line. Considerable 8/05/09 gain with nearly 5 times average volume followed strong Q2 earnings and raised guidance. The high-ranked software firm triggered a technical buy signal when rising from the "double bottom" base when it was featured in the 7/29/09 mid-day report (read here).
>>> The latest Featured Stock Update with an annotated graph appeared on 8/11/2009. click here.
|
|
C
A
S
I |
News |
Chart |
SEC
View all notes Alert
me of new notes
Company
Profile
|
TNDM
- NASDAQ
Tandem Diabetes Care Inc
TELECOMMUNICATIONS - Wireless Communications
|
$26.83
|
-0.41
|
894,551
92% DAV
974,000
|
3/2/2009
(Date
Featured) |
$18.89
(Price
Featured) |
PP = $32.67 |
G |
| MB = $34.30 |
Most Recent Note - 8/13/2009 5:53:16 PM
G - Holding its ground near its July chart lows after distributional pressure recently led to a violation of its 50 DMA line. Color code was changed to green after the technically damaging action negated its 8/03/09 breakout, raising concerns and triggering sell signals. It traded up as much as +82.95% since first featured at $18.89 in the 3/02/09 Mid-Day BreakOuts Report (read here).
>>> The latest Featured Stock Update with an annotated graph appeared on 8/5/2009. click here.
|
|
C
A
S
I |
News |
Chart |
SEC
View all notes Alert
me of new notes
Company
Profile
|
UTA
-
|
$13.26
|
-1.66
|
2,017,952
415% DAV
485,900
|
7/28/2009
(Date
Featured) |
$12.87
(Price
Featured) |
PP = $12.70 |
G |
| MB = $13.34 |
Most Recent Note - 8/13/2009 5:55:28 PM
G - Negatively reversed today for a loss on very heavy volume, a clear sign of worrisome distributional pressure. Wider intra-day swings of late were noted as a sign of uncertainty raising concerns while it is consolidating above prior chart highs that were previously noted as "an important support level to watch on pullbacks." Strong action prompted it to be featured in yellow with pivot point and max buy levels noted in the 7/28/09 mid-day breakouts report (read here), with additional analysis included in the after market update (read here). This Chinese provider of airline tickets and travel related services gapped up on 7/28/09, rising from a choppy 6-week base with a considerable gain on very heavy volume.
>>> The latest Featured Stock Update with an annotated graph appeared on 8/7/2009. click here.
|
|
C
A
S
I |
News |
Chart |
SEC
View all notes Alert
me of new notes
Company
Profile
|
|
|
|
THESE ARE NOT BUY RECOMMENDATIONS!
Comments contained in the body of this report are technical
opinions only. The material herein has been obtained
from sources believed to be reliable and accurate, however,
its accuracy and completeness cannot be guaranteed.
This site is not an investment advisor, hence it does
not endorse or recommend any securities or other investments.
Any recommendation contained in this report may not
be suitable for all investors and it is not to be deemed
an offer or solicitation on our part with respect to
the purchase or sale of any securities. All trademarks,
service marks and trade names appearing in this report
are the property of their respective owners, and are
likewise used for identification purposes only.
This report is a service available
only to active Paid Premium Members.
You may opt-out of receiving report notifications
at any time. Questions or comments may be submitted
by writing to Premium Membership Services 665 S.E. 10 Street, Suite 201 Deerfield Beach, FL 33441-5634 or by calling 1-800-965-8307
or 954-785-1121.
|
|
|


