You are not logged in.
This means you
CAN ONLY VIEW reports that were published prior to Sunday, April 27, 2025.
You
MUST UPGRADE YOUR MEMBERSHIP if you want to see any current reports.
AFTER MARKET UPDATE - MONDAY, AUGUST 12TH, 2013
Previous After Market Report Next After Market Report >>>
|
|
|
|
DOW |
-5.83 |
15,419.68 |
-0.04% |
|
Volume |
585,778,980 |
-8% |
|
Volume |
1,366,095,840 |
-9% |
|
NASDAQ |
+9.84 |
3,669.95 |
+0.27% |
|
Advancers |
1,629 |
52% |
|
Advancers |
1,431 |
55% |
|
S&P 500 |
-1.95 |
1,689.47 |
-0.12% |
|
Decliners |
1,384 |
44% |
|
Decliners |
1,087 |
42% |
|
Russell 2000 |
+5.27 |
1,053.67 |
+0.50% |
|
52 Wk Highs |
104 |
|
|
52 Wk Highs |
102 |
|
|
S&P 600 |
+3.06 |
595.13 |
+0.52% |
|
52 Wk Lows |
62 |
|
|
52 Wk Lows |
27 |
|
|
 |
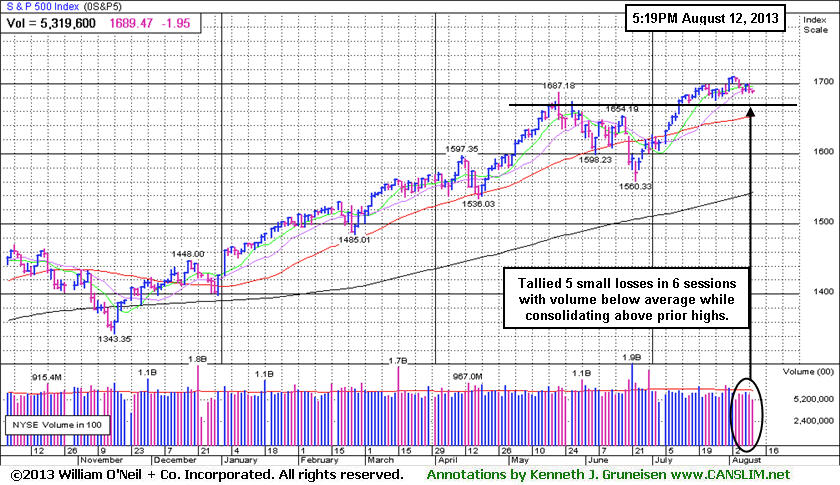
Volume Totals Cooling While Consolidating Near 2013 Highs
Kenneth J. Gruneisen - Passed the CAN SLIM® Master's Exam
The major averages finished little changed in a quiet session on Monday. The volume totals were reported lighter than the prior session totals on the Nasdaq exchange and on the NYSE. Breadth was slightly positive as advancers led decliners by about an 8-7 margin on the Nasdaq exchange and on the NYSE. There were 42 high-ranked companies from the CANSLIM.net Leaders List made new 52-week highs and appeared on the CANSLIM.net BreakOuts Page, down from the prior session total of 46 stocks. The list of stocks hitting new 52-week highs contracted yet easily outnumbered new 52-week lows on the Nasdaq exchange and on the NYSE. There were gains for 10 of the 18 high-ranked companies currently included on the Featured Stocks Page.
The major averages traded in a tight range amid a light docket of economic data and earnings results. A larger than expected slowdown in the pace of Japan's economic expansion was in focus. Data on our shores was on the back burner as Treasury said the U.S. government budget deficit widened in July. The cautious tone also came ahead of Tuesday's update on the consumer with retail sales expected to increase for the fourth consecutive month.
On the earnings front, Sysco Corp (SYY -5.77%) after posting a profit tally below analyst expectations. Overall, most sectors finished in negative territory. Technology was the best performing group, led by Apple Inc's (AAPL +2.84%) advance and BlackBerry Ltd (BBRY +10.45%) rallied after news that the company is considering putting itself up for sale. The tech rally helped offset losses in Utilities and Energy as Southern Co (SO -0.71%) and Exxon Mobil Corp (XOM -0.91%) ended lower.
In fixed-income, Treasuries snapped a three-day winning streak. The 10-year note was down 10/32 to yield 2.61% and the 30-year bond lost 26/32 to yield 3.68%.
The market (M criteria) endured a number of distributional sessions in recent weeks which put the current rally under pressure. For any rally to be sustained it is absolutely crucial to have a healthy crop of new leaders, so it is most favorable for the list of stocks hitting new highs and appearing on the BreakOuts Page to continue including many companies. As always, individual holdings should be closely monitored for any worrisome technical sell signals.
Stay familiar with companies listed on the CANSLIM.net Featured Stocks Page - a page showing the most action-worthy candidates' latest notes and links to additional resources including detailed analysis with data-packed graphs which are annotated by a Certified expert. The Premium Member Homepage - includes "dynamic archives" to all prior pay reports published. Watch for an announcement via email concerning the next WEBCAST.
PICTURED: The S&P 500 Index has tallied 5 small losses with below average volume in the span of 6 sessions while consolidating near all-time highs.
|
 Kenneth J. Gruneisen started out as a licensed stockbroker in August 1987, a couple of months prior to the historic stock market crash that took the Dow Jones Industrial Average down -22.6% in a single day. He has published daily fact-based fundamental and technical analysis on high-ranked stocks online for two decades. Through FACTBASEDINVESTING.COM, Kenneth provides educational articles, news, market commentary, and other information regarding proven investment systems that work in good times and bad.
Comments contained in the body of this report are technical opinions only and are not necessarily those of Gruneisen Growth Corp. The material herein has been obtained from sources believed to be reliable and accurate, however, its accuracy and completeness cannot be guaranteed. Our firm, employees, and customers may effect transactions, including transactions contrary to any recommendation herein, or have positions in the securities mentioned herein or options with respect thereto. Any recommendation contained in this report may not be suitable for all investors and it is not to be deemed an offer or solicitation on our part with respect to the purchase or sale of any securities. |
|
 |
XAU Spikes Higher For 3rd Straight Gain
Kenneth J. Gruneisen - Passed the CAN SLIM® Master's Exam
Energy-related shares edged lower as the Integrated Oil Index ($XOI -0.55%) and Oil Services Index ($OSX -0.17%) ended with modest losses. The Healthcare Index ($HMO -0.47%) edged lower Financial shares edged lower and the Bank Index ($BKX -0.26%) and Broker/Dealer Index ($XBD -0.24%) each ended with a small loss while the Retail Index ($RLX +0.12%) eked out a small gain. The Biotechnology Index ($BTK -1.05%) lagged with a loss while other tech indexes including the Internet Index ($IIX +0.29%), Semiconductor Index ($SOX +0.39%), and the Networking Index ($NWX +0.51%) posted modest gains.
Charts courtesy www.stockcharts.com
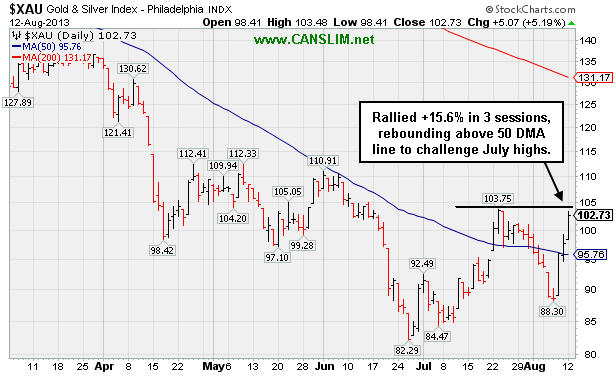
PICTURED: The Gold & Silver Index ($XAU +5.19%) was a standout gainer. It has rallied +15.6% in 3 sessions, rebounding above its 50-day moving average (DMA) line toward its July highs.
| Oil Services |
$OSX |
263.26 |
-0.44 |
-0.17% |
+19.58% |
| Healthcare |
$HMO |
3,418.37 |
-16.21 |
-0.47% |
+35.96% |
| Integrated Oil |
$XOI |
1,373.07 |
-7.57 |
-0.55% |
+10.57% |
| Semiconductor |
$SOX |
473.62 |
+1.86 |
+0.39% |
+23.32% |
| Networking |
$NWX |
295.27 |
+1.49 |
+0.51% |
+30.33% |
| Internet |
$IIX |
409.47 |
+1.18 |
+0.29% |
+25.22% |
| Broker/Dealer |
$XBD |
133.99 |
-0.32 |
-0.24% |
+42.04% |
| Retail |
$RLX |
843.71 |
+1.03 |
+0.12% |
+29.19% |
| Gold & Silver |
$XAU |
102.73 |
+5.07 |
+5.19% |
-37.96% |
| Bank |
$BKX |
65.16 |
-0.17 |
-0.26% |
+27.07% |
| Biotech |
$BTK |
2,082.45 |
-22.11 |
-1.05% |
+34.61% |
|
|
|
 |
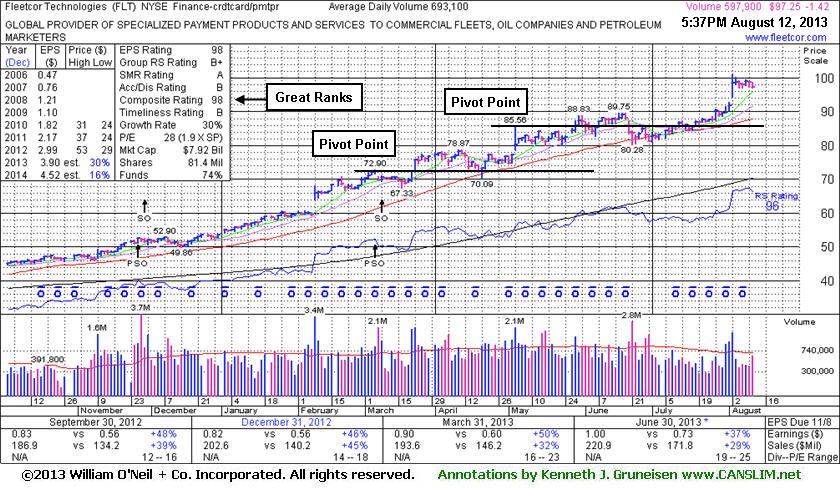
Holding Ground Following Volume-Driven Gains From Late-Stage Base
Kenneth J. Gruneisen - Passed the CAN SLIM® Master's Exam
FleetCor Technologies, Inc. (FLT -$1.42 or -1.44% to $97.25) is holding its ground stubbornly, extended from any sound base and perched at all-time highs. No resistance remains due to overhead supply. Disciplined investors avoid chasing stocks extended more than +5% above their pivot point or prior highs and always limit losses by selling any stock that falls more than -7% from their purchase price. Volume totals have been cooling after spiking higher with gains backed by above average volume. Arguably, the latest breakout cleared a riskier "late-stage" base pattern, however the stock had not made meaningful progress above its latest pivot point cited based on its 5/03/13 high and there were many weeks to accumulate shares. No new pivot point was cited since last shown in this FSU section on 7/18/13 with an annotated graph under the headline, "Volume Totals Cooling During Consolidation", while it found support near its 50-day moving average (DMA) line.
It reported earnings +37% on +29% sales for the Jun '13 quarter, marking its 6th consecutive quarterly comparison with earnings above the +25% guideline (C criteria). The company completed another Secondary Offering on 3/08/13 after a streak of volume-driven gains into new high territory. On 3/14/12, 6/11/12, and 11/29/12 it priced Secondary Offerings and it was previously noted, "Such offerings often are a short-term hindrance to upward price progress yet typically result in broader institutional ownership interest."
The number of top-rated funds owning its shares rose from 193 in Mar '12 to 420 in Jun '13, a reassuring sign concerning the I criteria. The company hails from the Finance - Credit Card Payment Processing group which improved to a 76 Group Relative Strength Rating from a 55 rating when last shown in the FSU section on 7/18/13. Impressive strength and leadership from a couple of other firms in the same industry group is also considered a reassurance concerning the L criteria.
|
|
|
Color Codes Explained :
Y - Better candidates highlighted by our
staff of experts.
G - Previously featured
in past reports as yellow but may no longer be buyable under the
guidelines.
***Last / Change / Volume data in this table is the closing quote data***
Symbol/Exchange
Company Name
Industry Group |
PRICE |
CHANGE
(%Change) |
Day High |
Volume
(% DAV)
(% 50 day avg vol) |
52 Wk Hi
% From Hi |
Featured
Date |
Price
Featured |
Pivot Featured |
|
Max Buy |
AMBA
-
NASDAQ
Ambarella Inc
ELECTRONICS - Semiconductor - Specialized
|
$16.98
|
+0.16
0.95% |
$17.42
|
753,749
65.71% of 50 DAV
50 DAV is 1,147,100
|
$19.44
-12.65%
|
7/15/2013
|
$17.87
|
PP = $18.68
|
|
MB = $19.61
|
Most Recent Note - 8/8/2013 2:59:05 PM
G - Rallying toward its 50 DMA line which acted resistance following the technical violation which triggered a sell signal last week. A rebound above that important short-term average would help its outlook improve.
>>> The latest Featured Stock Update with an annotated graph appeared on 7/17/2013. Click here.
View all notes |
Alert me of new notes |
CANSLIM.net Company Profile |
SEC |
Zacks Reports |
StockTalk |
News |
Chart |
Request a new note
C
A N
S L
I M


|
BITA
-
NYSE
Bitauto Hldgs Ltd Ads
INTERNET - Internet Information Providers
|
$16.24
|
-0.06
-0.37% |
$16.55
|
573,428
436.07% of 50 DAV
50 DAV is 131,500
|
$18.10
-10.28%
|
8/7/2013
|
$12.01
|
PP = $13.30
|
|
MB = $13.97
|
Most Recent Note - 8/9/2013 12:27:09 PM
G - Tallying its 2nd consecutive volume-driven gain for new highs. Color code was changed to green after quickly getting extended beyond the "max buy" level. Prior highs in the $13 area define initial support to watch on pullbacks. The 8/07/13 After Market Update included more details and a new annotated graph under the headline "Found Prompt Support After Undercutting 50-Day Average".
>>> The latest Featured Stock Update with an annotated graph appeared on 8/7/2013. Click here.
View all notes |
Alert me of new notes |
CANSLIM.net Company Profile |
SEC |
Zacks Reports |
StockTalk |
News |
Chart |
Request a new note
C
A N
S L
I M
|
CELG
-
NASDAQ
Celgene Corp
DRUGS - Drug Manufacturers - Major
|
$140.83
|
-1.24
-0.87% |
$142.07
|
1,220,173
42.42% of 50 DAV
50 DAV is 2,876,300
|
$149.92
-6.06%
|
7/11/2013
|
$133.25
|
PP = $131.92
|
|
MB = $138.52
|
Most Recent Note - 8/6/2013 4:14:26 PM
G - Retreated from its 52-week and all-time highs with near average but higher volume today. Extended from its prior base and support at old highs in the $131 area.
>>> The latest Featured Stock Update with an annotated graph appeared on 7/29/2013. Click here.
View all notes |
Alert me of new notes |
CANSLIM.net Company Profile |
SEC |
Zacks Reports |
StockTalk |
News |
Chart |
Request a new note
C
A N
S L
I M
|
FLT
-
NYSE
Fleetcor Technologies
DIVERSIFIED SERVICES - Business/Management Services
|
$97.25
|
-1.42
-1.44% |
$98.67
|
598,281
85.54% of 50 DAV
50 DAV is 699,400
|
$100.87
-3.59%
|
5/29/2013
|
$86.02
|
PP = $85.66
|
|
MB = $89.94
|
 Most Recent Note - 8/12/2013 6:07:52 PM
G- Holding its ground stubbornly, extended from any sound base and perched at all-time highs. Volume totals have been cooling after spiking higher with gains backed by above average volume. See latest FSU analysis for more details and a new annotated graph.
>>> The latest Featured Stock Update with an annotated graph appeared on 8/12/2013. Click here.
View all notes |
Alert me of new notes |
CANSLIM.net Company Profile |
SEC |
Zacks Reports |
StockTalk |
News |
Chart |
Request a new note
C
A N
S L
I M
|
GNRC
-
NYSE
Generac Hldgs Inc
CONSUMER DURABLES - Electronic Equipment
|
$42.65
|
+0.31
0.73% |
$42.76
|
677,568
55.79% of 50 DAV
50 DAV is 1,214,400
|
$44.30
-3.72%
|
7/30/2013
|
$42.60
|
PP = $42.10
|
|
MB = $44.21
|
Most Recent Note - 8/8/2013 5:21:29 PM
Y - Holding its ground since gapping down on 8/02/13 after pricing a Secondary Offering. It recently rallied from an advanced "3-weeks tight" base. Disciplined investors always limit losses by selling if any stock falls more than -7% from its purchase price.
>>> The latest Featured Stock Update with an annotated graph appeared on 7/30/2013. Click here.
View all notes |
Alert me of new notes |
CANSLIM.net Company Profile |
SEC |
Zacks Reports |
StockTalk |
News |
Chart |
Request a new note
C
A N
S L
I M
|
Symbol/Exchange
Company Name
Industry Group |
PRICE |
CHANGE
(%Change) |
Day High |
Volume
(% DAV)
(% 50 day avg vol) |
52 Wk Hi
% From Hi |
Featured
Date |
Price
Featured |
Pivot Featured |
|
Max Buy |
KORS
-
NYSE
Michael Kors Hldgs Ltd
RETAIL - Apparel Stores
|
$72.00
|
-0.05
-0.07% |
$72.54
|
1,999,867
53.52% of 50 DAV
50 DAV is 3,736,900
|
$72.53
-0.73%
|
8/6/2013
|
$69.66
|
PP = $66.28
|
|
MB = $69.59
|
Most Recent Note - 8/8/2013 5:24:09 PM
G - Posted a gain with above average volume getting extended beyond its "max buy" level, and its color code is changed to green. Relative Strength rating improved to 83, above the 80+ minimum guideline for buy candidates.
>>> The latest Featured Stock Update with an annotated graph appeared on 8/6/2013. Click here.
View all notes |
Alert me of new notes |
CANSLIM.net Company Profile |
SEC |
Zacks Reports |
StockTalk |
News |
Chart |
Request a new note
C
A N
S L
I M
|
LOPE
-
NASDAQ
Grand Canyon Education
DIVERSIFIED SERVICES - Education and; Training Services
|
$34.80
|
+0.30
0.87% |
$35.18
|
580,228
133.17% of 50 DAV
50 DAV is 435,700
|
$37.17
-6.38%
|
6/19/2013
|
$31.47
|
PP = $34.17
|
|
MB = $35.88
|
Most Recent Note - 8/8/2013 5:26:10 PM
Y - Reported earnings +15% on +19% sales for the Jun '13 quarter, below the +25% minimum earnings guideline (C criteria), raising fundamental concerns. Consolidating below its "max buy" level. Prior highs in the $34 area define support along with its 50 DMA line.
>>> The latest Featured Stock Update with an annotated graph appeared on 7/19/2013. Click here.
View all notes |
Alert me of new notes |
CANSLIM.net Company Profile |
SEC |
Zacks Reports |
StockTalk |
News |
Chart |
Request a new note
C
A N
S L
I M
|
PCLN
-
NASDAQ
Priceline.Com Inc
INTERNET - Internet Software and Services
|
$958.02
|
-11.87
-1.22% |
$969.66
|
714,138
105.64% of 50 DAV
50 DAV is 676,000
|
$994.98
-3.71%
|
7/8/2013
|
$878.28
|
PP = $847.43
|
|
MB = $889.80
|
Most Recent Note - 8/9/2013 12:59:35 PM
G - Challenged the $1,000 threshold after it gapped up for a considerable gain and new 52-week high, getting more extended from any sound base. Reported earnings +24% on +27% sales revenues for the Jun '13 quarter, just under the +25% minimum earnings guideline (C criteria).
>>> The latest Featured Stock Update with an annotated graph appeared on 7/25/2013. Click here.
View all notes |
Alert me of new notes |
CANSLIM.net Company Profile |
SEC |
Zacks Reports |
StockTalk |
News |
Chart |
Request a new note
C
A N
S L
I M
|
PRAA
-
NASDAQ
Portfolio Recovery Assoc
DIVERSIFIED SERVICES - Business/Management Services
|
$54.53
|
+2.02
3.85% |
$54.93
|
644,004
140.67% of 50 DAV
50 DAV is 457,800
|
$54.62
-0.17%
|
7/31/2013
|
$51.43
|
PP = $54.72
|
|
MB = $57.46
|
Most Recent Note - 8/12/2013 6:10:18 PM
Y - Rallied near its pivot point with today's solid gain backed by +40% above average volume. Members were repeatedly cautioned - "It faces some resistance and needs additional volume-driven gains to trigger a proper new technical buy signal."
>>> The latest Featured Stock Update with an annotated graph appeared on 8/2/2013. Click here.
View all notes |
Alert me of new notes |
CANSLIM.net Company Profile |
SEC |
Zacks Reports |
StockTalk |
News |
Chart |
Request a new note
C
A N
S L
I M
|
PRLB
-
NYSE
Proto Labs Inc
MANUFACTURING - Small Tools and Accessories
|
$68.16
|
+2.13
3.23% |
$68.21
|
458,695
93.59% of 50 DAV
50 DAV is 490,100
|
$72.08
-5.44%
|
7/29/2013
|
$64.86
|
PP = $67.50
|
|
MB = $70.88
|
Most Recent Note - 8/12/2013 6:12:02 PM
Y - Tallied a 3rd consecutive gain with below or near average volume since again testing support near its 50 DMA line and prior lows when encountering distributional pressure. Disciplined investors always limit losses if any stock falls more than -7% from their purchase price.
>>> The latest Featured Stock Update with an annotated graph appeared on 8/5/2013. Click here.
View all notes |
Alert me of new notes |
CANSLIM.net Company Profile |
SEC |
Zacks Reports |
StockTalk |
News |
Chart |
Request a new note
C
A N
S L
I M
|
Symbol/Exchange
Company Name
Industry Group |
PRICE |
CHANGE
(%Change) |
Day High |
Volume
(% DAV)
(% 50 day avg vol) |
52 Wk Hi
% From Hi |
Featured
Date |
Price
Featured |
Pivot Featured |
|
Max Buy |
QCOR
-
NASDAQ
Questcor Pharmaceuticals
DRUGS - Biotechnology
|
$66.14
|
+0.59
0.90% |
$67.06
|
1,012,326
47.94% of 50 DAV
50 DAV is 2,111,600
|
$70.55
-6.25%
|
7/31/2013
|
$66.46
|
PP = $59.01
|
|
MB = $61.96
|
Most Recent Note - 8/8/2013 3:01:23 PM
G - Still consolidating near its high with volume totals cooling following volume-driven gains. Quickly got extended beyond its "max buy" level after highlighted in yellow in the 7/31/13 mid-day report (read here) with a weekly graph which illustrated its powerful long-term breakout to new highs.
>>> The latest Featured Stock Update with an annotated graph appeared on 8/1/2013. Click here.
View all notes |
Alert me of new notes |
CANSLIM.net Company Profile |
SEC |
Zacks Reports |
StockTalk |
News |
Chart |
Request a new note
C
A N
S L
I M
|
RRTS
-
NYSE
Roadrunner Trans Systems
TRANSPORTATION - Air Delivery and Freight Service
|
$29.71
|
-0.07
-0.24% |
$29.90
|
65,532
47.73% of 50 DAV
50 DAV is 137,300
|
$30.98
-4.11%
|
4/3/2013
|
$22.77
|
PP = $23.75
|
|
MB = $24.94
|
Most Recent Note - 8/6/2013 4:19:53 PM
G - Hovering near its 52-week high, technically extended from any sound base. Fundamentally, it reported earnings +19% on +26% in the Jun '13 quarter, raising more concerns with its 2nd consecutive quarterly comparison with earnings increasing below the +25% minimum guideline (C criteria).
>>> The latest Featured Stock Update with an annotated graph appeared on 7/22/2013. Click here.
View all notes |
Alert me of new notes |
CANSLIM.net Company Profile |
SEC |
Zacks Reports |
StockTalk |
News |
Chart |
Request a new note
C
A N
S L
I M
|
SFUN
-
NYSE
Soufun Hldgs Ltd Ads A
INTERNET - Internet Information Providers
|
$38.50
|
-0.43
-1.10% |
$42.15
|
1,223,771
322.30% of 50 DAV
50 DAV is 379,700
|
$39.98
-3.70%
|
7/16/2013
|
$29.54
|
PP = $27.90
|
|
MB = $29.30
|
Most Recent Note - 8/12/2013 12:55:42 PM
G - Hit a new high today then reversed into the red. It is very extended from its latest base after another considerable volume-driven gain. Disciplined investors avoid chasing stocks too extended from sound bases. See the latest FSU analysis for more details and a new annotated daily graph.
>>> The latest Featured Stock Update with an annotated graph appeared on 8/8/2013. Click here.
View all notes |
Alert me of new notes |
CANSLIM.net Company Profile |
SEC |
Zacks Reports |
StockTalk |
News |
Chart |
Request a new note
C
A N
S L
I M
|
SSNC
-
NASDAQ
S S & C Technologies
COMPUTER SOFTWARE and SERVICES - Application Software
|
$35.60
|
+0.09
0.25% |
$36.00
|
260,830
62.16% of 50 DAV
50 DAV is 419,600
|
$38.80
-8.25%
|
7/11/2013
|
$35.80
|
PP = $34.54
|
|
MB = $36.27
|
Most Recent Note - 8/9/2013 5:21:29 PM
Y - Found prompt support after undercutting its 50 DMA line and prior highs in the $34 area. Disciplined investors always limit losses if ever any stock falls more than -7% from their purchase price. See the latest FSU analysis for more details and a new annotated graph.
>>> The latest Featured Stock Update with an annotated graph appeared on 8/9/2013. Click here.
View all notes |
Alert me of new notes |
CANSLIM.net Company Profile |
SEC |
Zacks Reports |
StockTalk |
News |
Chart |
Request a new note
C
A N
S L
I M
|
SSYS
-
NASDAQ
Stratasys Ltd
COMPUTER HARDWARE - Computer Peripherals
|
$103.11
|
+8.07
8.49% |
$103.50
|
1,640,205
204.72% of 50 DAV
50 DAV is 801,200
|
$99.50
3.63%
|
7/8/2013
|
$91.44
|
PP = $95.00
|
|
MB = $99.75
|
Most Recent Note - 8/12/2013 12:58:46 PM
G - Hitting another new 52-week high today and its color code is changed to green while rising beyond its "max buy" level. Technically it broke out and hit a new 52-week high with heavy volume behind its considerable 8/08/13 gain triggering a technical buy signal. The stock's Relative Strength Rating is currently a 78, just below the 80+ minimum guideline for buy candidates under the fact-based investment system. Reported strong earnings and found prompt support after briefly undercutting its 50 DMA line last week.
>>> The latest Featured Stock Update with an annotated graph appeared on 7/24/2013. Click here.
View all notes |
Alert me of new notes |
CANSLIM.net Company Profile |
SEC |
Zacks Reports |
StockTalk |
News |
Chart |
Request a new note
C
A N
S L
I M
|
Symbol/Exchange
Company Name
Industry Group |
PRICE |
CHANGE
(%Change) |
Day High |
Volume
(% DAV)
(% 50 day avg vol) |
52 Wk Hi
% From Hi |
Featured
Date |
Price
Featured |
Pivot Featured |
|
Max Buy |
STMP
-
NASDAQ
Stamps.Com Inc
INTERNET - Internet Software and Services
|
$40.49
|
+0.15
0.37% |
$40.81
|
113,661
78.66% of 50 DAV
50 DAV is 144,500
|
$46.47
-12.87%
|
7/31/2013
|
$40.00
|
PP = $42.98
|
|
MB = $45.13
|
Most Recent Note - 8/6/2013 4:24:51 PM
Y - Encountered more distributional pressure with today's 3rd consecutive loss on higher above average volume while slumping toward its 50 DMA line. Disciplined investors limit losses if any stock falls more than -7% from their purchase price.
>>> The latest Featured Stock Update with an annotated graph appeared on 7/31/2013. Click here.
View all notes |
Alert me of new notes |
CANSLIM.net Company Profile |
SEC |
Zacks Reports |
StockTalk |
News |
Chart |
Request a new note
C
A N
S L
I M
|
VRX
-
NYSE
Valeant Pharmaceuticals
DRUGS - Drug Manufacturers - Other
|
$101.95
|
+0.08
0.08% |
$102.26
|
1,437,813
88.57% of 50 DAV
50 DAV is 1,623,300
|
$102.54
-0.58%
|
4/30/2013
|
$60.24
|
PP = $76.66
|
|
MB = $80.49
|
Most Recent Note - 8/6/2013 4:30:21 PM
Y- Hovering near its 52-week high after wedging higher with recent gains lacking great volume conviction while rising from a 9-week cup-with-handle base. Due to report Q2 results before the open on August 7, 2013, and volume and volatility often increase near earnings news. No new pivot point has been cited while members were repeatedly cautioned - "Concerns were raised by its Mar '13 earnings report with only a +14% earnings increase, below the +25% minimum guideline (C criteria) for buy candidates."
>>> The latest Featured Stock Update with an annotated graph appeared on 7/23/2013. Click here.
View all notes |
Alert me of new notes |
CANSLIM.net Company Profile |
SEC |
Zacks Reports |
StockTalk |
News |
Chart |
Request a new note
C
A N
S L
I M
|
YNDX
-
NASDAQ
Yandex N V Class A
INTERNET - Internet Information Providers
|
$32.68
|
-0.36
-1.09% |
$32.89
|
1,316,941
53.11% of 50 DAV
50 DAV is 2,479,500
|
$34.27
-4.64%
|
7/10/2013
|
$29.29
|
PP = $29.59
|
|
MB = $31.07
|
Most Recent Note - 8/6/2013 4:31:29 PM
G - Holding its ground stubbornly near its 52-week high with small losses on light volume following volume-driven gains into new high territory. Prior highs in the $28-29 area define near-term support to watch.
>>> The latest Featured Stock Update with an annotated graph appeared on 7/26/2013. Click here.
View all notes |
Alert me of new notes |
CANSLIM.net Company Profile |
SEC |
Zacks Reports |
StockTalk |
News |
Chart |
Request a new note
C
A N
S L
I M
|
|
|
|
THESE ARE NOT BUY RECOMMENDATIONS!
Comments contained in the body of this report are technical
opinions only. The material herein has been obtained
from sources believed to be reliable and accurate, however,
its accuracy and completeness cannot be guaranteed.
This site is not an investment advisor, hence it does
not endorse or recommend any securities or other investments.
Any recommendation contained in this report may not
be suitable for all investors and it is not to be deemed
an offer or solicitation on our part with respect to
the purchase or sale of any securities. All trademarks,
service marks and trade names appearing in this report
are the property of their respective owners, and are
likewise used for identification purposes only.
This report is a service available
only to active Paid Premium Members.
You may opt-out of receiving report notifications
at any time. Questions or comments may be submitted
by writing to Premium Membership Services 665 S.E. 10 Street, Suite 201 Deerfield Beach, FL 33441-5634 or by calling 1-800-965-8307
or 954-785-1121.
|
|
|

