You are not logged in.
This means you
CAN ONLY VIEW reports that were published prior to Monday, March 10, 2025.
You
MUST UPGRADE YOUR MEMBERSHIP if you want to see any current reports.
AFTER MARKET UPDATE - WEDNESDAY, AUGUST 12TH, 2009
Previous After Market Report Next After Market Report >>>
|
|
|
|
DOW |
+120.16 |
9,361.61 |
+1.30% |
|
Volume |
1,226,835,070 |
+2% |
|
Volume |
2,224,906,830 |
+10% |
|
NASDAQ |
+28.99 |
1,998.72 |
+1.47% |
|
Advancers |
2,239 |
71% |
|
Advancers |
1,939 |
68% |
|
S&P 500 |
+11.46 |
1,005.81 |
+1.15% |
|
Decliners |
822 |
26% |
|
Decliners |
796 |
28% |
|
Russell 2000 |
+10.05 |
572.17 |
+1.79% |
|
52 Wk Highs |
58 |
|
|
52 Wk Highs |
48 |
|
|
S&P 600 |
+4.66 |
303.68 |
+1.56% |
|
52 Wk Lows |
2 |
|
|
52 Wk Lows |
4 |
|
|
 |
Major Averages Rally For Gains As Fed Holds Rates Steady
Adam Sarhan, Contributing Writer,
The major averages ended higher after the Federal Reserve held rates steady as they concluded their two-day meeting on Wednesday. Volume totals reported on the NYSE and Nasdaq exchange were slightly higher than the prior session totals. Advancers led decliners by nearly a 3-to-1 ratio on the NYSE and by over a 2-to-1 ratio on the Nasdaq exchange. There were 16 high-ranked companies from the CANSLIM.net Leaders List that made a new 52-week high and appeared on the CANSLIM.net BreakOuts Page, down from the 23 issues that appeared on the prior session. On both exchanges new 52-week highs still significantly outnumbered 52-week lows, and new lows were in the single digits again.
US stocks rallied nicely, rebounding from the market’s largest single day decline in a month. The Federal Reserve left the benchmark interest rate between zero and 0.25% and said economic conditions will remain "exceptionally low" for an "extended period." The decision to hold rates near steady was unanimous. As the economy begins to show small signs of recovering, the Fed said it will slow the pace of its $300 billion program to buy US Treasuries while the recession eases. In their post meeting commentary, the committee said, "To promote a smooth transition in markets as these purchases of Treasury securities are completed, the committee has decided to gradually slow the pace of these transactions and anticipates that the full amount will be purchased by the end of October." Previously, the buying was scheduled to end in September.
In economic news, the US trade deficit widened less than forecast in June, which reflected a second consecutive gain in exports. Stronger exports are largely a two-fold function: a weaker dollar coupled with healthier economies around the world. The Commerce Department said the gap expanded 4% to $27 billion from $26 billion in May. This was the lowest reading in nearly a decade. Exports rose +2% while imports rose +2.3%, led by higher oil prices.
PICTURED: The Nasdaq Composite Index has spent the past few days quietly consolidating its recent move below resistance (2015).
|
|
|
 |
Networking Index Rallies To New 2009 High
Kenneth J. Gruneisen - Passed the CAN SLIM® Master's Exam
The financial sector had a positive influence on the major indices on Wednesday as the Broker/Dealer Index ($XBD +3.00%) and Bank Index ($BKX +1.86%) posted solid gains. The Networking Index ($NWX +4.03%) led the tech sector higher, followed by gains from the Biotechnology Index ($BTK +1.80%), Semiconductor Index ($SOX +1.77%), and Internet Index ($IIX +1.19%). Energy related shares posted gains and lifted the Integrated Oil Index ($XOI +1.14%) and Oil Services Index ($OSX +1.84%). Modest gains from the Healthcare Index ($HMO +0.62%), Gold & Silver Index ($XAU +0.79%), and Retail Index ($RLX +0.89%) rounded out the mostly positive session.
Charts courtesy www.stockcharts.com
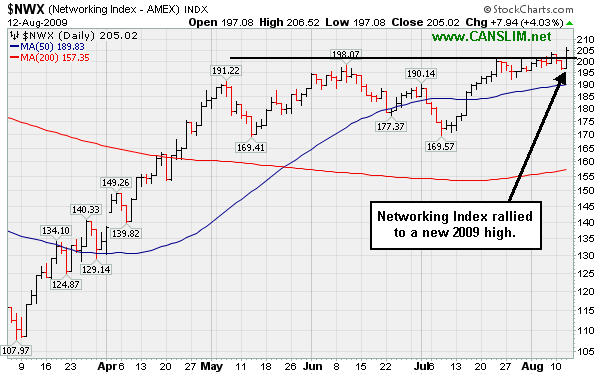
PICTURED: The Networking Index ($NWX +4.03%) was a standout gainer as it rallied to a new 2009 high. One of that index's components, mediocre ranked ADC Telecommunications Inc. (ADCT +29.28%), gapped up for a considerable gain after raising guidance, however its sub par fundamentals do not make it worthy for disciplined investors' watchlists.
| Oil Services |
$OSX |
171.26 |
+3.09 |
+1.84% |
+41.08% |
| Healthcare |
$HMO |
1,169.87 |
+7.25 |
+0.62% |
+21.84% |
| Integrated Oil |
$XOI |
956.40 |
+10.74 |
+1.14% |
-2.38% |
| Semiconductor |
$SOX |
295.88 |
+5.14 |
+1.77% |
+39.45% |
| Networking |
$NWX |
205.02 |
+7.94 |
+4.03% |
+42.48% |
| Internet |
$IIX |
203.73 |
+2.40 |
+1.19% |
+52.30% |
| Broker/Dealer |
$XBD |
111.78 |
+3.26 |
+3.00% |
+44.29% |
| Retail |
$RLX |
366.95 |
+3.24 |
+0.89% |
+31.40% |
| Gold & Silver |
$XAU |
144.67 |
+1.14 |
+0.79% |
+16.81% |
| Bank |
$BKX |
44.36 |
+0.81 |
+1.86% |
+0.09% |
| Biotech |
$BTK |
875.63 |
+15.47 |
+1.80% |
+35.30% |
|
|
|
 |
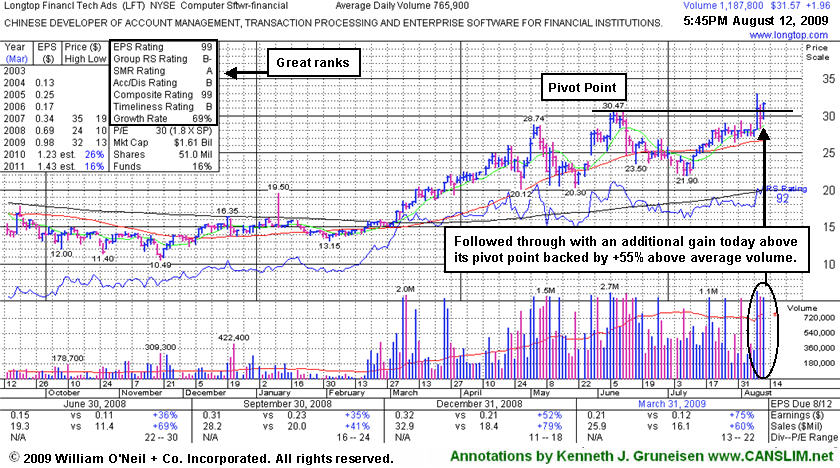
Longtop Returns To Featured Stocks List
Kenneth J. Gruneisen - Passed the CAN SLIM® Master's Exam
Longtop Financl Tech Ads (LFT +$1.96 or +6.21% to $31.57) ended at a new high close today, following through with an additional gain above its pivot point backed by +55% above average volume. That was a sign of prompt support and institutional buying demand after a pullback toward prior chart highs on the prior session that had erased most of the considerable gap up gain with heavy volume from 8/10/09 which had helped it reach a new 52-week high. This previously featured high-ranked leader showed up in Monday's Mid-Day Breakouts Report (read here) with a note indicating " Y - Gapped up today and rallied for a considerable gain with heavy volume, reaching a new 52-week high, yet pulling back from intra-day highs. Color code is changed to yellow with new pivot point and max buy prices noted. It has repaired its 50 DMA violation and rebounded impressively since weak action it to be dropped from the Featured Stocks list on 7/08/09." A technical issue, however, left it listed in the lower portion of the mid-day report without the usual highlighting in yellow and isolation at the top of the report, while it also did not get added to the Featured Stocks page where members may view all currently featured stocks and their latest notes. If you have feedback or questions for us at any time, please use the inquiry form here. Thank you to our attentive members who called the matter to our attention!
The number of top-rated funds owning an interest in its shares rose from 20 funds in Dec '08 to 31 funds in Jun '09, which is reassuring concerning the L criteria. It has reported strong annual and quarterly earnings increases (good concerning the C & A criteria) backed by strong sales revenues increases. Return on Equity of +20% is above the +17% guideline. Keep in mind that the company is due to report earnings for the latest quarter after the market close on August 18th. Additionally, its progress could be hindered by future share offerings. This Chinese Computer Software firm filed a registration of approximately 16 million shares for resale not long ago, yet there have been no subsequent headlines concerning a proposed offering. LFT was first featured at $22.19 on Thursday, April 02, 2009 in the CANSLIM.net Mid Day Breakouts Report (read here).
|
|
|
Color Codes Explained :
Y - Better candidates highlighted by our
staff of experts.
G - Previously featured
in past reports as yellow but may no longer be buyable under the
guidelines.
***Last / Change / Volume quote data in this table corresponds with the timestamp on the note***
Symbol/Exchange
Company Name
Industry Group |
Last |
Chg. |
Vol
% DAV |
Date Featured |
Price Featured |
Latest Pivot Point
Featured |
Status |
| Latest Max Buy Price |
ASIA
-
|
$17.06
|
+0.31
|
981,618
124% DAV
790,100
|
8/2/2009
(Date
Featured) |
$19.27
(Price
Featured) |
PP = $22.19 |
G |
| MB = $23.30 |
Most Recent Note - 8/12/2009 4:17:37 PM
G - Halted its slide today after 5 consecutive losses drove it well below its 50 DMA line. It has not followed through with additional gains on volume, and instead, totally negated its big 7/30/09 gap up gain on heavy volume. Color code was changed to green, and it would need to rally above its recent highs in the $20 area for its outlook to improve. Recently featured in the August 2009 CANSLIM.net News here
There are no Featured Stock Updates™ available for this stock at this time. You may request one by clicking here
|
|
C
A
S
I |
News |
Chart |
SEC
View all notes Alert
me of new notes
Company
Profile
|
CPLA
- NASDAQ
Capella Education Co
DIVERSIFIED SERVICES - Education and Training Services
|
$63.67
|
+0.72
|
78,598
37% DAV
211,500
|
7/9/2009
(Date
Featured) |
$59.69
(Price
Featured) |
PP = $62.06 |
Y |
| MB = $65.16 |
Most Recent Note - 8/12/2009 4:19:12 PM
Y - Quietly hovering just -2% off its 52-week high, still above its pivot point. Featured in yellow in the 7/09/09 Mid-Day BreakOuts Report (read here). The Commercial Services-Schools Group has shown some leadership but has low ranks, and CPLA's Relative Strength rank has slumped to 66, under the 80+ guideline. Its small supply of only 13.9 million shares in the float could contribute to greater price volatility in the event of institutional accumulation or distribution. The number of top-rated funds owning an interest rose from 91 in Sept '08, to 133 as of March '09, which is reassuring with respect to the I criteria. It has a very good earnings history that satisfies the C & A criteria, while recent quarters showed steady sales revenues increases in the +17-18% range.
>>> The latest Featured Stock Update with an annotated graph appeared on 8/6/2009. click here.
|
|
C
A
S
I |
News |
Chart |
SEC
View all notes Alert
me of new notes
Company
Profile
|
GMCR
- NASDAQ
Green Mtn Coffee Roastrs
FOOD & BEVERAGE - Processed & Packaged Goods
|
$64.84
|
-1.00
|
1,460,585
93% DAV
1,571,300
|
7/17/2009
(Date
Featured) |
$60.15
(Price
Featured) |
PP = $63.79 |
G |
| MB = $66.98 |
Most Recent Note - 8/12/2009 4:20:15 PM
G - Consolidating just above its 50 DMA line after offering 5 million common shares at $67.25 apiece last week in a deal underwritten by BofA Merrill Lynch. Prior highs in the $62-63 area are initial chart support to watch above its 50 DMA line. Do not be confused by the 3:2 stock split effective 6/09/09. GMCR traded up more than +168% since appearing with an annotated graph under the headline "It May Soon Be Time To Go Green" when featured in the January 2009 CANSLIM.net News (read here).
>>> The latest Featured Stock Update with an annotated graph appeared on 7/30/2009. click here.
|
|
C
A
S
I |
News |
Chart |
SEC
View all notes Alert
me of new notes
Company
Profile
|
LFT
-
|
$31.57
|
+1.96
|
1,188,465
155% DAV
765,900
|
8/10/2009
(Date
Featured) |
$31.49
(Price
Featured) |
PP = $30.57 |
Y |
| MB = $32.10 |
Most Recent Note - 8/12/2009 7:10:15 PM
Y - Gain today with +55% above average volume while rallying back above its new pivot point for a new high close. New pivot point and max buy prices noted - be sure to read the latest FSU analysis! It has repaired its 50 DMA violation and rebounded impressively since weak action prompted it to be dropped from the Featured Stocks list on 7/08/09.
>>> The latest Featured Stock Update with an annotated graph appeared on 8/12/2009. click here.
|
|
C
A
S
I |
News |
Chart |
SEC
View all notes Alert
me of new notes
Company
Profile
|
NTES
- NASDAQ
Netease Inc Adr
INTERNET - Internet Information Providers
|
$46.65
|
+1.64
|
2,666,258
118% DAV
2,251,700
|
7/17/2009
(Date
Featured) |
$39.29
(Price
Featured) |
PP = $38.74 |
G |
| MB = $40.68 |
Most Recent Note - 8/12/2009 4:21:49 PM
G - Gain today on slightly above average volume for a new high close. Extended from its latest sound base, the nearest chart support is at its pivot point, 50 DMA line, and prior chart highs, all of which are in the $38 area. First featured at $26.75 in the 3/31/09 CANSLIM.net Mid-Day Breakouts Report (read here).
>>> The latest Featured Stock Update with an annotated graph appeared on 8/10/2009. click here.
|
|
C
A
S
I |
News |
Chart |
SEC
View all notes Alert
me of new notes
Company
Profile
|
NVEC
- NASDAQ
N V E Corp
ELECTRONICS - Semiconductor - Specialized
|
$51.66
|
-1.07
|
43,415
44% DAV
97,900
|
3/13/2009
(Date
Featured) |
$33.85
(Price
Featured) |
PP = $49.60 |
G |
| MB = $52.08 |
Most Recent Note - 8/11/2009 6:16:10 PM
G - Quietly consolidating above prior chart highs that are now an important support level above its 50 DMA line. Deterioration under its prior chart high ($49.50) would raise concerns. Featured in the 7/23/09 Mid-Day BreakOuts Report (read here) after it gapped up for a considerable gain on heavy volume following news of stronger sales revenues (+41%) and solid earnings increases for the quarter ended June 30, 2009. The technical action was described as a "breakaway gap" from a valid ascending base. Quarterly sales revenues in the 6 million dollar range are still rather minuscule, leaving concerns.
>>> The latest Featured Stock Update with an annotated graph appeared on 8/3/2009. click here.
|
|
C
A
S
I |
News |
Chart |
SEC
View all notes Alert
me of new notes
Company
Profile
|
PEGA
- NASDAQ
Pegasystems Inc
COMPUTER SOFTWARE & SERVICES - Business Software & Services
|
$30.35
|
+0.31
|
245,759
82% DAV
298,700
|
7/29/2009
(Date
Featured) |
$27.53
(Price
Featured) |
PP = $27.49 |
G |
| MB = $28.86 |
Most Recent Note - 8/12/2009 4:34:06 PM
G - Prior resistance in the mid-$27 area is an important technical support level to watch above its 50 DMA line while it is now consolidating. Considerable 8/05/09 gain with nearly 5 times average volume followed strong Q2 earnings and raised guidance. The high-ranked software firm triggered a technical buy signal when rising from the "double bottom" base when it was featured in the 7/29/09 mid-day report (read here).
>>> The latest Featured Stock Update with an annotated graph appeared on 8/11/2009. click here.
|
|
C
A
S
I |
News |
Chart |
SEC
View all notes Alert
me of new notes
Company
Profile
|
TNDM
- NASDAQ
Tandem Diabetes Care Inc
TELECOMMUNICATIONS - Wireless Communications
|
$27.24
|
+0.37
|
1,079,165
111% DAV
974,000
|
3/2/2009
(Date
Featured) |
$18.89
(Price
Featured) |
PP = $32.67 |
G |
| MB = $34.30 |
Most Recent Note - 8/12/2009 4:37:57 PM
G - Held its ground today, consolidating near its July chart lows. Its considerable loss on 8/10/09 with higher volume indicated more worrisome distributional pressure after its 8/06/09 violation of its 50 DMA line. Color code was changed to green after the technically damaging action negated its 8/03/09 breakout, raising concerns and triggering sell signals. It traded up as much as +82.95% since first featured at $18.89 in the 3/02/09 Mid-Day BreakOuts Report (read here).
>>> The latest Featured Stock Update with an annotated graph appeared on 8/5/2009. click here.
|
|
C
A
S
I |
News |
Chart |
SEC
View all notes Alert
me of new notes
Company
Profile
|
UTA
-
|
$14.92
|
+1.01
|
664,455
137% DAV
485,900
|
7/28/2009
(Date
Featured) |
$12.87
(Price
Featured) |
PP = $12.70 |
G |
| MB = $13.34 |
Most Recent Note - 8/12/2009 4:39:28 PM
G - Wider intra-day swings of late are a sign of uncertainty which raise concerns while it is consolidating above prior chart highs that were previously noted as "an important support level to watch on pullbacks." Strong action prompted it to be featured in yellow with pivot point and max buy levels noted in the 7/28/09 mid-day breakouts report (read here), with additional analysis included in the after market update (read here). This Chinese provider of airline tickets and travel related services gapped up on 7/28/09, rising from a choppy 6-week base with a considerable gain on very heavy volume.
>>> The latest Featured Stock Update with an annotated graph appeared on 8/7/2009. click here.
|
|
C
A
S
I |
News |
Chart |
SEC
View all notes Alert
me of new notes
Company
Profile
|
|
|
|
THESE ARE NOT BUY RECOMMENDATIONS!
Comments contained in the body of this report are technical
opinions only. The material herein has been obtained
from sources believed to be reliable and accurate, however,
its accuracy and completeness cannot be guaranteed.
This site is not an investment advisor, hence it does
not endorse or recommend any securities or other investments.
Any recommendation contained in this report may not
be suitable for all investors and it is not to be deemed
an offer or solicitation on our part with respect to
the purchase or sale of any securities. All trademarks,
service marks and trade names appearing in this report
are the property of their respective owners, and are
likewise used for identification purposes only.
This report is a service available
only to active Paid Premium Members.
You may opt-out of receiving report notifications
at any time. Questions or comments may be submitted
by writing to Premium Membership Services 665 S.E. 10 Street, Suite 201 Deerfield Beach, FL 33441-5634 or by calling 1-800-965-8307
or 954-785-1121.
|
|
|


