***Last / Change / Volume data in this table is the closing quote data***
Symbol/Exchange
Company Name
Industry Group |
PRICE |
CHANGE
(%Change) |
Day High |
Volume
(% DAV)
(% 50 day avg vol) |
52 Wk Hi
% From Hi |
Featured
Date |
Price
Featured |
Pivot Featured |
|
Max Buy |
AAPL
-
NASDAQ
Apple Inc
COMPUTER HARDWARE - Personal Computers
|
$250.19
|
-9.22
-3.55% |
$255.69
|
22,083,100
87.23% of 50 DAV
50 DAV is 25,317,100
|
$279.01
-10.33%
|
6/17/2010
|
$270.95
|
PP = $272.56
|
|
MB = $286.19
|
 Most Recent Note - 8/11/2010 5:05:12 PM
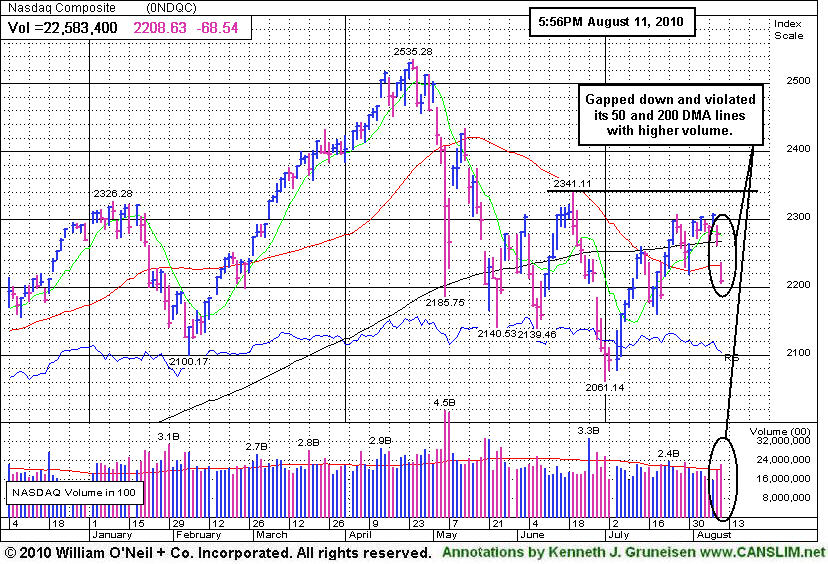
G - Gapped down today amid broad-based market weakness, slumping below its 50 DMA line and raising concerns. Color code is changed to green based on the deterioration, and it would need to rally above its recent high near $266 for its outlook to improve. Recent chart low ($239) defines an important support level.
>>> The latest Featured Stock Update with an annotated graph appeared on 8/9/2010. Click here.
View all notes |
Alert me of new notes |
CANSLIM.net Company Profile |
SEC |
Zacks Reports |
StockTalk |
News |
Chart |
Request a new note
C
A N
S L
I M


|
ABV
-
NYSE
Comp De Bebidas Adr
FOOD and BEVERAGE - Beverages - Brewers
|
$103.82
|
-1.95
-1.84% |
$105.23
|
372,106
54.69% of 50 DAV
50 DAV is 680,400
|
$112.60
-7.80%
|
6/29/2010
|
$104.74
|
PP = $109.33
|
|
MB = $114.80
|
Most Recent Note - 8/11/2010 5:09:25 PM
G - This Brazil-based beverage firm closed under its 50 DMA line with a loss today on light volume. Color code is changed to green. It churned a lot of volume last week without making progress above prior chart highs.
>>> The latest Featured Stock Update with an annotated graph appeared on 7/20/2010. Click here.
View all notes |
Alert me of new notes |
CANSLIM.net Company Profile |
SEC |
Zacks Reports |
StockTalk |
News |
Chart |
Request a new note
C
A N
S L
I M
|
BIDU
-
NASDAQ
Baidu Inc Ads
INTERNET - Internet Information Providers
|
$84.23
|
-3.64
-4.14% |
$86.35
|
11,789,235
101.11% of 50 DAV
50 DAV is 11,660,100
|
$88.32
-4.63%
|
7/14/2010
|
$75.03
|
PP = $78.59
|
|
MB = $82.52
|
Most Recent Note - 8/11/2010 12:18:52 PM
G - Gapped down from an all-time high today amid broad-based market weakness, pulling back toward its "max buy" level. Recently wedged above prior highs without great volume conviction. No overhead supply remains to act as resistance, and it could go on to produce more climactic gains.
>>> The latest Featured Stock Update with an annotated graph appeared on 7/14/2010. Click here.
View all notes |
Alert me of new notes |
CANSLIM.net Company Profile |
SEC |
Zacks Reports |
StockTalk |
News |
Chart |
Request a new note
C
A N
S L
I M
|
CACC
-
NASDAQ
Credit Acceptance Corp
FINANCIAL SERVICES - Credit Services
|
$58.14
|
-0.22
-0.38% |
$58.21
|
57,790
110.92% of 50 DAV
50 DAV is 52,100
|
$59.75
-2.69%
|
7/29/2010
|
$52.04
|
PP = $54.07
|
|
MB = $56.77
|
Most Recent Note - 8/11/2010 5:12:42 PM
G - Stubbornly holding its ground today near its 52-week high after getting extended from its base with recent gains on above average volume. Prior highs in the $54 area define initial chart support to watch.
>>> The latest Featured Stock Update with an annotated graph appeared on 8/2/2010. Click here.
View all notes |
Alert me of new notes |
CANSLIM.net Company Profile |
SEC |
Zacks Reports |
StockTalk |
News |
Chart |
Request a new note
C
A N
S L
I M
|
CRM
-
NYSE
Salesforce.Com Inc
INTERNET - Internet Software and Services
|
$97.91
|
-3.74
-3.68% |
$99.25
|
2,445,800
100.09% of 50 DAV
50 DAV is 2,443,500
|
$104.44
-6.25%
|
6/2/2010
|
$88.44
|
PP = $89.60
|
|
MB = $94.08
|
Most Recent Note - 8/11/2010 11:57:11 AM
G - Gapped down today from an all-time high amid broad-based market weakness after recently wedging above prior highs near $97 with gains lacking volume conviction.
>>> The latest Featured Stock Update with an annotated graph appeared on 7/15/2010. Click here.
View all notes |
Alert me of new notes |
CANSLIM.net Company Profile |
SEC |
Zacks Reports |
StockTalk |
News |
Chart |
Request a new note
C
A N
S L
I M
|
Symbol/Exchange
Company Name
Industry Group |
PRICE |
CHANGE
(%Change) |
Day High |
Volume
(% DAV)
(% 50 day avg vol) |
52 Wk Hi
% From Hi |
Featured
Date |
Price
Featured |
Pivot Featured |
|
Max Buy |
DTSI
-
NASDAQ
D T S Inc
CONSUMER DURABLES - Electronic Equipment
|
$34.75
|
-1.29
-3.58% |
$36.25
|
148,430
153.50% of 50 DAV
50 DAV is 96,700
|
$37.60
-7.58%
|
7/27/2010
|
$37.00
|
PP = $36.28
|
|
MB = $38.09
|
Most Recent Note - 8/11/2010 5:15:51 PM
G - Second consecutive loss today with above average volume, completely negating its recent breakout and sinking near its 50 DMA line. The high-ranked Consumer Products - Electronic firm's latest quarter ended June 30, 2010 showed earnings -67% on -28% sales revenues versus the year ago period. The fundamental flaw in its earnings history is very disappointing with respect to the C criteria now, and its color code was changed to green.
>>> The latest Featured Stock Update with an annotated graph appeared on 7/27/2010. Click here.
View all notes |
Alert me of new notes |
CANSLIM.net Company Profile |
SEC |
Zacks Reports |
StockTalk |
News |
Chart |
Request a new note
C
A N
S L
I M
|
FFIV
-
NASDAQ
F 5 Networks Inc
INTERNET - Internet Software and Services
|
$86.82
|
-5.41
-5.87% |
$89.94
|
2,271,465
133.48% of 50 DAV
50 DAV is 1,701,700
|
$92.70
-6.34%
|
6/16/2010
|
$74.50
|
PP = $74.10
|
|
MB = $77.81
|
Most Recent Note - 8/11/2010 11:31:33 AM
G - Gapped down today amid broad-based market weakness, pulling back from all-time highs. Recently noted as -"extended from any sound base after recent volume-driven gains, it could go on to produce more climactic gains."
>>> The latest Featured Stock Update with an annotated graph appeared on 8/4/2010. Click here.
View all notes |
Alert me of new notes |
CANSLIM.net Company Profile |
SEC |
Zacks Reports |
StockTalk |
News |
Chart |
Request a new note
C
A N
S L
I M
|
FOSL
-
NASDAQ
Fossil Inc
CONSUMER DURABLES - Recreational Goods, Other
|
$44.18
|
-1.66
-3.62% |
$45.12
|
714,241
85.90% of 50 DAV
50 DAV is 831,500
|
$46.30
-4.58%
|
8/10/2010
|
$45.54
|
PP = $42.69
|
|
MB = $44.82
|
Most Recent Note - 8/11/2010 12:01:46 PM
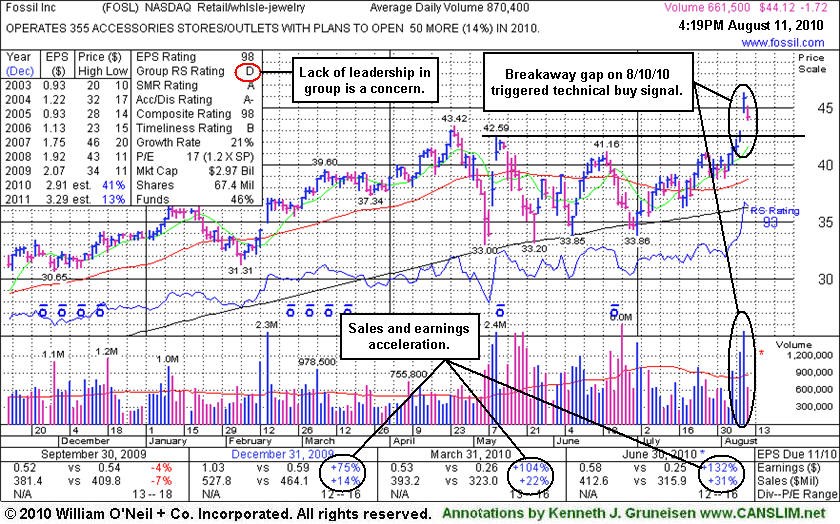
Y - Down today, pulling back below its "max buy" level amid broad-based market weakness following a considerable "breakaway gap" for a new 52-week high and all-time high. It faces no resistance due to overhead supply after triggering a technical buy signal. FOSL was featured in yellow in the 8/10/10 mid-day report (read here). Sales revenues and earnings increases showed impressive acceleration in the 3 latest quarters (Dec '09, Mar and Jun '10) following a streak of 4 negative comparisons versus the year ago period. The lack of leadership in the Retail/Wholesale - Jewelry group (L criteria) is a concern.
>>> The latest Featured Stock Update with an annotated graph appeared on 8/11/2010. Click here.
View all notes |
Alert me of new notes |
CANSLIM.net Company Profile |
SEC |
Zacks Reports |
StockTalk |
News |
Chart |
Request a new note
C
A N
S L
I M
|
MELI
-
NASDAQ
Mercadolibre Inc
INTERNET - Internet Software and; Services
|
$65.62
|
-2.19
-3.23% |
$66.26
|
940,871
90.48% of 50 DAV
50 DAV is 1,039,900
|
$68.67
-4.44%
|
5/13/2010
|
$54.21
|
PP = $55.85
|
|
MB = $58.64
|
Most Recent Note - 8/11/2010 5:20:51 PM
G - Pulling back on light volume after gains on higher volume, it closed near its session high today. Consolidating after getting extended from any sound base, prior highs in the $62 area define initial chart support.
>>> The latest Featured Stock Update with an annotated graph appeared on 7/23/2010. Click here.
View all notes |
Alert me of new notes |
CANSLIM.net Company Profile |
SEC |
Zacks Reports |
StockTalk |
News |
Chart |
Request a new note
C
A N
S L
I M
|
MWIV
-
NASDAQ
M W I Veterinary Supply
HEALTH SERVICES - Medical Instruments and; Supplies
|
$48.17
|
-2.23
-4.42% |
$50.43
|
128,006
174.40% of 50 DAV
50 DAV is 73,400
|
$54.48
-11.58%
|
7/29/2010
|
$52.05
|
PP = $52.09
|
|
MB = $54.69
|
Most Recent Note - 8/11/2010 11:34:44 AM
G - Violated its 50 DMA line with another considerable loss today raising concerns, and its color code is changed to green. Recent lows in the $46 area define the next chart support level below its short-term average.
>>> The latest Featured Stock Update with an annotated graph appeared on 7/30/2010. Click here.
View all notes |
Alert me of new notes |
CANSLIM.net Company Profile |
SEC |
Zacks Reports |
StockTalk |
News |
Chart |
Request a new note
C
A N
S L
I M
|
Symbol/Exchange
Company Name
Industry Group |
PRICE |
CHANGE
(%Change) |
Day High |
Volume
(% DAV)
(% 50 day avg vol) |
52 Wk Hi
% From Hi |
Featured
Date |
Price
Featured |
Pivot Featured |
|
Max Buy |
NEM
-
NYSE
Newmont Mining Corp
METALS and MINING - Gold
|
$56.04
|
-1.36
-2.37% |
$57.72
|
5,557,283
66.91% of 50 DAV
50 DAV is 8,305,500
|
$63.38
-11.58%
|
6/22/2010
|
$59.60
|
PP = $59.67
|
|
MB = $62.65
|
Most Recent Note - 8/11/2010 5:27:14 PM
G - Volume totals have been light while it has sputtered below its 50 DMA line for the past 2 weeks. Gains above that short-term average would help its outlook improve.
>>> The latest Featured Stock Update with an annotated graph appeared on 8/6/2010. Click here.
View all notes |
Alert me of new notes |
CANSLIM.net Company Profile |
SEC |
Zacks Reports |
StockTalk |
News |
Chart |
Request a new note
C
A N
S L
I M
|
NEOG
-
NASDAQ
Neogen Corp
DRUGS - Diagnostic Substances
|
$27.50
|
-0.76
-2.69% |
$28.00
|
119,116
128.22% of 50 DAV
50 DAV is 92,900
|
$30.39
-9.51%
|
7/22/2010
|
$27.19
|
PP = $27.87
|
|
MB = $29.26
|
Most Recent Note - 8/10/2010 1:12:49 PM
Y - Pulling back toward prior highs in the $27 area defining near-term chart support to watch.
>>> The latest Featured Stock Update with an annotated graph appeared on 7/22/2010. Click here.
View all notes |
Alert me of new notes |
CANSLIM.net Company Profile |
SEC |
Zacks Reports |
StockTalk |
News |
Chart |
Request a new note
C
A N
S L
I M
|
NFLX
-
NASDAQ
Netflix Inc
SPECIALTY RETAIL - Music and Video Stores
|
$126.47
|
+1.46
1.17% |
$128.41
|
10,191,256
284.83% of 50 DAV
50 DAV is 3,578,000
|
$127.96
-1.16%
|
8/10/2010
|
$124.05
|
PP = $124.00
|
|
MB = $130.20
|
Most Recent Note - 8/11/2010 12:55:41 PM
Y - Encountering some distributional pressure yet it touched a new all-time high today. Its 8/10/10 gain with more than 3 times average volume lifted it above the pivot point after an 8-week "double bottom" base, and it may be considered a late-stage technical breakout. Featured in yellow in the 8/10/10 mid-day report (read here) and it was recently noted in the 6/16/10 and 5/13/10 mid-day reports - "Look of a possible 'climax run' in the making. Since its latest strong quarterly report it has been noted as very strong in terms of key investment criteria. NFLX rebounded impressively since it was dropped from the Featured Stocks list on 6/02/09 based on persistent trading under its 50 DMA line. It was first featured in yellow at $37.13 in the 1/29/09 CANSLIM.net Mid-Day Breakouts Report (read here). "
>>> The latest Featured Stock Update with an annotated graph appeared on 8/10/2010. Click here.
View all notes |
Alert me of new notes |
CANSLIM.net Company Profile |
SEC |
Zacks Reports |
StockTalk |
News |
Chart |
Request a new note
C
A N
S L
I M
|
ROVI
-
NASDAQ
Rovi Corp
COMPUTER SOFTWARE andamp; SERVICES - Security Software andamp; Services
|
$42.19
|
-1.51
-3.46% |
$42.94
|
700,315
58.75% of 50 DAV
50 DAV is 1,192,100
|
$44.96
-6.16%
|
6/3/2010
|
$38.70
|
PP = $40.16
|
|
MB = $42.17
|
Most Recent Note - 8/11/2010 12:12:18 PM
Y - Gapped down today amid broad-based market weakness, dipping under its "max buy" level toward recent chart lows. Color code is changed to yellow. Prior highs in the $40 area and its 50 DMA line define chart support.
>>> The latest Featured Stock Update with an annotated graph appeared on 7/21/2010. Click here.
View all notes |
Alert me of new notes |
CANSLIM.net Company Profile |
SEC |
Zacks Reports |
StockTalk |
News |
Chart |
Request a new note
C
A N
S L
I M
|
SHOO
-
NASDAQ
Steven Madden Limited
CONSUMER NON-DURABLES - Textile - Apparel Footwear
|
$36.00
|
-2.35
-6.13% |
$37.56
|
666,328
161.14% of 50 DAV
50 DAV is 413,500
|
$40.98
-12.15%
|
8/5/2010
|
$39.55
|
PP = $41.08
|
|
MB = $43.13
|
Most Recent Note - 8/11/2010 11:40:28 AM
Y - Gapped down today amid broad-based market weakness, forming a handle after a 16-week cup shaped pattern. A technical breakout above the $40 threshold would trigger a buy signal, meanwhile it is ideal for disciplined investors' watchlists.
>>> The latest Featured Stock Update with an annotated graph appeared on 8/5/2010. Click here.
View all notes |
Alert me of new notes |
CANSLIM.net Company Profile |
SEC |
Zacks Reports |
StockTalk |
News |
Chart |
Request a new note
C
A N
S L
I M
|
Symbol/Exchange
Company Name
Industry Group |
PRICE |
CHANGE
(%Change) |
Day High |
Volume
(% DAV)
(% 50 day avg vol) |
52 Wk Hi
% From Hi |
Featured
Date |
Price
Featured |
Pivot Featured |
|
Max Buy |
ULTA
-
NASDAQ
Ulta Salon Cosm & Frag
SPECIALTY RETAIL - Specialty Retail, Other
|
$22.95
|
-1.14
-4.73% |
$23.90
|
495,606
68.81% of 50 DAV
50 DAV is 720,300
|
$26.75
-14.21%
|
8/4/2010
|
$24.90
|
PP = $26.85
|
|
MB = $28.19
|
Most Recent Note - 8/11/2010 11:43:11 AM
G - Today's 7th consecutive loss has led to a 50 DMA line violation and its color code is changed to green. It would need to rally above the new pivot point cited with volume conviction to trigger a proper technical buy signal.
>>> The latest Featured Stock Update with an annotated graph appeared on 7/19/2010. Click here.
View all notes |
Alert me of new notes |
CANSLIM.net Company Profile |
SEC |
Zacks Reports |
StockTalk |
News |
Chart |
Request a new note
C
A N
S L
I M
|
VIT
-
NYSE
Vanceinfo Tech Inc Ads
COMPUTER SOFTWARE and SERVICES - Business Software and Services
|
$26.30
|
-1.49
-5.36% |
$27.53
|
688,687
140.49% of 50 DAV
50 DAV is 490,200
|
$27.96
-5.94%
|
7/8/2010
|
$25.20
|
PP = $26.58
|
|
MB = $27.91
|
Most Recent Note - 8/11/2010 11:45:46 AM
Y - Pulling back considerably today amid broad-based market weakness after recently wedging to new all-time highs with gains on lighter than average volume. It has not triggered a confirming buy signal with volume yet since featured in the 7/08/10 mid-day report. Its 7/29/10 low ($24.55) defines initial support above its 50 DMA line.
>>> The latest Featured Stock Update with an annotated graph appeared on 7/26/2010. Click here.
View all notes |
Alert me of new notes |
CANSLIM.net Company Profile |
SEC |
Zacks Reports |
StockTalk |
News |
Chart |
Request a new note
C
A N
S L
I M
|