You are not logged in.
This means you
CAN ONLY VIEW reports that were published prior to Monday, April 14, 2025.
You
MUST UPGRADE YOUR MEMBERSHIP if you want to see any current reports.
AFTER MARKET UPDATE - TUESDAY, AUGUST 11TH, 2009
Previous After Market Report Next After Market Report >>>
|
|
|
|
DOW |
-96.50 |
9,241.45 |
-1.03% |
|
Volume |
1,197,925,790 |
+10% |
|
Volume |
2,016,579,280 |
+6% |
|
NASDAQ |
-22.51 |
1,969.73 |
-1.13% |
|
Advancers |
789 |
25% |
|
Advancers |
751 |
26% |
|
S&P 500 |
-12.75 |
994.35 |
-1.27% |
|
Decliners |
2,234 |
72% |
|
Decliners |
1,967 |
69% |
|
Russell 2000 |
-9.75 |
562.12 |
-1.70% |
|
52 Wk Highs |
60 |
|
|
52 Wk Highs |
33 |
|
|
S&P 600 |
-4.96 |
299.02 |
-1.63% |
|
52 Wk Lows |
1 |
|
|
52 Wk Lows |
8 |
|
|
 |
Breadth Poor As Major Indices Encounter Distributional Pressure
Adam Sarhan, Contributing Writer,
The major averages fell on Tuesday, led lower by financials, while a flurry of downgrades hurt stocks. Volume totals reported on the NYSE and Nasdaq exchange were higher than the prior session totals, which technically made it a distribution day. Additionally, breadth was poor as decliners led advancers by about a 3-to-1 ratio on the NYSE and on the Nasdaq exchange. There were 23 high-ranked companies from the CANSLIM.net Leaders List that made a new 52-week high and appeared on the CANSLIM.net BreakOuts Page, down from the 26 issues that appeared on the prior session. On both exchanges new 52-week highs still significantly outnumbered 52-week lows, and new lows were in the single digits again.
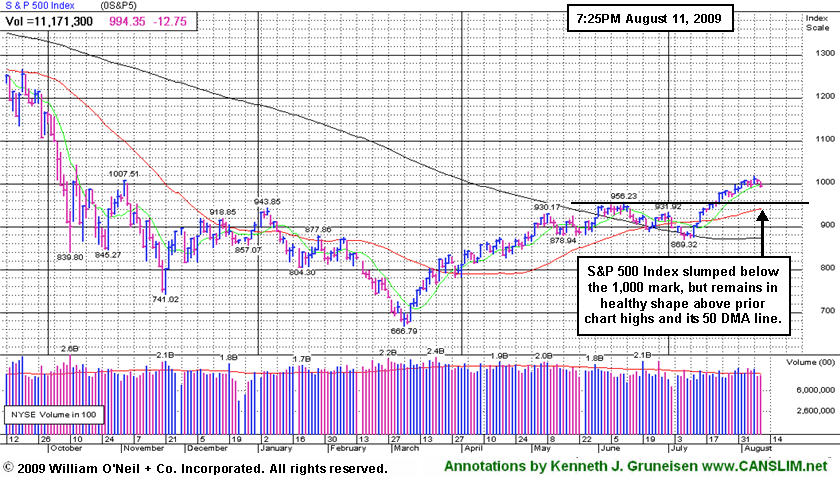
CIT Group (CIT -18.92%) was among the weak performers in the financial sector after it delayed reporting its latest results. Meanwhile, MBIA Inc (MBIA -12.64%), the country's largest bond insurer, plunged after an analyst from JPMorgan Chase & Co (JPM -3.40%) lowered the stock to a rating of "underweight." These disappointments coupled with negative comments from famous bank analyst Dick Bove sent a slew of financials lower on Tuesday. Bove, a famous banking analyst, said he expects shares of lenders to retreat after their recent gains. Remember, financial stocks were one of the strongest industry groups that led the market higher since the March lows. The fact that they sold off today was not an unexpected surprise after such an impressive recovery. However, additional distribution days for the major averages could start to spell trouble for the aging rally.
News on the earnings front remains strong but is now largely behind us as the vast majority of stocks have already released their Q2 results. According to Bloomberg.com, so far, earnings have topped analysts’ estimates by at least +10% on average for the 450 companies in the S&P 500 that released results. Even thought earnings were above estimates they were still down some -30% last quarter. That was a record eighth straight quarterly decline of earnings. The sales fell on average -16%. Remember that the market is a forward looking mechanism which means that the recent rally illustrates investors' collective outlook for a strong recovery (i.e. future earnings). At this point, it is wise to continue to watch your stocks and remain cautious until this correction has run its course and a new batch of leaders begin triggering fresh technical buy signals.
PICTURED: The S&P 500 Index slumped below the 1,000 mark, but the benchmark remains in healthy shape above prior chart highs and its 50-day moving average (DMA) line.
|
|
|
 |
Financial, Commodity-Linked, and Tech Groups Fared Worst
Kenneth J. Gruneisen - Passed the CAN SLIM® Master's Exam
Commodity-linked groups and financial shares were among Tuesday's weakest areas. The Oil Services Index ($OSX -2.19%), Integrated Oil Index ($XOI -1.32%), and Gold & Silver Index ($XAU -1.63%) slumped. The Bank Index ($BKX -4.35%) was hit worse than the Broker/Dealer Index ($XBD -1.87%), and both influential financial indexes had a negative influence on the major averages along with a modestly lower Retail Index ($RLX -0.44%). The tech sector also mostly ended lower as the Networking Index ($NWX -1.57%), Semiconductor Index ($SOX -1.43%), and Internet Index ($IIX -1.11%) lost ground. Meanwhile, the Healthcare Index ($HMO -0.02%) and Biotechnology Index ($BTK +0.10%) were relative leaders by simply holding their ground.
Charts courtesy www.stockcharts.com
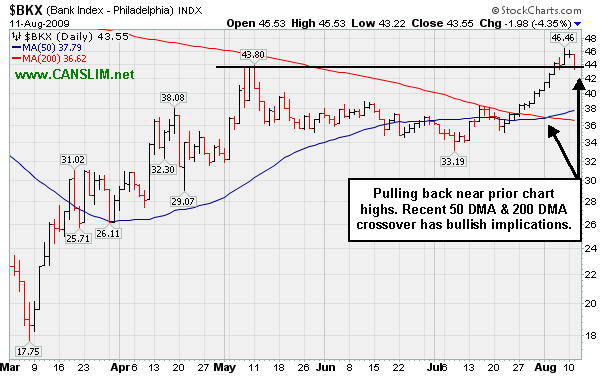
PICTURED: The Bank Index ($BKX -4.35%) sank back near prior chart highs. After its steady streak of gains a pullback is no surprise. The recent bullish 50-day & 200-day moving average line crossover indicates near-term strength which is an encouraging sign that bodes well.
| Oil Services |
$OSX |
168.17 |
-3.76 |
-2.19% |
+38.54% |
| Healthcare |
$HMO |
1,162.62 |
-0.26 |
-0.02% |
+21.08% |
| Integrated Oil |
$XOI |
945.66 |
-12.63 |
-1.32% |
-3.47% |
| Semiconductor |
$SOX |
290.74 |
-4.21 |
-1.43% |
+37.03% |
| Networking |
$NWX |
197.08 |
-3.15 |
-1.57% |
+36.97% |
| Internet |
$IIX |
201.33 |
-2.25 |
-1.11% |
+50.50% |
| Broker/Dealer |
$XBD |
108.52 |
-2.07 |
-1.87% |
+40.08% |
| Retail |
$RLX |
363.71 |
-1.59 |
-0.44% |
+30.24% |
| Gold & Silver |
$XAU |
143.53 |
-2.38 |
-1.63% |
+15.89% |
| Bank |
$BKX |
43.55 |
-1.98 |
-4.35% |
-1.74% |
| Biotech |
$BTK |
860.16 |
+0.88 |
+0.10% |
+32.91% |
|
|
|
 |
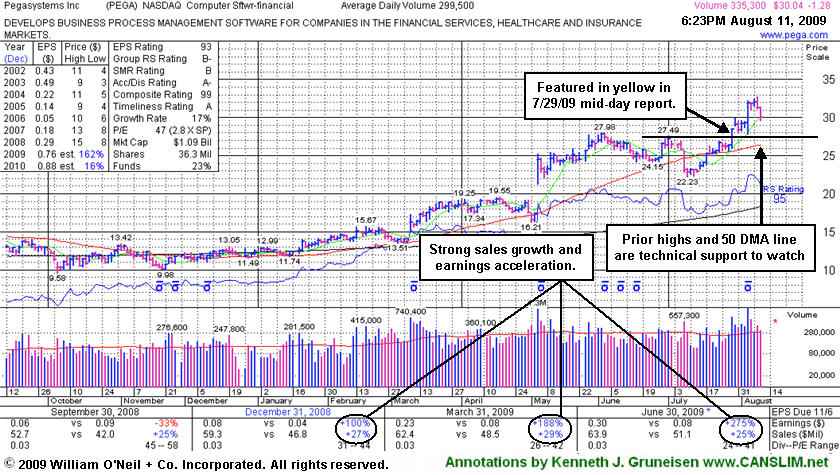
Normal Consolidation After Getting A Bit Extended
Kenneth J. Gruneisen - Passed the CAN SLIM® Master's Exam
Pegasystems Inc (PEGA -$1.28 or -4.09% to $30.04) gapped down for a loss today on lighter volume following a negative reversal after hitting a new high on the prior session. It is still extended from its latest base and above its "max buy" level. Note that studies have shown that approximately 40% of successful breakouts pull back and re-test their pivot points before continuing higher. Prior chart highs which were resistance in the mid-$27 area are now a very important technical support level to watch, and they come into play above its 50-day moving average line (now $26.39). It posted a considerable 8/05/09 gain with nearly 5 times average volume following strong Q2 earnings and raised guidance. That was a confirming follow-through gain after the high-ranked software firm had first triggered a technical buy signal when rising from the "double bottom" base on the day it was featured in the 7/29/09 mid-day report (read here).
Disciplined investors avoid chasing stocks extended more than +5% above their pivot point, and once any new buys are made, those stocks are quickly sold if they fall more than -7% from the buy price. Investors who typically enter stop-loss order -7% below their buy price might raise their stop losses and not be willing to give the stock as much room to the downside now. However, after having seen it trade as much as +19% above its pivot point, also keep in mind a rule of the investment system that says a stock which rallies more than +20% in the first 2-3 weeks after it was bought should be held for a minimum of 8 weeks and given a chance to produce more substantial gains. It may be worthwhile to occasionally review past trades to see if you have a tendency to let losing positions get out of control, chase stocks and buy them too late, or jump the gun and buy them before they have triggered a proper breakout from a sound base pattern. Being ultra-careful in regard to entries and exits provides no guarantee that investors will reap huge profits, however, undisciplined buying and selling decisions will obviously hurt your chances of having great success.
During its last base, the second low was a "lower low" which provided the necessary "shakeout" which is an important characteristic of a proper double bottom pattern. The heavy volume behind its breakout easily met the minimum +50% above average volume guideline of the investment system for a proper breakout. The high-ranked Computer Software - Financial firm has shown solid sales revenues increases and +25% earnings increases and 3 of last 4 quarterly comparisons versus the year ago period. The previously noted downturn in annual earnings (the A criteria) from 2003 to 2006 has been followed by a solid turn around and big earnings increases in '07 and '08, and Street expectations for '09 are calling for well above +25% growth.
|
|
|
Color Codes Explained :
Y - Better candidates highlighted by our
staff of experts.
G - Previously featured
in past reports as yellow but may no longer be buyable under the
guidelines.
***Last / Change / Volume quote data in this table corresponds with the timestamp on the note***
Symbol/Exchange
Company Name
Industry Group |
Last |
Chg. |
Vol
% DAV |
Date Featured |
Price Featured |
Latest Pivot Point
Featured |
Status |
| Latest Max Buy Price |
ASIA
-
|
$16.75
|
-1.16
|
1,234,269
157% DAV
784,100
|
8/2/2009
(Date
Featured) |
$19.27
(Price
Featured) |
PP = $22.19 |
G |
| MB = $23.30 |
Most Recent Note - 8/11/2009 6:09:13 PM
G - Considerable loss today on above average volume was its 5th consecutive loss, driving it further below its 50 DMA line. It has not followed through with additional gains on volume since since its big 7/30/09 gap up gain on heavy volume. Color code was changed to green, and it would need to rally above its recent highs in the $20 area for its outlook to improve. Recently featured in the August 2009 CANSLIM.net News here
There are no Featured Stock Updates™ available for this stock at this time. You may request one by clicking here
|
|
C
A
S
I |
News |
Chart |
SEC
View all notes Alert
me of new notes
Company
Profile
|
CPLA
- NASDAQ
Capella Education Co
DIVERSIFIED SERVICES - Education and Training Services
|
$62.95
|
-1.38
|
99,921
46% DAV
216,000
|
7/9/2009
(Date
Featured) |
$59.69
(Price
Featured) |
PP = $62.06 |
Y |
| MB = $65.16 |
Most Recent Note - 8/11/2009 6:11:21 PM
Y - Fell today on lighter volume while consolidating near its 52-week high, still above its pivot point. Featured in yellow in the 7/09/09 Mid-Day BreakOuts Report (read here). The Commercial Services-Schools Group has shown some leadership but has low ranks, and CPLA's Relative Strength rank has slumped to 70, under the 80+ guideline. Its small supply of only 13.9 million shares in the float could contribute to greater price volatility in the event of institutional accumulation or distribution. The number of top-rated funds owning an interest rose from 91 in Sept '08, to 133 as of March '09, which is reassuring with respect to the I criteria. It has a very good earnings history that satisfies the C & A criteria, while recent quarters showed steady sales revenues increases in the +17-18% range.
>>> The latest Featured Stock Update with an annotated graph appeared on 8/6/2009. click here.
|
|
C
A
S
I |
News |
Chart |
SEC
View all notes Alert
me of new notes
Company
Profile
|
GMCR
- NASDAQ
Green Mtn Coffee Roastrs
FOOD & BEVERAGE - Processed & Packaged Goods
|
$65.84
|
-2.14
|
1,246,234
79% DAV
1,571,200
|
7/17/2009
(Date
Featured) |
$60.15
(Price
Featured) |
PP = $63.79 |
G |
| MB = $66.98 |
Most Recent Note - 8/11/2009 6:12:15 PM
G - Pulling back on lighter volume after offering 5 million common shares at $67.25 apiece last week in a deal underwritten by BofA Merrill Lynch. Prior highs in the $62-63 area are initial chart support to watch above its 50 DMA line. Do not be confused by the 3:2 stock split effective 6/09/09. GMCR traded up more than +168% since appearing with an annotated graph under the headline "It May Soon Be Time To Go Green" when featured in the January 2009 CANSLIM.net News (read here).
>>> The latest Featured Stock Update with an annotated graph appeared on 7/30/2009. click here.
|
|
C
A
S
I |
News |
Chart |
SEC
View all notes Alert
me of new notes
Company
Profile
|
LFT
-
|
$31.49
|
+3.49
|
2,338,103
332% DAV
704,600
|
8/10/2009
(Date
Featured) |
$31.49
(Price
Featured) |
PP = $30.57 |
Y |
| MB = $32.10 |
Most Recent Note - 8/10/2009 1:18:43 PM
Y - Gapped up today and rallied for a considerable gain with heavy volume, reaching a new 52-week high, yet pulling back from intra-day highs. Color code is changed to yellow with new pivot point and max buy prices noted. It has repaired its 50 DMA violation and rebounded impressively since weak action it will be dropped from the Featured Stocks list on 7/08/09.
>>> The latest Featured Stock Update with an annotated graph appeared on 7/1/2009. click here.
|
|
C
A
S
I |
News |
Chart |
SEC
View all notes Alert
me of new notes
Company
Profile
|
NTES
- NASDAQ
Netease Inc Adr
INTERNET - Internet Information Providers
|
$45.01
|
-0.35
|
1,889,484
83% DAV
2,285,100
|
7/17/2009
(Date
Featured) |
$39.29
(Price
Featured) |
PP = $38.74 |
G |
| MB = $40.68 |
Most Recent Note - 8/11/2009 6:14:25 PM
G - Negatively reversed after early gains today helped it hit a new high, ultimately closing with a loss on below average volume. Still extended from its latest sound base, the nearest chart support is at its pivot point, 50 DMA line, and prior chart highs, all of which are in the $38 area. First featured at $26.75 in the 3/31/09 CANSLIM.net Mid-Day Breakouts Report (read here).
>>> The latest Featured Stock Update with an annotated graph appeared on 8/10/2009. click here.
|
|
C
A
S
I |
News |
Chart |
SEC
View all notes Alert
me of new notes
Company
Profile
|
NVEC
- NASDAQ
N V E Corp
ELECTRONICS - Semiconductor - Specialized
|
$51.66
|
-1.07
|
43,415
44% DAV
97,900
|
3/13/2009
(Date
Featured) |
$33.85
(Price
Featured) |
PP = $49.60 |
G |
| MB = $52.08 |
Most Recent Note - 8/11/2009 6:16:10 PM
G - Quietly consolidating above prior chart highs that are now an important support level above its 50 DMA line. Deterioration under its prior chart high ($49.50) would raise concerns. Featured in the 7/23/09 Mid-Day BreakOuts Report (read here) after it gapped up for a considerable gain on heavy volume following news of stronger sales revenues (+41%) and solid earnings increases for the quarter ended June 30, 2009. The technical action was described as a "breakaway gap" from a valid ascending base. Quarterly sales revenues in the 6 million dollar range are still rather minuscule, leaving concerns.
>>> The latest Featured Stock Update with an annotated graph appeared on 8/3/2009. click here.
|
|
C
A
S
I |
News |
Chart |
SEC
View all notes Alert
me of new notes
Company
Profile
|
PEGA
- NASDAQ
Pegasystems Inc
COMPUTER SOFTWARE & SERVICES - Business Software & Services
|
$30.04
|
-1.28
|
337,749
114% DAV
296,400
|
7/29/2009
(Date
Featured) |
$27.53
(Price
Featured) |
PP = $27.49 |
G |
| MB = $28.86 |
Most Recent Note - 8/11/2009 6:29:29 PM
G - Small gap down for a loss today on lighter volume following a negative reversal after hitting a new high on the prior session. It is still extended from its latest base and above its "max buy" level. Prior chart highs which were resistance in the mid- $27 area are now an important technical support level to watch above its 50 DMA line. Considerable 8/05/09 gain with nearly 5 times average volume followed strong Q2 earnings and raised guidance. The high-ranked software firm triggered a technical buy signal when rising from the "double bottom" base when it was featured in the 7/29/09 mid-day report (read here). The previously noted downturn in annual earnings (the A criteria) from 2003 to 2006 has been followed by a solid turn around and big earnings increases in '07 and '08, and Street expectations for '09 are calling for well above +25% growth.
>>> The latest Featured Stock Update with an annotated graph appeared on 8/11/2009. click here.
|
|
C
A
S
I |
News |
Chart |
SEC
View all notes Alert
me of new notes
Company
Profile
|
TNDM
- NASDAQ
Tandem Diabetes Care Inc
TELECOMMUNICATIONS - Wireless Communications
|
$26.87
|
-0.16
|
1,160,990
119% DAV
973,100
|
3/2/2009
(Date
Featured) |
$18.89
(Price
Featured) |
PP = $32.67 |
G |
| MB = $34.30 |
Most Recent Note - 8/11/2009 6:32:19 PM
G - Down again today on lighter volume near its average total. Its considerable loss on 8/1/09 with higher volume indicated more worrisome distributional pressure after it made a stand near its 50 DMA line on Friday. Color code was changed to green after the technically damaging action negated its 8/03/09 breakout, raising concerns and triggering sell signals. As previously noted, "a prompt show of support repairing the 50 DMA breach is necessary to help its outlook, otherwise the odds favor that it will spend more time consolidating and it could encounter more distributional pressure." It traded up as much as +82.95% since first featured at $18.89 in the 3/02/09 Mid-Day BreakOuts Report (read here).
>>> The latest Featured Stock Update with an annotated graph appeared on 8/5/2009. click here.
|
|
C
A
S
I |
News |
Chart |
SEC
View all notes Alert
me of new notes
Company
Profile
|
UTA
-
|
$13.91
|
-1.31
|
481,204
103% DAV
465,700
|
7/28/2009
(Date
Featured) |
$12.87
(Price
Featured) |
PP = $12.70 |
G |
| MB = $13.34 |
Most Recent Note - 8/11/2009 6:46:43 PM
G - Consolidating above prior chart highs that were previously noted as "an important support level to watch on pullbacks." Strong action prompted it to be featured in yellow with pivot point and max buy levels noted in the 7/28/09 mid-day breakouts report (read here), with additional analysis included in the after market update (read here). This Chinese provider of airline tickets and travel related services gapped up on 7/28/09, rising from a choppy 6-week base with a considerable gain on very heavy volume.
>>> The latest Featured Stock Update with an annotated graph appeared on 8/7/2009. click here.
|
|
C
A
S
I |
News |
Chart |
SEC
View all notes Alert
me of new notes
Company
Profile
|
|
|
|
THESE ARE NOT BUY RECOMMENDATIONS!
Comments contained in the body of this report are technical
opinions only. The material herein has been obtained
from sources believed to be reliable and accurate, however,
its accuracy and completeness cannot be guaranteed.
This site is not an investment advisor, hence it does
not endorse or recommend any securities or other investments.
Any recommendation contained in this report may not
be suitable for all investors and it is not to be deemed
an offer or solicitation on our part with respect to
the purchase or sale of any securities. All trademarks,
service marks and trade names appearing in this report
are the property of their respective owners, and are
likewise used for identification purposes only.
This report is a service available
only to active Paid Premium Members.
You may opt-out of receiving report notifications
at any time. Questions or comments may be submitted
by writing to Premium Membership Services 665 S.E. 10 Street, Suite 201 Deerfield Beach, FL 33441-5634 or by calling 1-800-965-8307
or 954-785-1121.
|
|
|


