You are not logged in.
This means you
CAN ONLY VIEW reports that were published prior to Sunday, April 27, 2025.
You
MUST UPGRADE YOUR MEMBERSHIP if you want to see any current reports.
AFTER MARKET UPDATE - MONDAY, AUGUST 10TH, 2009
Previous After Market Report Next After Market Report >>>
|
|
|
|
DOW |
-32.05 |
9,337.95 |
-0.34% |
|
Volume |
1,086,161,590 |
-26% |
|
Volume |
1,898,421,290 |
-24% |
|
NASDAQ |
-7.74 |
1,992.51 |
-0.39% |
|
Advancers |
1,445 |
46% |
|
Advancers |
1,329 |
46% |
|
S&P 500 |
-3.38 |
1,007.10 |
-0.33% |
|
Decliners |
1,593 |
51% |
|
Decliners |
1,407 |
49% |
|
Russell 2000 |
-0.53 |
571.87 |
-0.09% |
|
52 Wk Highs |
84 |
|
|
52 Wk Highs |
49 |
|
|
S&P 600 |
-0.27 |
303.98 |
-0.09% |
|
52 Wk Lows |
1 |
|
|
52 Wk Lows |
6 |
|
|
 |
Decliners Narrowly Led Advancers As Major Averages Fell On Lighter Volume
Adam Sarhan, Contributing Writer,
The major averages ended unanimously lower on Monday. Volume totals reported on the NYSE and Nasdaq exchange were very light as decliners narrowly led advancers on the NYSE and on the Nasdaq exchange. There were 26 high-ranked companies from the CANSLIM.net Leaders List that made a new 52-week high and appeared on the CANSLIM.net BreakOuts Page, up from the 23 issues that appeared on the prior session. On both exchanges new 52-week highs still significantly outnumbered 52-week lows, and new lows were in the single digits again.
The major averages ended with modest losses on Monday after traders enjoyed one of the last few weekends of the summer. The S&P 500 Index slid from a 10-month high as the market continues to digest the market's recent move. Remember that the S&P 500 rose +2.3% last week and jumped above the psychologically important 1,000 mark for the first time since November 2008, as a series of stronger-than-expected earnings and economic data helped lift stocks. So far second quarter earnings have been stronger than expected which has played a pivotal role to the markets robust advance since early March and the economic data has improved markedly in recent months which has also helped the bulls case.
Interestingly, the benchmark S&P 500's P/E ratio jumped to 18.6 at the Monday's opening bell which is the highest ratio since December 2004. Even though the index as rallied smartly since its March low of 666, the index must rally another +55% to surpass its all-time high of 1,565.15 set on October 9, 2007. For those of you that like market trivia - before November 2008, the S&P 500 had remained above the 1,000 mark for five consecutive years.
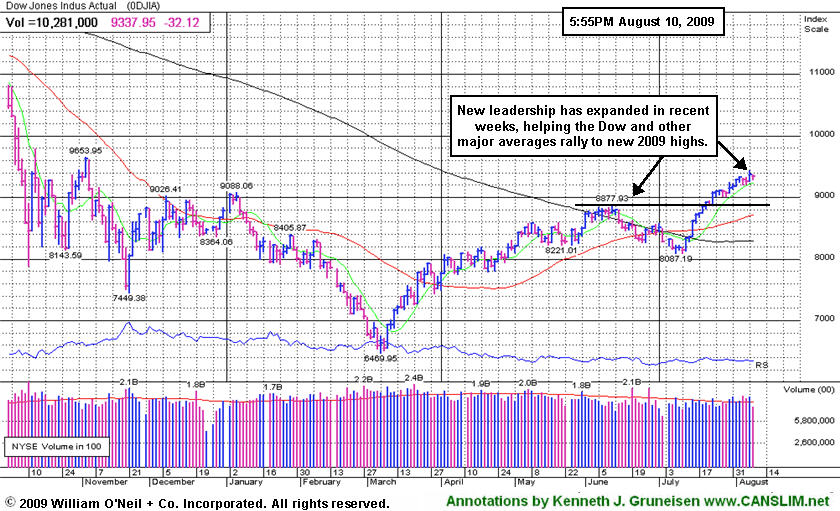
Many people now believe that the recession has effectively ended and we are in the very beginning phases of a new recovery. These same people believe that a new bull market has begun thanks to the monstrous rally enjoyed by the major averages since early March. Instead of guessing, we shall simply say that we are currently in a strong uptrend (one of the strongest for the major averages in decades) and that leadership is beginning to emerge. Until July, new leadership was continually cited as the critical missing component of the rally. With better leadership showing up in recent week, growth oriented investors have a better market environment (the M criteria) with better odds of success.
Money Management Services - WE FOLLOW THE RULES! DOES YOUR BROKER?
Managing money can be difficult at times. Are you looking for a money manager who follows a proven set of rules? If you are frustrated because your broker/money manager does not follow all of the rules of this powerful investment system, contact us. We have veterans who have been in business for over 20 years who pride themselves on their ability to closely follow all the rules of the investment system in both bull and bear markets. You may inquire about having your account professionally managed using this fact-based investment system by clicking HERE. *Accounts over $250,000 please. ** Serious inquiries only.
PICTURED: New leadership has expanded in recent weeks, helping the Dow and other major averages rally to new 2009 highs.
|
|
|
 |
Healthcare & Energy Groups Held Up Best Amid Broader Losses
Kenneth J. Gruneisen - Passed the CAN SLIM® Master's Exam
The Healthcare Index ($HMO +0.81%) rose modestly and the Integrated Oil Index ($XOI +0.05%) and Oil Services Index ($OSX +0.42%) posted smaller gains while most groups failed to make headway on Monday. The Bank Index ($BKX +0.18%) inched higher, but the Broker/Dealer Index ($XBD -1.29%) backpedaled. Weak action for the Retail Index ($RLX -1.99%) and tech shares' sluggishness hurt the major averages' ability to rally. Losses for the Networking Index ($NWX -1.35%) and Semiconductor Index ($SOX -1.20%) dragged the tech-heavy Nasdaq down slightly worse than its peers, while the Biotechnology Index ($BTK -0.13%) and Internet Index ($IIX +0.01%) ended with little change.
Charts courtesy www.stockcharts.com
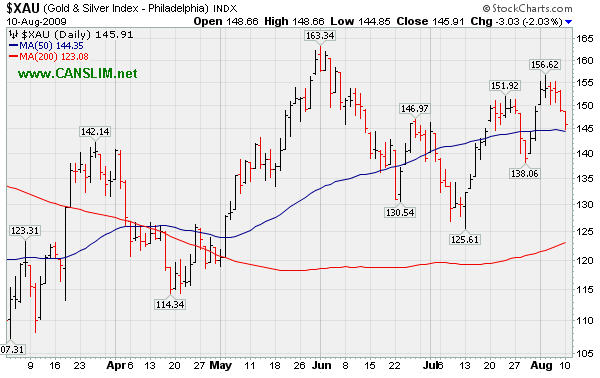
PICTURED: The Gold & Silver Index ($XAU -2.03%) suffered a 4th consecutive loss and fell near its 50-day moving average line (the blue line on the chart above). It has traded above and below that important short-term average line several times since April, yet it has generally been on the rise since its 50 DMA line crossed above its longer-term 200 DMA line (the red line) in a bullish fashion.
| Oil Services |
$OSX |
171.93 |
+0.72 |
+0.42% |
+41.63% |
| Healthcare |
$HMO |
1,162.88 |
+9.31 |
+0.81% |
+21.11% |
| Integrated Oil |
$XOI |
958.29 |
+0.48 |
+0.05% |
-2.18% |
| Semiconductor |
$SOX |
294.95 |
-3.58 |
-1.20% |
+39.02% |
| Networking |
$NWX |
200.23 |
-2.75 |
-1.35% |
+39.15% |
| Internet |
$IIX |
203.58 |
+0.03 |
+0.01% |
+52.19% |
| Broker/Dealer |
$XBD |
110.59 |
-1.45 |
-1.29% |
+42.75% |
| Retail |
$RLX |
365.30 |
-7.40 |
-1.99% |
+30.81% |
| Gold & Silver |
$XAU |
145.91 |
-3.03 |
-2.03% |
+17.81% |
| Bank |
$BKX |
45.53 |
+0.08 |
+0.18% |
+2.73% |
| Biotech |
$BTK |
859.28 |
-1.08 |
-0.13% |
+32.78% |
|
|
|
 |
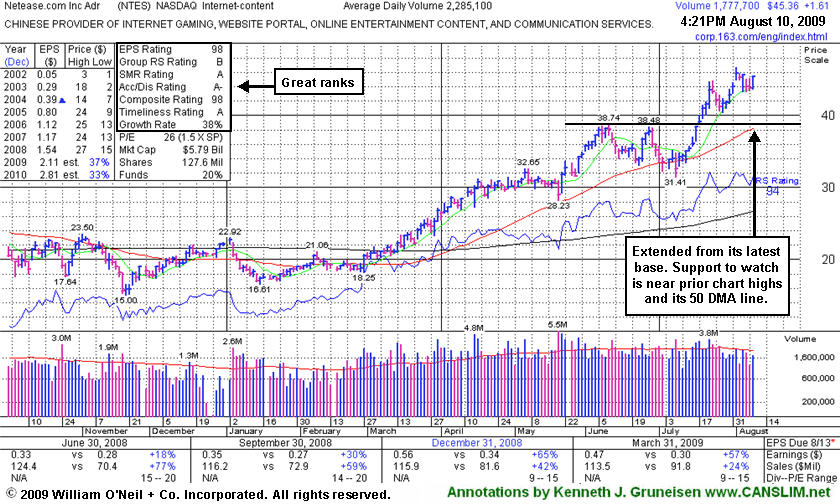
Chinese Internet Content Firm Is Extended From Sound Base
Kenneth J. Gruneisen - Passed the CAN SLIM® Master's Exam
Netease.com Inc (NTES +$1.61 or +3.68% to $45.36) closed with a gain on below average volume today. Caution is advised because it is extended from its latest base. Support to watch is near prior chart highs and its 50-day moving average (DMA) line, both of which coincide near the $38 level. Its most recent gains have lacked great volume conviction. On 7/22/09, when it finally produced a considerable gain on +52% above average volume (above the minimum volume guideline for buyable breakouts) it had already rallied above its "max buy" level. That means it was hard or impossible for disciplined investors to justify buying this high-ranked Chinese Internet - Content firm since its color code was changed to yellow with a new pivot point cited in the 7/17/09 Mid-Day Breakouts Report (read here). At that time, it managed to break out from a 5-week flat base but it was noted for the fact that it came with only +44% above average volume, below the investment system's guidelines for a proper technical buy signal.
|
|
|
Color Codes Explained :
Y - Better candidates highlighted by our
staff of experts.
G - Previously featured
in past reports as yellow but may no longer be buyable under the
guidelines.
***Last / Change / Volume quote data in this table corresponds with the timestamp on the note***
Symbol/Exchange
Company Name
Industry Group |
Last |
Chg. |
Vol
% DAV |
Date Featured |
Price Featured |
Latest Pivot Point
Featured |
Status |
| Latest Max Buy Price |
ASIA
-
|
$18.09
|
-0.07
|
409,470
52% DAV
784,100
|
8/2/2009
(Date
Featured) |
$19.27
(Price
Featured) |
PP = $22.19 |
G |
| MB = $23.30 |
Most Recent Note - 8/10/2009 2:59:03 PM
G - Quietly slumping under its 50 DMA line, and it has not followed through with additional gains on volume since since its big 7/30/09 gap up gain on heavy volume. Color code is changed to green now, and it would need to rally above its recent highs in the $20 area for its outlook to improve. Recently featured in the August 2009 CANSLIM.net News here
There are no Featured Stock Updates™ available for this stock at this time. You may request one by clicking here
|
|
C
A
S
I |
News |
Chart |
SEC
View all notes Alert
me of new notes
Company
Profile
|
CPLA
- NASDAQ
Capella Education Co
DIVERSIFIED SERVICES - Education and Training Services
|
$64.14
|
-0.02
|
115,775
54% DAV
216,000
|
7/9/2009
(Date
Featured) |
$59.69
(Price
Featured) |
PP = $62.06 |
Y |
| MB = $65.16 |
Most Recent Note - 8/10/2009 3:36:38 PM
Y - Overcame early weakness after a small gap down today. Consolidating near its 52-week high, above its pivot point. Featured in yellow in the 7/09/09 Mid-Day BreakOuts Report (read here). The Commercial Services-Schools Group has shown some leadership but has low ranks, and CPLA's Relative Strength rank has slumped to 74, under the 80+ guideline. Its small supply of only 13.9 million shares in the float could contribute to greater price volatility in the event of institutional accumulation or distribution. The number of top-rated funds owning an interest rose from 91 in Sept '08, to 134 as of March '09, which is reassuring with respect to the I criteria. It has a very good earnings history that satisfies the C & A criteria, while recent quarters showed steady sales revenues increases in the +17-18% range.
>>> The latest Featured Stock Update with an annotated graph appeared on 8/6/2009. click here.
|
|
C
A
S
I |
News |
Chart |
SEC
View all notes Alert
me of new notes
Company
Profile
|
GMCR
- NASDAQ
Green Mtn Coffee Roastrs
FOOD & BEVERAGE - Processed & Packaged Goods
|
$68.07
|
-1.83
|
742,593
47% DAV
1,571,200
|
7/17/2009
(Date
Featured) |
$60.15
(Price
Featured) |
PP = $63.79 |
G |
| MB = $66.98 |
Most Recent Note - 8/10/2009 3:43:36 PM
G - Holding its ground after offering 5 million common shares at $67.25 apiece last week in a deal underwritten by BofA Merrill Lynch. Prior highs in the $62-63 area are initial chart support to watch above its 50 DMA line. Do not be confused by the 3:2 stock split effective 6/09/09. GMCR traded up more than +168% since appearing with an annotated graph under the headline "It May Soon Be Time To Go Green" when featured in the January 2009 CANSLIM.net News (read here).
>>> The latest Featured Stock Update with an annotated graph appeared on 7/30/2009. click here.
|
|
C
A
S
I |
News |
Chart |
SEC
View all notes Alert
me of new notes
Company
Profile
|
HMSY
- NASDAQ
H M S Holdings Corp
COMPUTER SOFTWARE & SERVICES - Healthcare Information Service
|
$35.83
|
-0.16
|
244,962
N/A
|
2/20/2009
(Date
Featured) |
$34.08
(Price
Featured) |
PP = $38.38 |
G |
| MB = $40.30 |
Most Recent Note - 8/10/2009
On track for a 5th consecutive loss today on ever decreasing volume. It has slumped well below its 50 DMA line, and it would need to repair that violation for its outlook to improve. This high-ranked Commercial Services - Healthcare firm's Relative Strength rank has slumped to 68, well below the 80+ guideline. Based on its deterioration it will be dropped from the Featured Stocks list.
>>> The latest Featured Stock Update with an annotated graph appeared on 8/4/2009. click here.
|
|
C
A
S
I |
News |
Chart |
SEC
View all notes Alert
me of new notes
Company
Profile
|
LFT
-
|
$31.49
|
+3.49
|
2,338,103
332% DAV
704,600
|
8/10/2009
(Date
Featured) |
$31.49
(Price
Featured) |
PP = $30.57 |
Y |
| MB = $32.10 |
Most Recent Note - 8/10/2009 1:18:43 PM
Y - Gapped up today and rallied for a considerable gain with heavy volume, reaching a new 52-week high, yet pulling back from intra-day highs. Color code is changed to yellow with new pivot point and max buy prices noted. It has repaired its 50 DMA violation and rebounded impressively since weak action it will be dropped from the Featured Stocks list on 7/08/09.
>>> The latest Featured Stock Update with an annotated graph appeared on 7/1/2009. click here.
|
|
C
A
S
I |
News |
Chart |
SEC
View all notes Alert
me of new notes
Company
Profile
|
NTES
- NASDAQ
Netease Inc Adr
INTERNET - Internet Information Providers
|
$45.26
|
+1.51
|
1,581,231
69% DAV
2,285,100
|
7/17/2009
(Date
Featured) |
$39.29
(Price
Featured) |
PP = $38.74 |
G |
| MB = $40.68 |
Most Recent Note - 8/10/2009 3:52:45 PM
G - Gain today on below average volume, still extended from its latest sound base. The nearest chart support is at its pivot point, 50 DMA line, and prior chart highs, all of which are in the $38 area. First featured at $26.75 in the 3/31/09 CANSLIM.net Mid-Day Breakouts Report (read here).
>>> The latest Featured Stock Update with an annotated graph appeared on 8/10/2009. click here.
|
|
C
A
S
I |
News |
Chart |
SEC
View all notes Alert
me of new notes
Company
Profile
|
NVEC
- NASDAQ
N V E Corp
ELECTRONICS - Semiconductor - Specialized
|
$52.47
|
-0.90
|
52,621
54% DAV
97,900
|
3/13/2009
(Date
Featured) |
$33.85
(Price
Featured) |
PP = $49.60 |
G |
| MB = $52.08 |
Most Recent Note - 8/10/2009 3:57:11 PM
G - Quietly consolidating above its 50 DMA line. Its color code is changed to green, as it is above its max buy level and not near a proper buy point now. Prior highs are now an important support level. Deterioration under its prior chart high ($49.50) would raise concerns. Featured in the 7/23/09 Mid-Day BreakOuts Report (read here) after it gapped up for a considerable gain on heavy volume following news of stronger sales revenues (+41%) and solid earnings increases for the quarter ended June 30, 2009. The technical action was described as a "breakaway gap" from a valid ascending base. Quarterly sales revenues in the 6 million dollar range are still rather minuscule, leaving concerns.
>>> The latest Featured Stock Update with an annotated graph appeared on 8/3/2009. click here.
|
|
C
A
S
I |
News |
Chart |
SEC
View all notes Alert
me of new notes
Company
Profile
|
PEGA
- NASDAQ
Pegasystems Inc
COMPUTER SOFTWARE & SERVICES - Business Software & Services
|
$31.24
|
-0.74
|
412,744
139% DAV
296,400
|
7/29/2009
(Date
Featured) |
$27.53
(Price
Featured) |
PP = $27.49 |
G |
| MB = $28.86 |
Most Recent Note - 8/10/2009 3:58:49 PM
G - Negatively reversed after hitting a new high today. Trading in a tight range since its considerable 8/05/09 gain with nearly 5 times average volume after reporting strong Q2 earnings and raising guidance. The high-ranked software firm triggered a technical buy signal when rising from the "double bottom" base when it was featured in the 7/29/09 mid-day report (read here). The previously noted downturn in annual earnings (the A criteria) from 2003 to 2006 has been followed by a solid turn around and big earnings increases in '07 and '08, and Street expectations for '09 are calling for well above +25% growth.
>>> The latest Featured Stock Update with an annotated graph appeared on 7/29/2009. click here.
|
|
C
A
S
I |
News |
Chart |
SEC
View all notes Alert
me of new notes
Company
Profile
|
TNDM
- NASDAQ
Tandem Diabetes Care Inc
TELECOMMUNICATIONS - Wireless Communications
|
$27.03
|
-1.82
|
1,636,516
168% DAV
973,100
|
3/2/2009
(Date
Featured) |
$18.89
(Price
Featured) |
PP = $32.67 |
G |
| MB = $34.30 |
Most Recent Note - 8/10/2009 4:10:48 PM
G - Considerable loss today on higher volume indicates more worrisome distributional pressure after it made a stand near its 50 DMA line on Friday. Color code was changed to green after the technically damaging action negated its 8/03/09 breakout, raising concerns and triggering sell signals. As previously noted, "a prompt show of support repairing the 50 DMA breach is necessary to help its outlook, otherwise the odds favor that it will spend more time consolidating and it could encounter more distributional pressure." It traded up as much as +82.95% since first featured at $18.89 in the 3/02/09 Mid-Day BreakOuts Report (read here).
>>> The latest Featured Stock Update with an annotated graph appeared on 8/5/2009. click here.
|
|
C
A
S
I |
News |
Chart |
SEC
View all notes Alert
me of new notes
Company
Profile
|
UTA
-
|
$14.90
|
+1.02
|
732,189
157% DAV
465,700
|
7/28/2009
(Date
Featured) |
$12.87
(Price
Featured) |
PP = $12.70 |
G |
| MB = $13.34 |
Most Recent Note - 8/10/2009 3:27:22 PM
G - Gapped down today and then positively reversed after briefly trading below its "max buy" level and testing support near prior chart highs that were previously noited as "an important support level to watch on pullbacks." Strong action prompted it to be featured in yellow with pivot point and max buy levels noted in the 7/28/09 mid-day breakouts report (read here), with additional analysis included in the after market update (read here). This Chinese provider of airline tickets and travel related services gapped up on 7/28/09, rising from a choppy 6-week base with a considerable gain on very heavy volume.
>>> The latest Featured Stock Update with an annotated graph appeared on 8/7/2009. click here.
|
|
C
A
S
I |
News |
Chart |
SEC
View all notes Alert
me of new notes
Company
Profile
|
|
|
|
THESE ARE NOT BUY RECOMMENDATIONS!
Comments contained in the body of this report are technical
opinions only. The material herein has been obtained
from sources believed to be reliable and accurate, however,
its accuracy and completeness cannot be guaranteed.
This site is not an investment advisor, hence it does
not endorse or recommend any securities or other investments.
Any recommendation contained in this report may not
be suitable for all investors and it is not to be deemed
an offer or solicitation on our part with respect to
the purchase or sale of any securities. All trademarks,
service marks and trade names appearing in this report
are the property of their respective owners, and are
likewise used for identification purposes only.
This report is a service available
only to active Paid Premium Members.
You may opt-out of receiving report notifications
at any time. Questions or comments may be submitted
by writing to Premium Membership Services 665 S.E. 10 Street, Suite 201 Deerfield Beach, FL 33441-5634 or by calling 1-800-965-8307
or 954-785-1121.
|
|
|


