You are not logged in.
This means you
CAN ONLY VIEW reports that were published prior to Monday, April 14, 2025.
You
MUST UPGRADE YOUR MEMBERSHIP if you want to see any current reports.
AFTER MARKET UPDATE - WEDNESDAY, AUGUST 8TH, 2012
Previous After Market Report Next After Market Report >>>
|
|
|
|
DOW |
+7.04 |
13,175.64 |
+0.05% |
|
Volume |
637,138,390 |
-13% |
|
Volume |
1,819,578,820 |
-2% |
|
NASDAQ |
-4.61 |
3,011.25 |
-0.15% |
|
Advancers |
1,528 |
49% |
|
Advancers |
1,089 |
42% |
|
S&P 500 |
+0.87 |
1,402.22 |
+0.06% |
|
Decliners |
1,449 |
47% |
|
Decliners |
1,388 |
53% |
|
Russell 2000 |
-1.18 |
800.16 |
-0.15% |
|
52 Wk Highs |
132 |
|
|
52 Wk Highs |
64 |
|
|
S&P 600 |
+0.42 |
451.32 |
+0.09% |
|
52 Wk Lows |
13 |
|
|
52 Wk Lows |
32 |
|
|
 |
Indices' Recent Gains Lifted Them Within Close Range of 2012 Highs
Kenneth J. Gruneisen - Passed the CAN SLIM® Master's Exam
The major averages ended little changed on Wednesday's session with mixed results. The volume totals were lighter on the NYSE and on the Nasdaq exchange versus the prior session totals. Advancing issues narrowly led decliners on the NYSE, but decliners led advancers by about a 7-5 margin on the Nasdaq exchange. The total number of new 52-week highs led new 52-week lows on the NYSE on the Nasdaq exchange. There were 39 high-ranked companies from the CANSLIM.net Leaders List made new 52-week highs and appeared on the CANSLIM.net BreakOuts Page, down from the prior session total of 61 stocks. There were gains for only 5 of the 16 high-ranked companies currently included on the Featured Stocks Page.
Stocks struggled to find direction as investors exercised caution following an impressive three-day winning streak. Six of the 10 sectors on the S&P finished higher led by gains in consumer staples. Shares of Wal-Mart Stores Inc (WMT +0.94%) and CVS Caremark Corp (CVS +3.26%) advanced. Macy’s Inc (M +2.73%) rose after reporting a higher quarterly profit and boosting its full-year earnings guidance. Travel websites were under pressure as Priceline.com Inc (PCLN -17.28%) and Orbitz Worldwide Inc (OWW -25.54%) shares dove after both companies offered disappointing guidance following their earnings reports. Expedia Inc (EXPE -4.64%) fell in sympathy. In other news, owner of Outback Steakhouse, Bloomin Brands (BLMN +12.82%) jumped in their market debut.
Turning to fixed income, Treasuries are lower along the curve. The benchmark 10-year note was down 3/16 of a point to yield 1.65% and the 30-year bond fell 1/2 of a point to yield 2.75%.
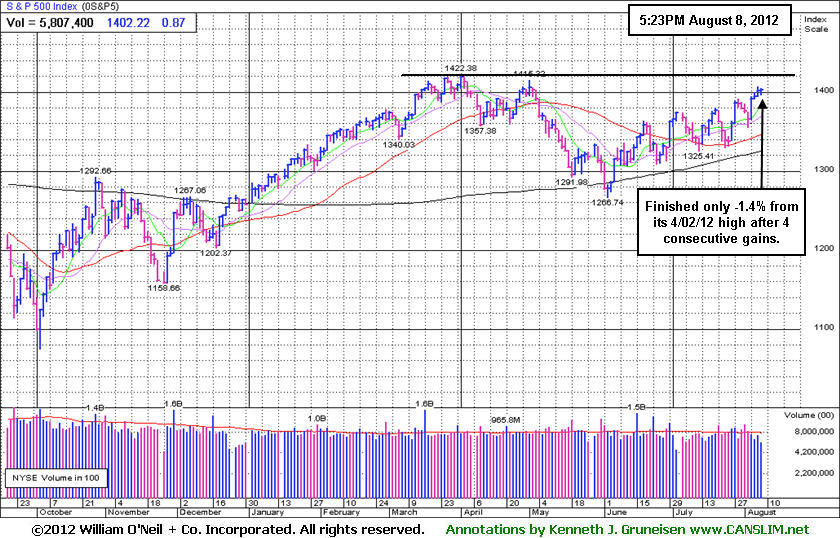
The Dow Jones Industrial Average ended -1.2% off its 2012 high and the Nasdaq Composite Index ended -3.9% off its 2012 high. In terms of the M criteria, the major indices recently have been in a confirmed rally coupled with an expansion in leadership (stocks hitting new 52-week highs).
Watch for an announcement soon via email concerning new monthly webcasts starting in August and a new "Market's Leading Groups" archives tab to be added on the Premium Member Homepage. These changes are aimed at satisfying member requests and improving the service. If you have questions, comments or suggestions please let us know via the inquiry form here. The most recent WEBCAST (Q2 2012) is available "ON DEMAND" - CLICK HERE.
PICTURED: The S&P 500 Index finished only -1.4% off its April 2, 2012 high after 4 consecutive gains.
|
 Kenneth J. Gruneisen started out as a licensed stockbroker in August 1987, a couple of months prior to the historic stock market crash that took the Dow Jones Industrial Average down -22.6% in a single day. He has published daily fact-based fundamental and technical analysis on high-ranked stocks online for two decades. Through FACTBASEDINVESTING.COM, Kenneth provides educational articles, news, market commentary, and other information regarding proven investment systems that work in good times and bad.
Comments contained in the body of this report are technical opinions only and are not necessarily those of Gruneisen Growth Corp. The material herein has been obtained from sources believed to be reliable and accurate, however, its accuracy and completeness cannot be guaranteed. Our firm, employees, and customers may effect transactions, including transactions contrary to any recommendation herein, or have positions in the securities mentioned herein or options with respect thereto. Any recommendation contained in this report may not be suitable for all investors and it is not to be deemed an offer or solicitation on our part with respect to the purchase or sale of any securities. |
|
 |
Healthcare Group Was a Standout Gainer Amid Broader Weakness
Kenneth J. Gruneisen - Passed the CAN SLIM® Master's Exam
The Retail Index ($RLX -0.93%) created a drag on the major averages and the tech sector saw losses from the Internet Index ($IIX -0.91%), Networking Index ($NWX -0.74%), and the Biotechnology Index ($BTK -0.68%) while the Semiconductor Index ($SOX +0.27%) eked out just a small gain. The Bank Index ($BKX +0.11%) also posted a tiny gain, but the Broker/Dealer Index ($XBD -0.53%) suffered a modest loss. The Gold & Silver Index ($XAU -0.42%) edged lower, and energy-related shares were quiet as the Oil Services Index ($OSX -0.03%) and Integrated Oil Index ($XOI +0.25%) were little changed. The Healthcare Index ($HMO +1.55%) was one of the day's standout gainers.
Charts courtesy www.stockcharts.com
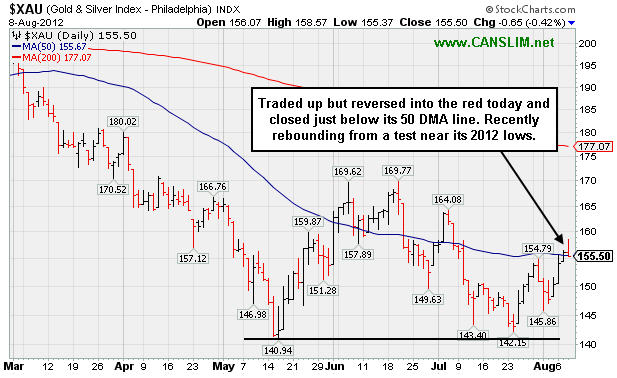
PICTURED: The Gold & Silver Index ($XAU -0.42%) traded up but reversed into the red and closed just below its 50-day moving average (DMA) line. It recently rebounded from a test near its 2012 lows.
| Oil Services |
$OSX |
225.51 |
-0.06 |
-0.03% |
+4.27% |
| Healthcare |
$HMO |
2,304.20 |
+35.27 |
+1.55% |
+0.99% |
| Integrated Oil |
$XOI |
1,239.65 |
+3.08 |
+0.25% |
+0.86% |
| Semiconductor |
$SOX |
401.15 |
+1.09 |
+0.27% |
+10.07% |
| Networking |
$NWX |
208.60 |
-1.56 |
-0.74% |
-3.05% |
| Internet |
$IIX |
310.94 |
-2.84 |
-0.91% |
+10.36% |
| Broker/Dealer |
$XBD |
79.64 |
-0.43 |
-0.53% |
-4.37% |
| Retail |
$RLX |
626.98 |
-5.91 |
-0.93% |
+19.84% |
| Gold & Silver |
$XAU |
155.50 |
-0.65 |
-0.42% |
-13.92% |
| Bank |
$BKX |
46.53 |
+0.05 |
+0.11% |
+18.16% |
| Biotech |
$BTK |
1,433.96 |
-9.75 |
-0.68% |
+31.38% |
|
|
|
 |
Sound New Base Could Form Following Pullback Below 50 DMA Line
Kenneth J. Gruneisen - Passed the CAN SLIM® Master's Exam
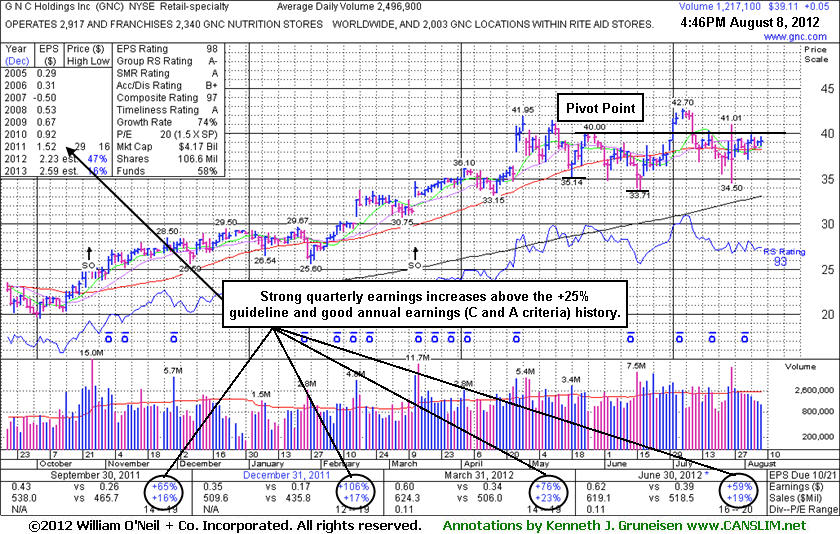
GNC Holdings Inc (GNC +$0.05 or +0.13% to $39.11) has been quietly consolidating just above its 50-day moving average (DMA) line. Recently the high-ranked Retail - Specialty firm reported earnings +59% on +19% sales revenues for the quarter ended June 30, 2012 versus the year ago period, beating expectations, and it also raised guidance for FY '12.
It was last shown in the FSU section with an annotated graph on 7/05/12 under the headline, "Streak of Gains While Rallying From New Double Bottom Base " as it hit new all-time highs with a 7th consecutive gain and rallied from a 10-week "double bottom" type base. Subsequent damaging losses triggered technical sell signals as it slumped below its 50 -day moving average line, yet it stayed above prior lows. Its recent rebound above its 50-day moving average (DMA) line helped its technical stance improve, however its current consolidation does not have the look of a sound base pattern. Patient investors may watch for a new pivot point to be cited in the weeks ahead if healthy action continues. Meanwhile, below its recent lows in the $33-34 area its 200 DMA line comes into play as the next important chart support level to watch.
GNC completed Secondary Offerings on 10/25/11 and 3/13/12 after making steady progress following its 4/01/11 IPO. As prior analysis noted, new institutional owners are often attracted when a company has the help of underwriters in placing shares during offerings. The number of top-rated funds owning its shares rose from 147 in Jun '11 to 419 in Jun '12, a reassuring sign concerning the I criteria. Its strong quarterly earnings increases with accelerating sales growth and a great annual earnings history satisfies the C and A criteria and helped it earn stellar ranks.
 |
|
|
Color Codes Explained :
Y - Better candidates highlighted by our
staff of experts.
G - Previously featured
in past reports as yellow but may no longer be buyable under the
guidelines.
***Last / Change / Volume data in this table is the closing quote data***
Symbol/Exchange
Company Name
Industry Group |
PRICE |
CHANGE
(%Change) |
Day High |
Volume
(% DAV)
(% 50 day avg vol) |
52 Wk Hi
% From Hi |
Featured
Date |
Price
Featured |
Pivot Featured |
|
Max Buy |
ALXN
-
NASDAQ
Alexion Pharmaceuticals
DRUGS - Drug Manufacturers - Other
|
$104.72
|
-0.38
-0.36% |
$105.50
|
709,029
41.62% of 50 DAV
50 DAV is 1,703,500
|
$109.96
-4.77%
|
5/1/2012
|
$91.73
|
PP = $95.11
|
|
MB = $99.87
|
 Most Recent Note - 8/8/2012 4:05:52 PM
G - Holding its ground with volume totals cooling since last noted on 8/03/12 when it gapped up for a gain with above average volume. Chart support is defined by its 50 DMA line (now $98.11).
>>> The latest Featured Stock Update with an annotated graph appeared on 7/25/2012. Click here.
View all notes |
Alert me of new notes |
CANSLIM.net Company Profile |
SEC |
Zacks Reports |
StockTalk |
News |
Chart |
Request a new note
C
A N
S L
I M


|
ASPS
-
NASDAQ
Altisource Ptf Sltns Sa
REAL ESTATE - Property Management/Developmen
|
$84.30
|
+1.51
1.82% |
$84.43
|
98,047
71.99% of 50 DAV
50 DAV is 136,200
|
$83.83
0.56%
|
6/5/2012
|
$60.01
|
PP = $63.00
|
|
MB = $66.15
|
Most Recent Note - 8/8/2012 4:06:45 PM
G - Tallied a 9th consecutive gain today and hit another new high, getting more extended from its prior base. Recent low and its 50 DMA line define near-term support to watch.
>>> The latest Featured Stock Update with an annotated graph appeared on 8/3/2012. Click here.
View all notes |
Alert me of new notes |
CANSLIM.net Company Profile |
SEC |
Zacks Reports |
StockTalk |
News |
Chart |
Request a new note
C
A N
S L
I M
|
CFNL
-
NASDAQ
Cardinal Financial Corp
BANKING - Regional - Southeast Banks
|
$12.64
|
-0.22
-1.71% |
$12.84
|
44,271
56.83% of 50 DAV
50 DAV is 77,900
|
$13.21
-4.31%
|
7/20/2012
|
$12.85
|
PP = $12.41
|
|
MB = $13.03
|
Most Recent Note - 8/7/2012 4:24:18 PM
Y - Rebounded further above its pivot point with today's gain on +20% above average volume. Its 50 DMA line and prior chart highs define important near-term support to watch.
>>> The latest Featured Stock Update with an annotated graph appeared on 7/26/2012. Click here.
View all notes |
Alert me of new notes |
CANSLIM.net Company Profile |
SEC |
Zacks Reports |
StockTalk |
News |
Chart |
Request a new note
C
A N
S L
I M
|
CMCSA
-
NASDAQ
Comcast Corp Cl A
MEDIA - CATV Systems
|
$34.51
|
-0.04
-0.12% |
$34.65
|
13,353,323
92.66% of 50 DAV
50 DAV is 14,411,300
|
$35.16
-1.85%
|
6/11/2012
|
$29.94
|
PP = $30.98
|
|
MB = $32.53
|
Most Recent Note - 8/7/2012 11:03:32 AM
G - Hit another new 52-week high today, getting more extended from its prior base with a streak of recent gains backed by above average volume. Gapped up on 8/01/12 after reporting earnings +19% on +6% sales revenues for the Jun '12 quarter, below the fact-based investment system's +25% minimum guideline for the C criteria, but better than Street expectations.
>>> The latest Featured Stock Update with an annotated graph appeared on 7/11/2012. Click here.
View all notes |
Alert me of new notes |
CANSLIM.net Company Profile |
SEC |
Zacks Reports |
StockTalk |
News |
Chart |
Request a new note
C
A N
S L
I M
|
DG
-
NYSE
Dollar General Corp
RETAIL - Discount, Variety Stores
|
$52.10
|
-0.62
-1.18% |
$52.63
|
1,810,058
45.10% of 50 DAV
50 DAV is 4,013,400
|
$56.04
-7.03%
|
7/16/2012
|
$54.68
|
PP = $56.14
|
|
MB = $58.95
|
Most Recent Note - 8/7/2012 11:00:14 AM
G - Consolidating near its 50 DMA line with volume totals cooling in recent weeks after encountering distributional pressure.
>>> The latest Featured Stock Update with an annotated graph appeared on 7/12/2012. Click here.
View all notes |
Alert me of new notes |
CANSLIM.net Company Profile |
SEC |
Zacks Reports |
StockTalk |
News |
Chart |
Request a new note
C
A N
S L
I M
|
Symbol/Exchange
Company Name
Industry Group |
PRICE |
CHANGE
(%Change) |
Day High |
Volume
(% DAV)
(% 50 day avg vol) |
52 Wk Hi
% From Hi |
Featured
Date |
Price
Featured |
Pivot Featured |
|
Max Buy |
ECPG
-
NASDAQ
Encore Capital Group Inc
FINANCIAL SERVICES - Credit Services
|
$28.50
|
-1.45
-4.84% |
$29.64
|
506,751
333.83% of 50 DAV
50 DAV is 151,800
|
$30.47
-6.47%
|
8/3/2012
|
$29.91
|
PP = $30.45
|
|
MB = $31.97
|
Most Recent Note - 8/8/2012 12:04:47 PM
Y - Gapped down today, retreating to its 50 DMA line with a large loss on above average volume. A volume-driven gain and close above its pivot point may trigger a technical buy signal, meanwhile, subsequent deterioration below its 50 DMA line and recent lows would raise more serious concerns. See the latest FSU analysis for more details and a new annotated graph.
>>> The latest Featured Stock Update with an annotated graph appeared on 8/6/2012. Click here.
View all notes |
Alert me of new notes |
CANSLIM.net Company Profile |
SEC |
Zacks Reports |
StockTalk |
News |
Chart |
Request a new note
C
A N
S L
I M
|
EXPE
-
NASDAQ
Expedia Inc
INTERNET - Internet Information Providers
|
$56.14
|
-2.73
-4.64% |
$58.15
|
7,823,063
201.89% of 50 DAV
50 DAV is 3,875,000
|
$59.50
-5.65%
|
4/27/2012
|
$41.80
|
PP = $35.57
|
|
MB = $37.35
|
Most Recent Note - 8/8/2012 12:05:09 PM
G - Gapped down today amid weakness in travel-related stocks after Priceline.com Inc (PCLN) and Orbitz Worldwide Inc (OWW) reported disappointing results. EXPE recently reported earnings +24% on +14% sales revenues for the quarter ending June 30, 2012 versus the year ago period, just below the +25% minimum earnings guideline for buy candidates.
>>> The latest Featured Stock Update with an annotated graph appeared on 7/10/2012. Click here.
View all notes |
Alert me of new notes |
CANSLIM.net Company Profile |
SEC |
Zacks Reports |
StockTalk |
News |
Chart |
Request a new note
C
A N
S L
I M
|
GNC
-
NYSE
G N C Holdings Inc
RETAIL - Drug Stores
|
$39.11
|
+0.05
0.13% |
$39.69
|
1,221,890
48.94% of 50 DAV
50 DAV is 2,496,900
|
$42.70
-8.41%
|
6/29/2012
|
$39.20
|
PP = $40.00
|
|
MB = $42.00
|
Most Recent Note - 8/6/2012 5:33:33 PM
Y - Quietly consolidating just above its 50 DMA line today. Reported earnings +59% on +19% sales revenues for the quarter ended June 30, 2012 versus the year ago period, beating expectations, and it also raised guidance for FY '12.
>>> The latest Featured Stock Update with an annotated graph appeared on 8/8/2012. Click here.
View all notes |
Alert me of new notes |
CANSLIM.net Company Profile |
SEC |
Zacks Reports |
StockTalk |
News |
Chart |
Request a new note
C
A N
S L
I M
|
GPX
-
NYSE
G P Strategies Corp
DIVERSIFIED SERVICES - Education and Training Services
|
$19.09
|
-0.36
-1.85% |
$19.39
|
59,499
93.11% of 50 DAV
50 DAV is 63,900
|
$20.08
-4.93%
|
6/29/2012
|
$18.01
|
PP = $18.15
|
|
MB = $19.06
|
Most Recent Note - 8/7/2012 6:01:07 PM
G - Perched at its 52-week high after 4 consecutive volume-driven gains. See the latest FSU analysis for more details and a new annotated graph.
>>> The latest Featured Stock Update with an annotated graph appeared on 8/7/2012. Click here.
View all notes |
Alert me of new notes |
CANSLIM.net Company Profile |
SEC |
Zacks Reports |
StockTalk |
News |
Chart |
Request a new note
C
A N
S L
I M
|
HMSY
-
NASDAQ
H M S Holdings Corp
COMPUTER SOFTWARE and SERVICES - Healthcare Information Service
|
$35.77
|
+0.82
2.35% |
$36.12
|
794,765
86.64% of 50 DAV
50 DAV is 917,300
|
$35.98
-0.58%
|
7/27/2012
|
$33.91
|
PP = $34.83
|
|
MB = $36.57
|
Most Recent Note - 8/8/2012 4:09:28 PM
Y - Touched a new 52-week high today with below average volume behind its 5th consecutive gain. Gains above a stock's pivot point must have at least +40% above average volume, preferably greater, to trigger a proper technical buy signal.
>>> The latest Featured Stock Update with an annotated graph appeared on 7/27/2012. Click here.
View all notes |
Alert me of new notes |
CANSLIM.net Company Profile |
SEC |
Zacks Reports |
StockTalk |
News |
Chart |
Request a new note
C
A N
S L
I M
|
Symbol/Exchange
Company Name
Industry Group |
PRICE |
CHANGE
(%Change) |
Day High |
Volume
(% DAV)
(% 50 day avg vol) |
52 Wk Hi
% From Hi |
Featured
Date |
Price
Featured |
Pivot Featured |
|
Max Buy |
N
-
NYSE
Netsuite Inc
DIVERSIFIED SERVICES - Business/Management Services
|
$57.25
|
-0.70
-1.21% |
$57.95
|
507,535
67.43% of 50 DAV
50 DAV is 752,700
|
$59.22
-3.33%
|
6/20/2012
|
$51.83
|
PP = $51.88
|
|
MB = $54.47
|
Most Recent Note - 8/8/2012 4:10:23 PM
G - Perched near its 52-week high, holding its ground with volume totals cooling. Found support near its 50 DMA line when encountering recent distributional pressure.
>>> The latest Featured Stock Update with an annotated graph appeared on 7/19/2012. Click here.
View all notes |
Alert me of new notes |
CANSLIM.net Company Profile |
SEC |
Zacks Reports |
StockTalk |
News |
Chart |
Request a new note
C
A N
S L
I M
|
NSM
-
NYSE
Nationstar Mtg Hldgs Inc
FINANCIAL SERVICES - Credit Services
|
$24.97
|
+0.64
2.63% |
$25.09
|
511,915
62.60% of 50 DAV
50 DAV is 817,700
|
$25.11
-0.56%
|
6/27/2012
|
$20.29
|
PP = $20.46
|
|
MB = $21.48
|
Most Recent Note - 8/8/2012 4:00:48 PM
G - Today's gain on light volume led to its best-ever close. It is not near a sound base. Recently found support above prior highs and its 50 DMA line in the $20 area.
>>> The latest Featured Stock Update with an annotated graph appeared on 8/1/2012. Click here.
View all notes |
Alert me of new notes |
CANSLIM.net Company Profile |
SEC |
Zacks Reports |
StockTalk |
News |
Chart |
Request a new note
C
A N
S L
I M
|
RNF
-
NYSE
Rentech Nitrogen Ptnr Lp
CHEMICALS - Agricultural Chemicals
|
$32.63
|
+0.08
0.25% |
$33.35
|
673,394
173.73% of 50 DAV
50 DAV is 387,600
|
$32.82
-0.58%
|
7/27/2012
|
$29.58
|
PP = $30.60
|
|
MB = $32.13
|
Most Recent Note - 8/8/2012 12:32:28 PM
G - Color code is changed to green after getting extended from its prior base. Triggered a technical buy signal yesterday with its considerable gain backed by +266% above average volume as it rallied above its pivot point into new high territory.
>>> The latest Featured Stock Update with an annotated graph appeared on 7/31/2012. Click here.
View all notes |
Alert me of new notes |
CANSLIM.net Company Profile |
SEC |
Zacks Reports |
StockTalk |
News |
Chart |
Request a new note
C
A N
S L
I M
|
SWI
-
NYSE
Solarwinds Inc
COMPUTER SOFTWARE and SERVICES - Application Software
|
$55.88
|
-0.50
-0.89% |
$56.64
|
517,904
40.69% of 50 DAV
50 DAV is 1,272,700
|
$56.80
-1.62%
|
7/25/2012
|
$47.82
|
PP = $47.89
|
|
MB = $50.28
|
Most Recent Note - 8/6/2012 5:30:45 PM
G - Hit a new all-time high today with a 3rd consecutive gain on light volume. Prior highs in the $48 area define initial support to watch on pullbacks.
>>> The latest Featured Stock Update with an annotated graph appeared on 7/30/2012. Click here.
View all notes |
Alert me of new notes |
CANSLIM.net Company Profile |
SEC |
Zacks Reports |
StockTalk |
News |
Chart |
Request a new note
C
A N
S L
I M
|
TDG
-
NYSE
Transdigm Group Inc
AEROSPACE/DEFENSE - Aerospace/Defense Products and; Services
|
$125.13
|
-0.32
-0.26% |
$125.83
|
579,534
121.06% of 50 DAV
50 DAV is 478,700
|
$136.34
-8.22%
|
6/18/2012
|
$127.00
|
PP = $132.79
|
|
MB = $139.43
|
Most Recent Note - 8/7/2012 10:56:59 AM
G - Reported earnings +55% on +42% sales revenues for the quarter ended June 30, 2012 versus the year ago period. Gapped up today and traded above its 50 DMA line. Recent lows in the $117-118 are define near-term support above its 200 DMA line.
>>> The latest Featured Stock Update with an annotated graph appeared on 7/18/2012. Click here.
View all notes |
Alert me of new notes |
CANSLIM.net Company Profile |
SEC |
Zacks Reports |
StockTalk |
News |
Chart |
Request a new note
C
A N
S L
I M
|
Symbol/Exchange
Company Name
Industry Group |
PRICE |
CHANGE
(%Change) |
Day High |
Volume
(% DAV)
(% 50 day avg vol) |
52 Wk Hi
% From Hi |
Featured
Date |
Price
Featured |
Pivot Featured |
|
Max Buy |
VSI
-
NYSE
Vitamin Shoppe Inc
SPECIALTY RETAIL - Specialty Retail, Other
|
$59.80
|
-0.72
-1.19% |
$61.83
|
368,308
99.92% of 50 DAV
50 DAV is 368,600
|
$61.49
-2.75%
|
6/29/2012
|
$54.93
|
PP = $55.03
|
|
MB = $57.78
|
Most Recent Note - 8/7/2012 12:41:45 PM
G - Reported earnings +38% on +13% sales revenues for the quarter ended June 30, 2012 versus the year ago period. Color code was changed to green while hitting new all-time highs above its "max buy" level. Its 50 DMA line and upward trendline define near-term chart support to watch.
>>> The latest Featured Stock Update with an annotated graph appeared on 8/2/2012. Click here.
View all notes |
Alert me of new notes |
CANSLIM.net Company Profile |
SEC |
Zacks Reports |
StockTalk |
News |
Chart |
Request a new note
C
A N
S L
I M
|
|
|
|
THESE ARE NOT BUY RECOMMENDATIONS!
Comments contained in the body of this report are technical
opinions only. The material herein has been obtained
from sources believed to be reliable and accurate, however,
its accuracy and completeness cannot be guaranteed.
This site is not an investment advisor, hence it does
not endorse or recommend any securities or other investments.
Any recommendation contained in this report may not
be suitable for all investors and it is not to be deemed
an offer or solicitation on our part with respect to
the purchase or sale of any securities. All trademarks,
service marks and trade names appearing in this report
are the property of their respective owners, and are
likewise used for identification purposes only.
This report is a service available
only to active Paid Premium Members.
You may opt-out of receiving report notifications
at any time. Questions or comments may be submitted
by writing to Premium Membership Services 665 S.E. 10 Street, Suite 201 Deerfield Beach, FL 33441-5634 or by calling 1-800-965-8307
or 954-785-1121.
|
|
|

