You are not logged in.
This means you
CAN ONLY VIEW reports that were published prior to Monday, April 14, 2025.
You
MUST UPGRADE YOUR MEMBERSHIP if you want to see any current reports.
AFTER MARKET UPDATE - TUESDAY, AUGUST 7TH, 2012
Previous After Market Report Next After Market Report >>>
|
|
|
|
DOW |
+51.09 |
13,168.60 |
+0.39% |
|
Volume |
728,406,260 |
+13% |
|
Volume |
1,851,837,180 |
+24% |
|
NASDAQ |
+25.95 |
3,015.86 |
+0.87% |
|
Advancers |
1,949 |
62% |
|
Advancers |
1,599 |
61% |
|
S&P 500 |
+7.12 |
1,401.35 |
+0.51% |
|
Decliners |
1,065 |
34% |
|
Decliners |
880 |
34% |
|
Russell 2000 |
+6.99 |
801.34 |
+0.88% |
|
52 Wk Highs |
196 |
|
|
52 Wk Highs |
85 |
|
|
S&P 600 |
+3.68 |
450.90 |
+0.82% |
|
52 Wk Lows |
9 |
|
|
52 Wk Lows |
36 |
|
|
 |
Volume Increases as Major Averages Post 3rd Consecutive Gains
Kenneth J. Gruneisen - Passed the CAN SLIM® Master's Exam
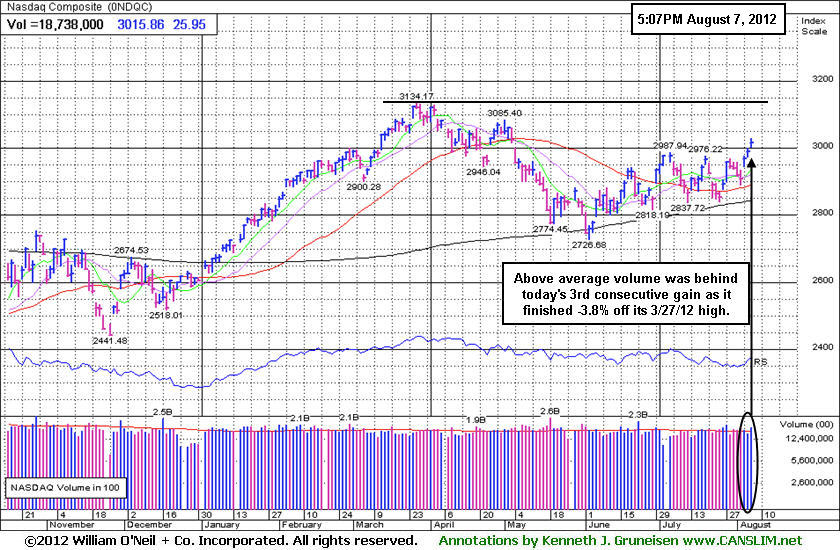
The major averages tallied their third consecutive gains on Tuesday. The volume totals increased behind the gains on the NYSE and on the Nasdaq exchange versus the prior session totals, which indicated an encouraging increase in institutional buying demand behind the market's rise. Advancing issues led decliners by almost 2-1 on the NYSE and on the Nasdaq exchange. The total number of new 52-week highs led new 52-week lows on the NYSE on the Nasdaq exchange, and the new lows total on the NYSE fell into the single digits. There were 61 high-ranked companies from the CANSLIM.net Leaders List made new 52-week highs and appeared on the CANSLIM.net BreakOuts Page, up from the prior session total of 51 stocks. There were gains for 13 of the 16 high-ranked companies currently included on the Featured Stocks Page.
Stocks rallied from the opening bell on optimism that the ECB and Federal Reserve might be getting closer to supplying stimulus to the markets. Regional President Eric Rosengren reiterated his stance to expand monetary policy. Despite this, stocks eased from their best levels after U.S. consumer credit figures for June fell short of expectations.
Five of the 10 sectors on the S&P finished higher, led by a rally in energy stocks as crude oil rose $1.24 to $93.44 per barrel. Chesapeake Energy Corp (CHK +9.44%) paced the advance after their CEO said that natural gas prices could be entering a multi-year up trend. Chevron Corp (CVX +0.57%) edged higher, despite a fire at one of the company's refineries in California. The economically sensitive industrial and material sectors also showed strength. Freeport McMoRan Copper & Gold Inc (FCX +2.71%) and Caterpillar Inc (CAT +1.01%) rallied.
Turning to fixed income, Treasuries were lower along the curve. The benchmark 10-year note was down 1/2 of a point to yield 1.62% and the 30-year bond fell over a point to yield 2.72%.
In terms of the M criteria, last week's gains brought technical improvements to the major indices' trend coupled with an expansion in leadership (stocks hitting new 52-week highs). Any sustainable rally requires a healthy crop of strong leaders hitting new 52-week highs.
Watch for an announcement soon via email concerning new monthly webcasts starting in August and a new "Market's Leading Groups" archives tab to be added on the Premium Member Homepage. These changes are aimed at satisfying member requests and improving the service. If you have questions, comments or suggestions please let us know via the inquiry form here. The most recent WEBCAST (Q2 2012) is available "ON DEMAND" - CLICK HERE.
PICTURED: The Nasdaq Composite Index finished -3.6% off its March 27 2012 high after tallying its 3rd consecutive gain. Volume increased to above average behind the latest gain, an encouraging sign of increased institutional buying demand.
|
 Kenneth J. Gruneisen started out as a licensed stockbroker in August 1987, a couple of months prior to the historic stock market crash that took the Dow Jones Industrial Average down -22.6% in a single day. He has published daily fact-based fundamental and technical analysis on high-ranked stocks online for two decades. Through FACTBASEDINVESTING.COM, Kenneth provides educational articles, news, market commentary, and other information regarding proven investment systems that work in good times and bad.
Comments contained in the body of this report are technical opinions only and are not necessarily those of Gruneisen Growth Corp. The material herein has been obtained from sources believed to be reliable and accurate, however, its accuracy and completeness cannot be guaranteed. Our firm, employees, and customers may effect transactions, including transactions contrary to any recommendation herein, or have positions in the securities mentioned herein or options with respect thereto. Any recommendation contained in this report may not be suitable for all investors and it is not to be deemed an offer or solicitation on our part with respect to the purchase or sale of any securities. |
|
 |
Financial, Tech, and Energy-Related Groups Led Gainers
Kenneth J. Gruneisen - Passed the CAN SLIM® Master's Exam
The Broker/Dealer Index ($XBD +1.89%) and Bank Index ($BKX +0.78%) underpinned the major averages' gains and the Retail Index ($RLX +1.06%) also ratcheted higher on Tuesday. The tech sector was led higher by the Networking Index ($NWX +2.40%), Semiconductor Index ($SOX +2.04%), and the Internet Index ($IIX +1.44%), followed by a smaller gain from the Biotechnology Index ($BTK +0.29%). Strength in energy-related shares helped the Integrated Oil Index ($XOI +1.74%) and the Oil Services Index ($OSX +1.21%) tally gains. The Gold & Silver Index ($XAU +1.33%) also rose.
Charts courtesy www.stockcharts.com
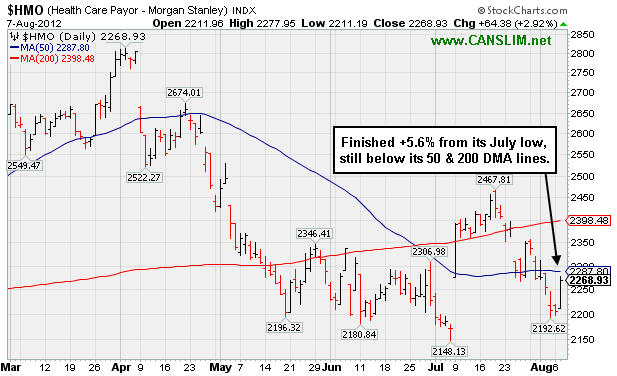
PICTURED: The Healthcare Index ($HMO +2.92%) was a standout gainer on Tuesday. It finished up +5.6% from its July low, yet it remains below its 50-day and 200-day moving average (DMA) lines.
| Oil Services |
$OSX |
225.57 |
+2.70 |
+1.21% |
+4.30% |
| Healthcare |
$HMO |
2,268.93 |
+64.38 |
+2.92% |
-0.56% |
| Integrated Oil |
$XOI |
1,236.57 |
+21.15 |
+1.74% |
+0.61% |
| Semiconductor |
$SOX |
400.06 |
+7.98 |
+2.04% |
+9.77% |
| Networking |
$NWX |
210.17 |
+4.92 |
+2.40% |
-2.32% |
| Internet |
$IIX |
313.79 |
+4.44 |
+1.44% |
+11.37% |
| Broker/Dealer |
$XBD |
80.06 |
+1.48 |
+1.89% |
-3.85% |
| Retail |
$RLX |
632.89 |
+6.62 |
+1.06% |
+20.97% |
| Gold & Silver |
$XAU |
156.15 |
+2.05 |
+1.33% |
-13.56% |
| Bank |
$BKX |
46.48 |
+0.36 |
+0.78% |
+18.03% |
| Biotech |
$BTK |
1,443.71 |
+4.19 |
+0.29% |
+32.28% |
|
|
|
 |
Four Consecutive Volume-Driven Gains For New Highs
Kenneth J. Gruneisen - Passed the CAN SLIM® Master's Exam
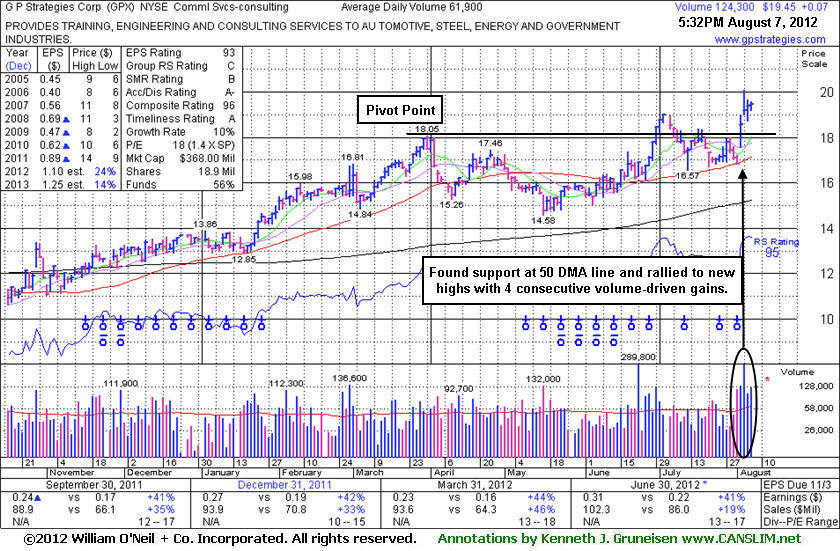
G P Strategies Corp (GPX +$0.07 or +0.36% to $19.45) found support at its 50-day moving average (DMA) line and rallied to new highs with 4 consecutive volume-driven gains. It reported earnings +41% on +19% sales revenues for the Jun '12 quarter. Its last appearance in this FSU section was on 7/06/12 with an annotated graph under the headline, "Prior Highs Define Initial Support Level Following Breakout". A stock's prior highs usually define an initial support level to watch following a technical breakout, and disciplined investors always limit losses if ever any stock falls more than -7% from its purchase price.
In this case, weak action may have prompted some investors to sell based upon its retreat to its 50 DMA line. A stock that is sold can always be bought back if strength returns, but there is no excuse for leaving a small loss open to potentially become a larger and more damaging loss. In the Certification they teach that a secondary buy point exists following the first successful test of the 10-week moving average line after an initial breakout, and the stock can be purchased anywhere from that point up to +5% above the latest high. In this example, that approach may allow for buying efforts up to +5% above its 7/03/12 high ($18.99 X 1.05 = $19.94). However, the risk clearly increases the further one chases a stock above its pivot point or prior highs that an ordinary pullback may lead to losses which could trigger the investment system's selling rules.
When the stock was highlighted in yellow in the 6/29/12 mid-day report (read here) it was noted - "It cleared a valid base earlier this week with volume-driven gains and no overhead supply remains. Quarterly earnings increases above the +25% guideline in the 8 latest quarterly comparisons through Dec '11 satisfy the C criteria. Recent cluster of Insider buying in May-Jun looks similar to that which was reported in Nov, Dec, and Jan as it rose toward and above prior resistance in the $14 area. Prior reports cautioned - 'Recent quarterly comparisons show improving sales revenues and earnings increases but its annual earnings (A criteria) history falls below the investment system's guidelines.'"
The current Up/Down Volume Ratio of 1.9 hints that its shares have been under accumulation during the past 50 days. Company management reportedly owns 25% of its shares, which keeps the directors keenly focused on building and maintaining shareholder value.
|
|
|
Color Codes Explained :
Y - Better candidates highlighted by our
staff of experts.
G - Previously featured
in past reports as yellow but may no longer be buyable under the
guidelines.
***Last / Change / Volume data in this table is the closing quote data***
Symbol/Exchange
Company Name
Industry Group |
PRICE |
CHANGE
(%Change) |
Day High |
Volume
(% DAV)
(% 50 day avg vol) |
52 Wk Hi
% From Hi |
Featured
Date |
Price
Featured |
Pivot Featured |
|
Max Buy |
ALXN
-
NASDAQ
Alexion Pharmaceuticals
DRUGS - Drug Manufacturers - Other
|
$105.10
|
-1.03
-0.97% |
$105.96
|
854,294
49.01% of 50 DAV
50 DAV is 1,743,000
|
$109.96
-4.42%
|
5/1/2012
|
$91.73
|
PP = $95.11
|
|
MB = $99.87
|
Most Recent Note - 8/3/2012 11:57:15 AM
G - Gapped up today while consolidating well above chart support defined by its 50 DMA line (now $97.33). Reported earnings +62% on +48% sales revenues for the quarter ended June 30, 2012 versus the year ago period.
>>> The latest Featured Stock Update with an annotated graph appeared on 7/25/2012. Click here.
View all notes |
Alert me of new notes |
CANSLIM.net Company Profile |
SEC |
Zacks Reports |
StockTalk |
News |
Chart |
Request a new note
C
A N
S L
I M


|
ASPS
-
NASDAQ
Altisource Ptf Sltns Sa
REAL ESTATE - Property Management/Developmen
|
$82.79
|
+0.93
1.14% |
$83.83
|
121,636
89.64% of 50 DAV
50 DAV is 135,700
|
$82.83
-0.05%
|
6/5/2012
|
$60.01
|
PP = $63.00
|
|
MB = $66.15
|
Most Recent Note - 8/6/2012 11:51:30 AM
G - Gapped up today, on track for a 7th consecutive gain and hitting another new high, getting more extended from its prior base. Recent low and its 50 DMA line define near-term support to watch. See the latest FSU analysis for more details and an annotated graph.
>>> The latest Featured Stock Update with an annotated graph appeared on 8/3/2012. Click here.
View all notes |
Alert me of new notes |
CANSLIM.net Company Profile |
SEC |
Zacks Reports |
StockTalk |
News |
Chart |
Request a new note
C
A N
S L
I M
|
CFNL
-
NASDAQ
Cardinal Financial Corp
BANKING - Regional - Southeast Banks
|
$12.86
|
+0.25
1.98% |
$13.00
|
95,788
125.05% of 50 DAV
50 DAV is 76,600
|
$13.21
-2.65%
|
7/20/2012
|
$12.85
|
PP = $12.41
|
|
MB = $13.03
|
 Most Recent Note - 8/7/2012 4:24:18 PM
Y - Rebounded further above its pivot point with today's gain on +20% above average volume. Its 50 DMA line and prior chart highs define important near-term support to watch.
>>> The latest Featured Stock Update with an annotated graph appeared on 7/26/2012. Click here.
View all notes |
Alert me of new notes |
CANSLIM.net Company Profile |
SEC |
Zacks Reports |
StockTalk |
News |
Chart |
Request a new note
C
A N
S L
I M
|
CMCSA
-
NASDAQ
Comcast Corp Cl A
MEDIA - CATV Systems
|
$34.55
|
-0.39
-1.12% |
$35.16
|
18,691,581
131.41% of 50 DAV
50 DAV is 14,224,000
|
$35.09
-1.54%
|
6/11/2012
|
$29.94
|
PP = $30.98
|
|
MB = $32.53
|
Most Recent Note - 8/7/2012 11:03:32 AM
G - Hit another new 52-week high today, getting more extended from its prior base with a streak of recent gains backed by above average volume. Gapped up on 8/01/12 after reporting earnings +19% on +6% sales revenues for the Jun '12 quarter, below the fact-based investment system's +25% minimum guideline for the C criteria, but better than Street expectations.
>>> The latest Featured Stock Update with an annotated graph appeared on 7/11/2012. Click here.
View all notes |
Alert me of new notes |
CANSLIM.net Company Profile |
SEC |
Zacks Reports |
StockTalk |
News |
Chart |
Request a new note
C
A N
S L
I M
|
DG
-
NYSE
Dollar General Corp
RETAIL - Discount, Variety Stores
|
$52.72
|
+1.18
2.29% |
$52.97
|
2,164,740
54.23% of 50 DAV
50 DAV is 3,991,600
|
$56.04
-5.92%
|
7/16/2012
|
$54.68
|
PP = $56.14
|
|
MB = $58.95
|
Most Recent Note - 8/7/2012 11:00:14 AM
G - Consolidating near its 50 DMA line with volume totals cooling in recent weeks after encountering distributional pressure.
>>> The latest Featured Stock Update with an annotated graph appeared on 7/12/2012. Click here.
View all notes |
Alert me of new notes |
CANSLIM.net Company Profile |
SEC |
Zacks Reports |
StockTalk |
News |
Chart |
Request a new note
C
A N
S L
I M
|
Symbol/Exchange
Company Name
Industry Group |
PRICE |
CHANGE
(%Change) |
Day High |
Volume
(% DAV)
(% 50 day avg vol) |
52 Wk Hi
% From Hi |
Featured
Date |
Price
Featured |
Pivot Featured |
|
Max Buy |
ECPG
-
NASDAQ
Encore Capital Group Inc
FINANCIAL SERVICES - Credit Services
|
$29.95
|
-0.15
-0.50% |
$30.36
|
90,755
60.18% of 50 DAV
50 DAV is 150,800
|
$30.47
-1.71%
|
8/3/2012
|
$29.91
|
PP = $30.45
|
|
MB = $31.97
|
Most Recent Note - 8/6/2012 6:13:22 PM
Y - Perched near its pivot point based on its 7/10/12 high after a short "square box" base. A volume-driven gain and close above its pivot point may trigger a technical buy signal. See the latest FSU analysis for more details and a new annotated graph.
>>> The latest Featured Stock Update with an annotated graph appeared on 8/6/2012. Click here.
View all notes |
Alert me of new notes |
CANSLIM.net Company Profile |
SEC |
Zacks Reports |
StockTalk |
News |
Chart |
Request a new note
C
A N
S L
I M
|
EXPE
-
NASDAQ
Expedia Inc
INTERNET - Internet Information Providers
|
$58.87
|
+0.45
0.77% |
$59.50
|
4,809,439
125.40% of 50 DAV
50 DAV is 3,835,300
|
$58.80
0.12%
|
4/27/2012
|
$41.80
|
PP = $35.57
|
|
MB = $37.35
|
Most Recent Note - 8/6/2012 5:32:46 PM
G - Posted a 3rd consecutive gain today on below average volume for a new high close. Reported earnings +24% on +14% sales revenues for the quarter ending June 30, 2012 versus the year ago period, just below the +25% minimum earnings guideline for buy candidates.
>>> The latest Featured Stock Update with an annotated graph appeared on 7/10/2012. Click here.
View all notes |
Alert me of new notes |
CANSLIM.net Company Profile |
SEC |
Zacks Reports |
StockTalk |
News |
Chart |
Request a new note
C
A N
S L
I M
|
GNC
-
NYSE
G N C Holdings Inc
RETAIL - Drug Stores
|
$39.06
|
+0.57
1.48% |
$39.20
|
1,460,222
58.77% of 50 DAV
50 DAV is 2,484,600
|
$42.70
-8.52%
|
6/29/2012
|
$39.20
|
PP = $40.00
|
|
MB = $42.00
|
Most Recent Note - 8/6/2012 5:33:33 PM
Y - Quietly consolidating just above its 50 DMA line today. Reported earnings +59% on +19% sales revenues for the quarter ended June 30, 2012 versus the year ago period, beating expectations, and it also raised guidance for FY '12.
>>> The latest Featured Stock Update with an annotated graph appeared on 7/5/2012. Click here.
View all notes |
Alert me of new notes |
CANSLIM.net Company Profile |
SEC |
Zacks Reports |
StockTalk |
News |
Chart |
Request a new note
C
A N
S L
I M
|
GPX
-
NYSE
G P Strategies Corp
DIVERSIFIED SERVICES - Education and Training Services
|
$19.45
|
+0.07
0.36% |
$19.59
|
125,303
202.43% of 50 DAV
50 DAV is 61,900
|
$20.08
-3.14%
|
6/29/2012
|
$18.01
|
PP = $18.15
|
|
MB = $19.06
|
Most Recent Note - 8/7/2012 6:01:07 PM
G - Perched at its 52-week high after 4 consecutive volume-driven gains. See the latest FSU analysis for more details and a new annotated graph.
>>> The latest Featured Stock Update with an annotated graph appeared on 8/7/2012. Click here.
View all notes |
Alert me of new notes |
CANSLIM.net Company Profile |
SEC |
Zacks Reports |
StockTalk |
News |
Chart |
Request a new note
C
A N
S L
I M
|
HMSY
-
NASDAQ
H M S Holdings Corp
COMPUTER SOFTWARE and SERVICES - Healthcare Information Service
|
$34.95
|
+0.21
0.60% |
$35.31
|
727,201
77.98% of 50 DAV
50 DAV is 932,500
|
$35.98
-2.86%
|
7/27/2012
|
$33.91
|
PP = $34.83
|
|
MB = $36.57
|
Most Recent Note - 8/7/2012 11:01:35 AM
Y - Still consolidating in a tight range near its 52-week high. Subsequent volume-driven gains above its pivot may trigger a technical buy signal.
>>> The latest Featured Stock Update with an annotated graph appeared on 7/27/2012. Click here.
View all notes |
Alert me of new notes |
CANSLIM.net Company Profile |
SEC |
Zacks Reports |
StockTalk |
News |
Chart |
Request a new note
C
A N
S L
I M
|
Symbol/Exchange
Company Name
Industry Group |
PRICE |
CHANGE
(%Change) |
Day High |
Volume
(% DAV)
(% 50 day avg vol) |
52 Wk Hi
% From Hi |
Featured
Date |
Price
Featured |
Pivot Featured |
|
Max Buy |
N
-
NYSE
Netsuite Inc
DIVERSIFIED SERVICES - Business/Management Services
|
$57.95
|
+0.05
0.09% |
$59.22
|
618,566
82.71% of 50 DAV
50 DAV is 747,900
|
$58.56
-1.04%
|
6/20/2012
|
$51.83
|
PP = $51.88
|
|
MB = $54.47
|
Most Recent Note - 8/3/2012 12:51:44 PM
G - Color code is changed to green after rallying back above its "max buy" level. Found support near its 50 DMA line when encountering recent distributional pressure.
>>> The latest Featured Stock Update with an annotated graph appeared on 7/19/2012. Click here.
View all notes |
Alert me of new notes |
CANSLIM.net Company Profile |
SEC |
Zacks Reports |
StockTalk |
News |
Chart |
Request a new note
C
A N
S L
I M
|
NSM
-
NYSE
Nationstar Mtg Hldgs Inc
FINANCIAL SERVICES - Credit Services
|
$24.33
|
+0.46
1.93% |
$24.63
|
383,270
46.24% of 50 DAV
50 DAV is 828,800
|
$25.11
-3.11%
|
6/27/2012
|
$20.29
|
PP = $20.46
|
|
MB = $21.48
|
Most Recent Note - 8/7/2012 11:05:09 AM
G - It is not near a sound base, but still consolidating above its "max buy" level after recently finding support above prior highs and its 50 DMA line in the $20 area.
>>> The latest Featured Stock Update with an annotated graph appeared on 8/1/2012. Click here.
View all notes |
Alert me of new notes |
CANSLIM.net Company Profile |
SEC |
Zacks Reports |
StockTalk |
News |
Chart |
Request a new note
C
A N
S L
I M
|
RNF
-
NYSE
Rentech Nitrogen Ptnr Lp
CHEMICALS - Agricultural Chemicals
|
$32.55
|
+2.15
7.07% |
$32.82
|
1,331,923
366.42% of 50 DAV
50 DAV is 363,500
|
$31.34
3.86%
|
7/27/2012
|
$29.58
|
PP = $30.60
|
|
MB = $32.13
|
Most Recent Note - 8/7/2012 12:38:14 PM
Y - Hit a new 52-week high with today's volume-driven gain above its pivot point. A strong close above that threshold with at least +40% above average volume behind its gain may trigger a technical buy signal.
>>> The latest Featured Stock Update with an annotated graph appeared on 7/31/2012. Click here.
View all notes |
Alert me of new notes |
CANSLIM.net Company Profile |
SEC |
Zacks Reports |
StockTalk |
News |
Chart |
Request a new note
C
A N
S L
I M
|
SWI
-
NYSE
Solarwinds Inc
COMPUTER SOFTWARE and SERVICES - Application Software
|
$56.38
|
+0.50
0.89% |
$56.80
|
890,771
70.28% of 50 DAV
50 DAV is 1,267,500
|
$56.24
0.25%
|
7/25/2012
|
$47.82
|
PP = $47.89
|
|
MB = $50.28
|
Most Recent Note - 8/6/2012 5:30:45 PM
G - Hit a new all-time high today with a 3rd consecutive gain on light volume. Prior highs in the $48 area define initial support to watch on pullbacks.
>>> The latest Featured Stock Update with an annotated graph appeared on 7/30/2012. Click here.
View all notes |
Alert me of new notes |
CANSLIM.net Company Profile |
SEC |
Zacks Reports |
StockTalk |
News |
Chart |
Request a new note
C
A N
S L
I M
|
TDG
-
NYSE
Transdigm Group Inc
AEROSPACE/DEFENSE - Aerospace/Defense Products and; Services
|
$125.45
|
+2.47
2.01% |
$130.52
|
609,243
128.99% of 50 DAV
50 DAV is 472,300
|
$136.34
-7.99%
|
6/18/2012
|
$127.00
|
PP = $132.79
|
|
MB = $139.43
|
Most Recent Note - 8/7/2012 10:56:59 AM
G - Reported earnings +55% on +42% sales revenues for the quarter ended June 30, 2012 versus the year ago period. Gapped up today and traded above its 50 DMA line. Recent lows in the $117-118 are define near-term support above its 200 DMA line.
>>> The latest Featured Stock Update with an annotated graph appeared on 7/18/2012. Click here.
View all notes |
Alert me of new notes |
CANSLIM.net Company Profile |
SEC |
Zacks Reports |
StockTalk |
News |
Chart |
Request a new note
C
A N
S L
I M
|
Symbol/Exchange
Company Name
Industry Group |
PRICE |
CHANGE
(%Change) |
Day High |
Volume
(% DAV)
(% 50 day avg vol) |
52 Wk Hi
% From Hi |
Featured
Date |
Price
Featured |
Pivot Featured |
|
Max Buy |
VSI
-
NYSE
Vitamin Shoppe Inc
SPECIALTY RETAIL - Specialty Retail, Other
|
$60.52
|
+3.81
6.72% |
$61.49
|
958,315
270.02% of 50 DAV
50 DAV is 354,900
|
$58.88
2.79%
|
6/29/2012
|
$54.93
|
PP = $55.03
|
|
MB = $57.78
|
Most Recent Note - 8/7/2012 12:41:45 PM
G - Reported earnings +38% on +13% sales revenues for the quarter ended June 30, 2012 versus the year ago period. Color code was changed to green while hitting new all-time highs above its "max buy" level. Its 50 DMA line and upward trendline define near-term chart support to watch.
>>> The latest Featured Stock Update with an annotated graph appeared on 8/2/2012. Click here.
View all notes |
Alert me of new notes |
CANSLIM.net Company Profile |
SEC |
Zacks Reports |
StockTalk |
News |
Chart |
Request a new note
C
A N
S L
I M
|
|
|
|
THESE ARE NOT BUY RECOMMENDATIONS!
Comments contained in the body of this report are technical
opinions only. The material herein has been obtained
from sources believed to be reliable and accurate, however,
its accuracy and completeness cannot be guaranteed.
This site is not an investment advisor, hence it does
not endorse or recommend any securities or other investments.
Any recommendation contained in this report may not
be suitable for all investors and it is not to be deemed
an offer or solicitation on our part with respect to
the purchase or sale of any securities. All trademarks,
service marks and trade names appearing in this report
are the property of their respective owners, and are
likewise used for identification purposes only.
This report is a service available
only to active Paid Premium Members.
You may opt-out of receiving report notifications
at any time. Questions or comments may be submitted
by writing to Premium Membership Services 665 S.E. 10 Street, Suite 201 Deerfield Beach, FL 33441-5634 or by calling 1-800-965-8307
or 954-785-1121.
|
|
|

