You are not logged in.
This means you
CAN ONLY VIEW reports that were published prior to Monday, April 14, 2025.
You
MUST UPGRADE YOUR MEMBERSHIP if you want to see any current reports.
AFTER MARKET UPDATE - FRIDAY, AUGUST 7TH, 2009
Previous After Market Report Next After Market Report >>>
|
|
|
|
DOW |
+113.81 |
9,370.07 |
+1.23% |
|
Volume |
1,467,766,720 |
+6% |
|
Volume |
2,510,664,950 |
+2% |
|
NASDAQ |
+27.09 |
2,000.25 |
+1.37% |
|
Advancers |
2,351 |
75% |
|
Advancers |
1,955 |
68% |
|
S&P 500 |
+13.40 |
1,010.48 |
+1.34% |
|
Decliners |
689 |
22% |
|
Decliners |
782 |
27% |
|
Russell 2000 |
+14.78 |
572.40 |
+2.65% |
|
52 Wk Highs |
130 |
|
|
52 Wk Highs |
55 |
|
|
S&P 600 |
+8.09 |
304.25 |
+2.73% |
|
52 Wk Lows |
0 |
|
|
52 Wk Lows |
2 |
|
|
 |
Major Averages Post Fourth Consecutive Weekly Gains
Adam Sarhan, Contributing Writer,
The major averages ended nicely higher after the government reported a stronger than expected jobs report. Volume was reported higher on the NYSE and Nasdaq exchange. Advancers led decliners by more than a 3-to-1 ratio on the NYSE and by more than a 2-to-1 ratio on the Nasdaq exchange. There were 23 high-ranked companies from the CANSLIM.net Leaders List that made a new 52-week high and appeared on the CANSLIM.net BreakOuts Page, up from the 19 issues that appeared on the prior session. On both exchanges new 52-week highs still significantly outnumbered 52-week lows, and new lows were in the single digits again.
Before Friday's opening bell, the Labor Department said that employers slashed -247,000 jobs in July which was stronger than the Street's estimate of a -325,000 decline. The unemployment rate ticked lower to 9.4% which was the first decline in over a year. June's -9.5% unemployment rate was the highest reading since the early 1980's. In April, US employers slashed a whopping 663,000 jobs which was the lowest level in more than 60 years! Since then, the job losses have been smaller which has been considered a "good" sign by Wall Street.
One of the strongest catalysts for sending the market higher this quarter has been earnings. Not only have earnings exceeded the average analyst's estimates companies have also raised guidance. Companies have lowered guidance in each of the past 3 quarters so the fact that they stopped lowering guidance is another net "positive" for stocks. Earnings so far have not been stellar as the main driver for higher numbers has been cutting costs, not higher sales. However, the massive influx of world wide government stimulus is starting to kick in which is starting to trickle down.
Money Management Services - WE FOLLOW THE RULES! DOES YOUR BROKER?
Managing money can be difficult at times. Are you looking for a money manager who follows a proven set of rules? If you are frustrated because your broker/money manager does not follow all of the rules of this powerful investment system, contact us. We have veterans who have been in business for over 20 years who pride themselves on their ability to closely follow all the rules of the investment system in both bull and bear markets. You may inquire about having your account professionally managed using this fact-based investment system by clicking HERE. *Accounts over $250,000 please. ** Serious inquiries only.
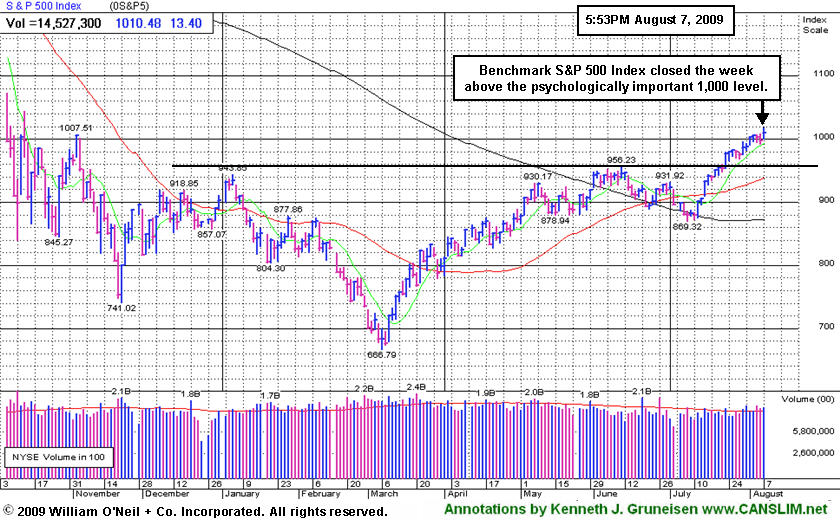
PICTURED: The S&P 500 Index closed the week above the psychologically important 1,000 level.
|
|
|
 |
Financial & Retail Groups Provide Positive Influence
Kenneth J. Gruneisen - Passed the CAN SLIM® Master's Exam
Influential gains from the Broker/Dealer Index ($XBD +2.32%), Bank Index ($BKX +3.55%), and Retail Index ($RLX +3.61%) once again helped to underpin the major averages' healthier action. The energy group did not participate in Friday's mostly positive action as the Oil Services Index ($OSX -0.22%) and Integrated Oil Index ($XOI -0.19%) edged lower, and the Gold & Silver Index ($XAU -2.48%) was a standout laggard. The Healthcare Index ($HMO +1.97%) posted a healthy gain. The tech sector's action was mixed, with gains from the Internet Index ($IIX +1.00%) and Networking Index ($NWX +2.06%) countered a bit by modest losses for the Semiconductor Index ($SOX -0.44%) and Biotechnology Index ($BTK -0.40%).
Charts courtesy www.stockcharts.com
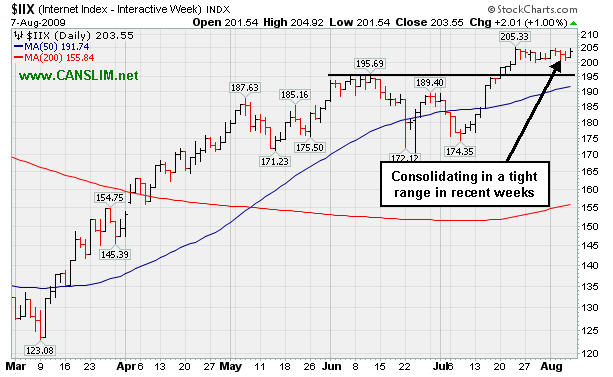
PICTURED: The Internet Index ($IIX +1.00%) has been consolidating in a tight range in recent weeks above prior chart highs.
| Oil Services |
$OSX |
171.21 |
-0.38 |
-0.22% |
+41.04% |
| Healthcare |
$HMO |
1,153.57 |
+22.27 |
+1.97% |
+20.14% |
| Integrated Oil |
$XOI |
957.81 |
-1.87 |
-0.19% |
-2.23% |
| Semiconductor |
$SOX |
298.53 |
-1.31 |
-0.44% |
+40.70% |
| Networking |
$NWX |
202.98 |
+4.10 |
+2.06% |
+41.07% |
| Internet |
$IIX |
203.55 |
+2.01 |
+1.00% |
+52.16% |
| Broker/Dealer |
$XBD |
112.04 |
+2.54 |
+2.32% |
+44.62% |
| Retail |
$RLX |
372.70 |
+12.98 |
+3.61% |
+33.46% |
| Gold & Silver |
$XAU |
148.94 |
-3.78 |
-2.48% |
+20.26% |
| Bank |
$BKX |
45.45 |
+1.56 |
+3.55% |
+2.55% |
| Biotech |
$BTK |
860.36 |
-3.44 |
-0.40% |
+32.94% |
|
|
|
 |
Distributional Pressure After Steep Climb
Kenneth J. Gruneisen - Passed the CAN SLIM® Master's Exam
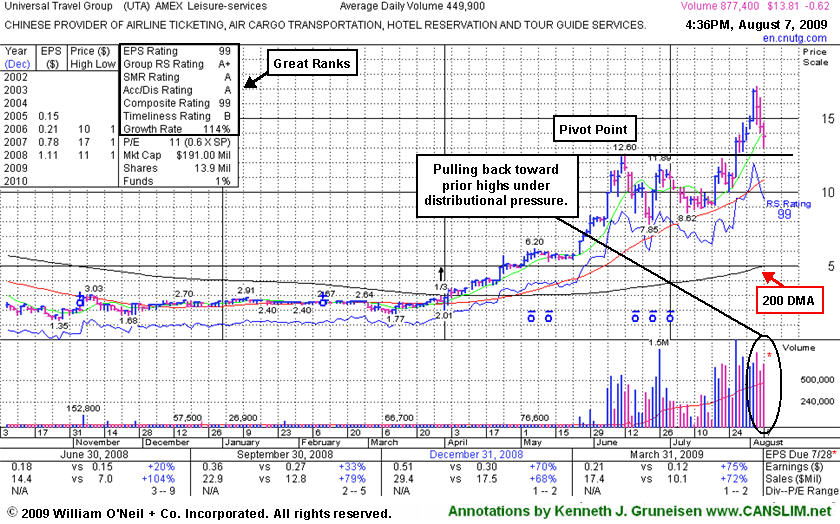
Universal Travel Group (UTA -$0.55 or -3.81% to $13.81) has been encountering distributional pressure, pulling back toward prior chart highs that are a very important support level now. The Chinese provider of airline tickets and travel related services gapped up on 7/28/09 when rising from a choppy 6-week base above its 50-day moving average line. Strong action prompted it to be featured in yellow at $12.87 in that day's mid-day breakouts report (read here), and it has subsequently traded as much as +33.64% higher. Its considerable gain above its pivot point came with very heavy volume nearly 6 times its average daily trading total. Heavy volume, well above the minimum +50% above average volume guideline, has accompanied many of the market's biggest historic winners.
Keep in mind that the investment system has a rule that says whenever a stock rises +20% or more in 2-3 weeks or less from when it was bought, that stock should be held for at least 8 weeks and be given a chance to produce bigger gains. The rule was created because the market's most explosive winners often got off to a strong start. It could be worth giving UTA the benefit of the doubt, but also keep in mind that there is a lot of risk after its many-fold run from its March lows. The fact that it is trading more than +100% above its 200-day moving average line gives investors another reason to be especially disciplined about making proper entries and exits. Always limit losses if any stock falls more than -7% from your buy point. Subsequent deterioration leading to any closes back under its prior high closes would raise concerns by negating its latest bullish breakout.
|
|
|
Color Codes Explained :
Y - Better candidates highlighted by our
staff of experts.
G - Previously featured
in past reports as yellow but may no longer be buyable under the
guidelines.
***Last / Change / Volume quote data in this table corresponds with the timestamp on the note***
Symbol/Exchange
Company Name
Industry Group |
Last |
Chg. |
Vol
% DAV |
Date Featured |
Price Featured |
Latest Pivot Point
Featured |
Status |
| Latest Max Buy Price |
ASIA
-
|
$18.16
|
-0.57
|
487,800
62% DAV
784,033
|
8/2/2009
(Date
Featured) |
$19.27
(Price
Featured) |
PP = $22.19 |
Y |
| MB = $23.30 |
Most Recent Note - 8/6/2009 4:25:04 PM
Y - Loss today on light volume, falling near its 50 DMA line. Holding its ground above that important short term average with lighter volume trading since its its 7/30/09 gap up gain on heavy volume. It was just featured in the August 2009 CANSLIM.net News available here
There are no Featured Stock Updates™ available for this stock at this time. You may request one by clicking here
|
|
C
A
S
I |
News |
Chart |
SEC
View all notes Alert
me of new notes
Company
Profile
|
CPLA
- NASDAQ
Capella Education Co
DIVERSIFIED SERVICES - Education and Training Services
|
$64.16
|
+0.77
|
107,700
50% DAV
215,923
|
7/9/2009
(Date
Featured) |
$59.69
(Price
Featured) |
PP = $62.06 |
Y |
| MB = $65.16 |
Most Recent Note - 8/6/2009 5:33:41 PM
Y - Quietly consolidating near its 52-week high, above its pivot point but under its max buy level since its 7/28/09 breakout. Featured in yellow in the 7/09/09 Mid-Day BreakOuts Report (read here). The group has shown some leadership, yet currently has a low Relative Strength. CPLA is a high-ranked leader in the Commercial Services-Schools Group. Its small supply of only 13.9 million shares in the float could contribute to greater price volatility in the event of institutional accumulation or distribution. The number of top-rated funds owning an interest rose from 91 in Sept '08, to 134 as of March '09, which is reassuring with respect to the I criteria. It has a very good earnings history that satisfies the C & A criteria, while recent quarters showed steady sales revenues increases in the +17-18% range.
>>> The latest Featured Stock Update with an annotated graph appeared on 8/6/2009. click here.
|
|
C
A
S
I |
News |
Chart |
SEC
View all notes Alert
me of new notes
Company
Profile
|
GMCR
- NASDAQ
Green Mtn Coffee Roastrs
FOOD & BEVERAGE - Processed & Packaged Goods
|
$69.90
|
+2.02
|
4,446,300
283% DAV
1,570,848
|
7/17/2009
(Date
Featured) |
$60.15
(Price
Featured) |
PP = $63.79 |
G |
| MB = $66.98 |
Most Recent Note - 8/6/2009 5:39:22 PM
G - Holding its ground since its 8/03/09 gap down after reporting plans for an offering of 4 million shares underwritten by BofA Merrill Lynch. Prior highs in the $62-63 area are initial chart support to watch above its 50 DMA line. Do not be confused by the 3:2 stock split effective 6/09/09. GMCR traded up more than +168% since appearing with an annotated graph under the headline "It May Soon Be Time To Go Green" when featured in the January 2009 CANSLIM.net News (read here).
>>> The latest Featured Stock Update with an annotated graph appeared on 7/30/2009. click here.
|
|
C
A
S
I |
News |
Chart |
SEC
View all notes Alert
me of new notes
Company
Profile
|
HMSY
- NASDAQ
H M S Holdings Corp
COMPUTER SOFTWARE & SERVICES - Healthcare Information Service
|
$35.99
|
-0.06
|
448,700
116% DAV
387,620
|
2/20/2009
(Date
Featured) |
$34.08
(Price
Featured) |
PP = $38.38 |
G |
| MB = $40.30 |
Most Recent Note - 8/6/2009 5:44:08 PM
G - Its loss today on near average volume followed a few damaging sessions that recently drove it well below its 50 DMA line, raising concerns and triggering technical sell signal. Its 7/31/09 gap down and 50 DMA violation following its latest quarterly financial report. This high-ranked Commercial Services - Healthcare firm's prior highs in the $38 area are an important support level. A gap up gain on 6/16/09 with heavy volume triggered a technical buy signal.
>>> The latest Featured Stock Update with an annotated graph appeared on 8/4/2009. click here.
|
|
C
A
S
I |
News |
Chart |
SEC
View all notes Alert
me of new notes
Company
Profile
|
NTES
- NASDAQ
Netease Inc Adr
INTERNET - Internet Information Providers
|
$43.75
|
+0.23
|
1,126,100
49% DAV
2,285,005
|
7/17/2009
(Date
Featured) |
$39.29
(Price
Featured) |
PP = $38.74 |
G |
| MB = $40.68 |
Most Recent Note - 8/6/2009 5:55:29 PM
G - Gapped down today for a loss on lighter volume. It is still extended from its latest sound base, with the nearest chart support at its pivot point. First featured in the 3/31/09 CANSLIM.net Mid-Day Breakouts Report (read here).
>>> The latest Featured Stock Update with an annotated graph appeared on 7/23/2009. click here.
|
|
C
A
S
I |
News |
Chart |
SEC
View all notes Alert
me of new notes
Company
Profile
|
NVEC
- NASDAQ
N V E Corp
ELECTRONICS - Semiconductor - Specialized
|
$53.37
|
+2.33
|
120,600
123% DAV
97,826
|
3/13/2009
(Date
Featured) |
$33.85
(Price
Featured) |
PP = $49.60 |
Y |
| MB = $52.08 |
Most Recent Note - 8/6/2009 6:03:15 PM
Y - Considerable loss today on slightly above average volume, sinking under its "max buy" level toward its 50 DMA line to its lowest level since its 7/23/09 breakout. Prior highs are now an important support level. Its color code is changed to yellow based on its consolidation. Deterioration under its prior chart high ($49.50) would raise concerns. Featured in the 7/23/09 Mid-Day BreakOuts Report (read here) after it gapped up for a considerable gain on heavy volume following news of stronger sales revenues (+41%) and solid earnings increases for the quarter ended June 30, 2009. The technical action was described as a "breakaway gap" from a valid ascending base. Quarterly sales revenues in the 6 million dollar range are still rather minuscule, leaving concerns.
>>> The latest Featured Stock Update with an annotated graph appeared on 8/3/2009. click here.
|
|
C
A
S
I |
News |
Chart |
SEC
View all notes Alert
me of new notes
Company
Profile
|
PEGA
- NASDAQ
Pegasystems Inc
COMPUTER SOFTWARE & SERVICES - Business Software & Services
|
$31.98
|
+0.16
|
302,100
102% DAV
296,355
|
7/29/2009
(Date
Featured) |
$27.53
(Price
Featured) |
PP = $27.49 |
G |
| MB = $28.86 |
Most Recent Note - 8/6/2009 6:03:57 PM
G - Held its ground today following a considerable 8/05/09 gain with nearly 5 times average volume after reporting strong Q2 earnings and raising guidance. The high-ranked software firm triggered a technical buy signal when rising from the "double bottom" base when it was featured in the 7/29/09 mid-day report (read here). The previously noted downturn in annual earnings (the A criteria) from 2003 to 2006 has been followed by a solid turn around and big earnings increases in '07 and '08, and Street expectations for '09 are calling for well above +25% growth.
>>> The latest Featured Stock Update with an annotated graph appeared on 7/29/2009. click here.
|
|
C
A
S
I |
News |
Chart |
SEC
View all notes Alert
me of new notes
Company
Profile
|
TNDM
- NASDAQ
Tandem Diabetes Care Inc
TELECOMMUNICATIONS - Wireless Communications
|
$28.85
|
+0.35
|
1,202,300
124% DAV
973,019
|
3/2/2009
(Date
Featured) |
$18.89
(Price
Featured) |
PP = $32.67 |
G |
| MB = $34.30 |
Most Recent Note - 8/6/2009 6:13:10 PM
G - Initially gapped up today after reporting solid earnings and sales increases for the quarter ended June 30, 2009, then quickly sliced under its 50 DMA line - action indicative of distributional pressure. It rebounded off its session lows but closed below its short-term average and finished in the lower half of its wide intra-day trading range. Color code is changed to green because technically damaging action has negated its 8/03/09 breakout, raising concerns and triggering technical sell signals. A prompt show of support repairing the 50 DMA breach is necessary to help its outlook, otherwise the odds favor that it will spend more time consolidating and it could encounter more distributional pressure. It traded up as much as +82.95% since first featured at $18.89 in the 3/02/09 Mid-Day BreakOuts Report (read here).
>>> The latest Featured Stock Update with an annotated graph appeared on 8/5/2009. click here.
|
|
C
A
S
I |
News |
Chart |
SEC
View all notes Alert
me of new notes
Company
Profile
|
UTA
-
|
$13.88
|
-0.55
|
880,000
189% DAV
465,583
|
7/28/2009
(Date
Featured) |
$12.87
(Price
Featured) |
PP = $12.70 |
G |
| MB = $13.34 |
Most Recent Note - 8/6/2009 6:15:30 PM
G - Negatively reversed again today following a negative reversal on the prior session after it another new 52-week high. A streak of 4 consecutive gains with above average volume lifted it way above its "max buy" level. Prior chart highs in the $12 area are now an important support level to watch on pullbacks. Strong action prompted it to be featured in yellow with pivot point and max buy levels noted in the 7/28/09 mid-day breakouts report (read here), with additional analysis included in the after market update (read here). This Chinese provider of airline tickets and travel related services gapped up on 7/28/09, rising from a choppy 6-week base with a considerable gain on very heavy volume.
>>> The latest Featured Stock Update with an annotated graph appeared on 8/7/2009. click here.
|
|
C
A
S
I |
News |
Chart |
SEC
View all notes Alert
me of new notes
Company
Profile
|
|
|
|
THESE ARE NOT BUY RECOMMENDATIONS!
Comments contained in the body of this report are technical
opinions only. The material herein has been obtained
from sources believed to be reliable and accurate, however,
its accuracy and completeness cannot be guaranteed.
This site is not an investment advisor, hence it does
not endorse or recommend any securities or other investments.
Any recommendation contained in this report may not
be suitable for all investors and it is not to be deemed
an offer or solicitation on our part with respect to
the purchase or sale of any securities. All trademarks,
service marks and trade names appearing in this report
are the property of their respective owners, and are
likewise used for identification purposes only.
This report is a service available
only to active Paid Premium Members.
You may opt-out of receiving report notifications
at any time. Questions or comments may be submitted
by writing to Premium Membership Services 665 S.E. 10 Street, Suite 201 Deerfield Beach, FL 33441-5634 or by calling 1-800-965-8307
or 954-785-1121.
|
|
|


