You are not logged in.
This means you
CAN ONLY VIEW reports that were published prior to Monday, April 14, 2025.
You
MUST UPGRADE YOUR MEMBERSHIP if you want to see any current reports.
AFTER MARKET UPDATE - TUESDAY, AUGUST 6TH, 2013
Previous After Market Report Next After Market Report >>>
|
|
|
|
DOW |
-93.39 |
15,518.74 |
-0.60% |
|
Volume |
658,068,270 |
+23% |
|
Volume |
1,489,858,080 |
+4% |
|
NASDAQ |
-27.18 |
3,665.77 |
-0.74% |
|
Advancers |
760 |
24% |
|
Advancers |
763 |
29% |
|
S&P 500 |
-9.77 |
1,697.37 |
-0.57% |
|
Decliners |
2,268 |
73% |
|
Decliners |
1,734 |
67% |
|
Russell 2000 |
-10.87 |
1,052.14 |
-1.02% |
|
52 Wk Highs |
124 |
|
|
52 Wk Highs |
150 |
|
|
S&P 600 |
-5.74 |
592.84 |
-0.96% |
|
52 Wk Lows |
187 |
|
|
52 Wk Lows |
15 |
|
|
 |
Breadth Negative as Major Averages Retreat from Highs
Kenneth J. Gruneisen - Passed the CAN SLIM® Master's Exam
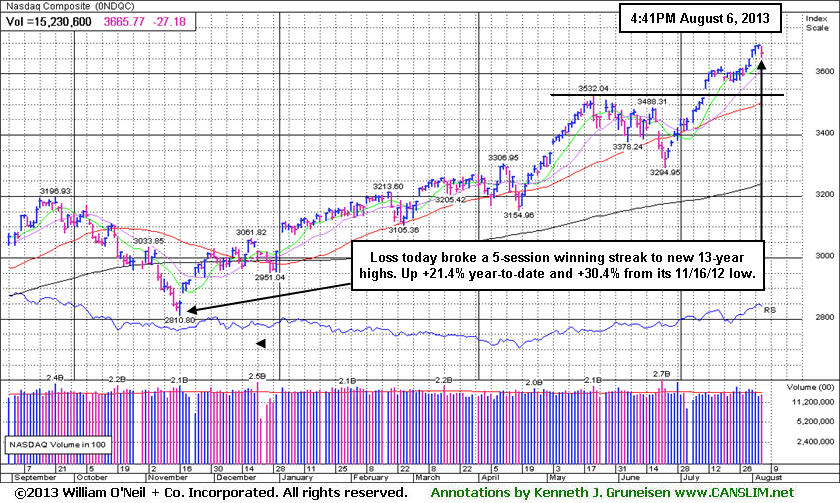
The major averages finished lower on the session, albeit off of their worst levels on Tuesday. The volume totals were reported higher than the prior session totals on the Nasdaq exchange and on the NYSE, a sign of distributional selling pressure from the institutional crowd. Breadth was negative as decliners led advancers by 7-3 on the Nasdaq exchange and by nearly a 3-1 margin on the NYSE. There were 72 high-ranked companies from the CANSLIM.net Leaders List made new 52-week highs and appeared on the CANSLIM.net BreakOuts Page, up a notch from the prior session total of 71 stocks. The list of stocks hitting new 52-week highs contracted yet still outnumbered new 52-week lows on the Nasdaq exchange, however new lows outnumbered new highs on the NYSE. There were gains for only 3 of the 17 high-ranked companies currently included on the Featured Stocks Page.
Stocks traded in the red from the opening bell as investors responded to a batch of mixed corporate earnings reports. An unexpected narrowing in the U.S. international trade gap had little positive effect. All 10 sectors on the S&P finished lower, led by declines in telecom stocks. Shares of AT&T Inc (T -0.53%) . Retailing stocks were active in the session. Michael Kors Holdings Ltd (KORS +3.7%) after posting earnings and revenues ahead of analysts’ expectations. Also in the space, American Eagle Outfitters Inc (AEO -12.70%) fell as the company cut their current-quarter earnings forecast. In other news, shares of International Business Machines Corp (IBM -2.31%) after the stock received an analyst downgrade.
Turning to fixed income markets, Treasuries ended little changed along the curve. The benchmark 10-year note was relatively unchanged, yielding 2.64% and the 30-year bond was up 1/8 of a point to yield 3.73%.
The market (M criteria) has flashed substantial strength and leadership. Now in a confirmed rally, odds are considered favorable for investors' success with new buying efforts. Investors should be disciplined and selective while looking to be proactive and focused exclusively on the individual leaders best matching the winning models of the fact-based investment system. Study the companies on the CANSLIM.net Featured Stocks Page - a page showing the most action-worthy candidates' latest notes and links to additional resources including detailed analysis with data-packed graphs which are annotated by a Certified expert. The Premium Member Homepage - includes "dynamic archives" to all prior pay reports published. Watch for an announcement via email concerning the next WEBCAST.
PICTURED: The Nasdaq Composite Index is up +19.14% year-to-date and holding its ground at all-time highs despite mild distributional pressure in recent weeks. The Index has rallied +25.19% from its November 16, 2012 low.
|
 Kenneth J. Gruneisen started out as a licensed stockbroker in August 1987, a couple of months prior to the historic stock market crash that took the Dow Jones Industrial Average down -22.6% in a single day. He has published daily fact-based fundamental and technical analysis on high-ranked stocks online for two decades. Through FACTBASEDINVESTING.COM, Kenneth provides educational articles, news, market commentary, and other information regarding proven investment systems that work in good times and bad.
Comments contained in the body of this report are technical opinions only and are not necessarily those of Gruneisen Growth Corp. The material herein has been obtained from sources believed to be reliable and accurate, however, its accuracy and completeness cannot be guaranteed. Our firm, employees, and customers may effect transactions, including transactions contrary to any recommendation herein, or have positions in the securities mentioned herein or options with respect thereto. Any recommendation contained in this report may not be suitable for all investors and it is not to be deemed an offer or solicitation on our part with respect to the purchase or sale of any securities. |
|
 |
Widespread Losses Hit All Groups
Kenneth J. Gruneisen - Passed the CAN SLIM® Master's Exam
The Gold & Silver Index ($XAU -5.23%) was a standout decliner amid broad-based losses on Tuesday. Financial shares had a negative influence on the major average as the Bank Index ($BKX -1.03%) and Broker/Dealer Index ($XBD -0.96%) both fell. The Biotechnology Index ($BTK -2.23%) led the tech sector lower while the Networking Index ($NWX -0.82%), Semiconductor Index ($SOX -0.72%), and Internet Index ($IIX -0.44%) each suffered smaller losses. Losses in energy-related shares pushed the Oil Services Index ($OSX -1.27%) and the Integrated Oil Index ($XOI -0.50%) lower. Modest losses for the Retail Index ($RLX -0.44%) and the Healthcare Index ($HMO -0.26%) rounded out the clearly negative session.
Charts courtesy www.stockcharts.com
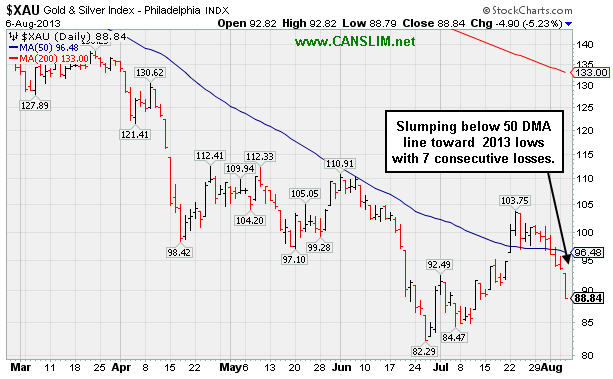
PICTURED: The Gold & Silver Index ($XAU -5.23%) is slumping below its 50-day moving average (DMA) line toward 2013 lows with 7 consecutive losses.
| Oil Services |
$OSX |
262.97 |
-3.37 |
-1.27% |
+19.44% |
| Healthcare |
$HMO |
3,394.38 |
-8.74 |
-0.26% |
+35.01% |
| Integrated Oil |
$XOI |
1,379.83 |
-6.87 |
-0.50% |
+11.11% |
| Semiconductor |
$SOX |
478.68 |
-3.46 |
-0.72% |
+24.64% |
| Networking |
$NWX |
291.21 |
-2.39 |
-0.82% |
+28.54% |
| Internet |
$IIX |
407.95 |
-1.79 |
-0.44% |
+24.75% |
| Broker/Dealer |
$XBD |
134.60 |
-1.31 |
-0.96% |
+42.69% |
| Retail |
$RLX |
847.38 |
-3.72 |
-0.44% |
+29.76% |
| Gold & Silver |
$XAU |
88.84 |
-4.90 |
-5.23% |
-46.35% |
| Bank |
$BKX |
66.02 |
-0.69 |
-1.03% |
+28.74% |
| Biotech |
$BTK |
2,130.44 |
-48.56 |
-2.23% |
+37.71% |
|
|
|
 |
Four Times Average Volume Behind Rally to New Highs
Kenneth J. Gruneisen - Passed the CAN SLIM® Master's Exam
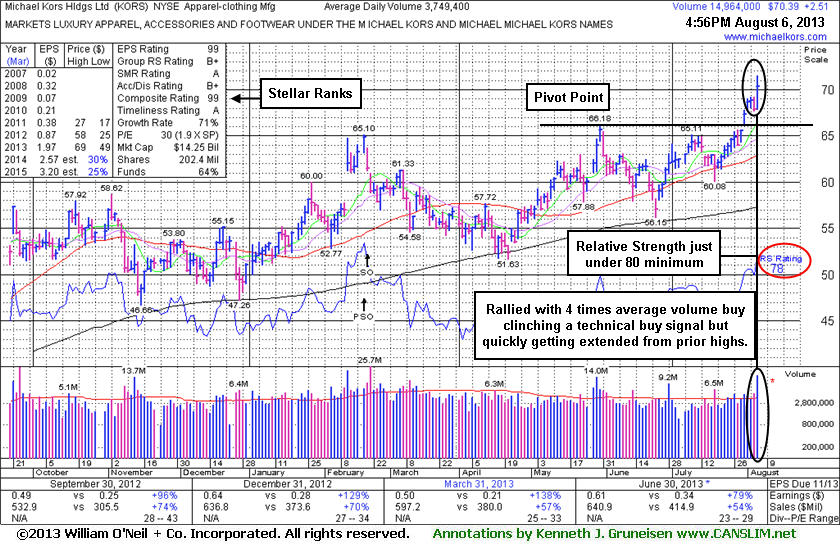
Michael Kors Hldgs Ltd (KORS +$2.51 or +3.70% to $70.39) hit new 52-week and all-time highs with today's considerable gain backed by 4 times average volume clinching a technical buy signal while quickly rallying to a finish above its "max buy" level. It was highlighted in yellow with pivot point based on its 5/30/13 high plus 10 cents in the earlier mid-day report (read here). Recent gains lacked great volume conviction, however the heavy volume today was a clear sign of institutional buying demand.
Any stock that is sold can always be bought back later if strength returns, however disciplined investors avoid chasing stocks more than +5% above prior highs since this increases the risk an ordinary pullback may trigger the strict sell rule if it subsequently drops more than -7% below their purchase price. KORS found support near its 200-day moving average (DMA) line during its consolidation since dropped from the Featured Stocks list on 4/02/13. It showed bullish action in recent months but encountered stubborn resistance in the $65-66 area. Its Relative Strength rating is currently 78, slightly below the 80+ minimum guideline for buy candidates. Fundamentally, it has maintained high ranks due to its strong earnings history (meeting C and A criteria) including earnings +79% on +54% sales for the Jun '13 quarter just reported.
This high-ranked Apparel - Clothing Manufacturing firm has headquarters in Hong Kong. It has traded up considerably from its 12/15/11 IPO priced at $20. It was last shown in this FSU section on 3/08/13 with an annotated graph under the headline, "Following Another Secondary Offering Relative Strength Rank Has Slumped". It completed Secondary Offerings on 9/25/12 and 2/20/13, each time while perched near its all-time highs. Prior reports noted - "Such offerings often are a short-term hindrance to upward price progress yet typically result in broader institutional ownership interest." The number of top-rated funds owning its shares rose from 326 in Mar '12 to 653 in Jun '13, a reassuring sign concerning the I criteria. Its current Up/Down Volume Ratio of 1.7 is an unbiased indication that its shares have been under slight accumulation over the past 50 days.
|
|
|
Color Codes Explained :
Y - Better candidates highlighted by our
staff of experts.
G - Previously featured
in past reports as yellow but may no longer be buyable under the
guidelines.
***Last / Change / Volume data in this table is the closing quote data***
Symbol/Exchange
Company Name
Industry Group |
PRICE |
CHANGE
(%Change) |
Day High |
Volume
(% DAV)
(% 50 day avg vol) |
52 Wk Hi
% From Hi |
Featured
Date |
Price
Featured |
Pivot Featured |
|
Max Buy |
AMBA
-
NASDAQ
Ambarella Inc
ELECTRONICS - Semiconductor - Specialized
|
$16.05
|
-0.78
-4.63% |
$16.87
|
864,495
73.19% of 50 DAV
50 DAV is 1,181,200
|
$19.44
-17.44%
|
7/15/2013
|
$17.87
|
PP = $18.68
|
|
MB = $19.61
|
 Most Recent Note - 8/6/2013 4:33:09 PM
G - Slumped further below its 50 DMA line which acted as resistance following the technical violation which triggered a sell signal last week. A rebound above that important short-term average would help its outlook improve.
>>> The latest Featured Stock Update with an annotated graph appeared on 7/17/2013. Click here.
View all notes |
Alert me of new notes |
CANSLIM.net Company Profile |
SEC |
Zacks Reports |
StockTalk |
News |
Chart |
Request a new note
C
A N
S L
I M


|
CELG
-
NASDAQ
Celgene Corp
DRUGS - Drug Manufacturers - Major
|
$141.74
|
-5.09
-3.47% |
$146.47
|
3,187,954
110.97% of 50 DAV
50 DAV is 2,872,700
|
$149.92
-5.45%
|
7/11/2013
|
$133.25
|
PP = $131.92
|
|
MB = $138.52
|
Most Recent Note - 8/6/2013 4:14:26 PM
G - Retreated from its 52-week and all-time highs with near average but higher volume today. Extended from its prior base and support at old highs in the $131 area.
>>> The latest Featured Stock Update with an annotated graph appeared on 7/29/2013. Click here.
View all notes |
Alert me of new notes |
CANSLIM.net Company Profile |
SEC |
Zacks Reports |
StockTalk |
News |
Chart |
Request a new note
C
A N
S L
I M
|
FLT
-
NYSE
Fleetcor Technologies
DIVERSIFIED SERVICES - Business/Management Services
|
$98.19
|
-0.59
-0.60% |
$99.27
|
364,003
49.93% of 50 DAV
50 DAV is 729,000
|
$100.87
-2.66%
|
5/29/2013
|
$86.02
|
PP = $85.66
|
|
MB = $89.94
|
Most Recent Note - 8/2/2013 12:47:14 PM
G- Reported earnings +37% on +29% sales revenues for the Jun '13 quarter. Finally making meaningful progress after forming a new late-stage base, it finished strong on the prior session and gapped up today hitting new 52-week and all-time highs with a 3rd consecutive gain backed by above average volume. Found support near its 50 DMA during its latest consolidation.
>>> The latest Featured Stock Update with an annotated graph appeared on 7/18/2013. Click here.
View all notes |
Alert me of new notes |
CANSLIM.net Company Profile |
SEC |
Zacks Reports |
StockTalk |
News |
Chart |
Request a new note
C
A N
S L
I M
|
GNRC
-
NYSE
Generac Hldgs Inc
CONSUMER DURABLES - Electronic Equipment
|
$42.21
|
-0.26
-0.61% |
$42.41
|
927,602
77.55% of 50 DAV
50 DAV is 1,196,100
|
$44.30
-4.72%
|
7/30/2013
|
$42.60
|
PP = $42.10
|
|
MB = $44.21
|
Most Recent Note - 8/2/2013 12:49:56 PM
Y - Gapped down today after pricing a Secondary Offering. It recently rallied from an advanced "3-weeks tight" base. Disciplined investors always limit losses by selling if any stock falls more than -7% from its purchase price.
>>> The latest Featured Stock Update with an annotated graph appeared on 7/30/2013. Click here.
View all notes |
Alert me of new notes |
CANSLIM.net Company Profile |
SEC |
Zacks Reports |
StockTalk |
News |
Chart |
Request a new note
C
A N
S L
I M
|
KORS
-
NYSE
Michael Kors Hldgs Ltd
RETAIL - Apparel Stores
|
$70.39
|
+2.51
3.70% |
$71.50
|
14,966,440
403.30% of 50 DAV
50 DAV is 3,711,000
|
$69.23
1.68%
|
8/6/2013
|
$69.66
|
PP = $66.28
|
|
MB = $69.59
|
Most Recent Note - 8/6/2013 6:24:08 PM
Y - Hit new 52-week and all-time highs with today's considerable gain backed by 4 times average volume clinching a technical buy signal while quickly rallying to a finish above its "max buy" level. It was highlighted in yellow with pivot point based on its 5/30/13 high plus 10 cents in the earlier mid-day report (read here). Relative Strength rating is currently 78, slightly below the 80+ minimum guideline for buy candidates. It has maintained high ranks due to its strong earnings history (meeting C and A criteria) including earnings +79% on +54% sales for the Jun '13 quarter just reported. See the latest FSU analysis for more details and a new annotated graph.
>>> The latest Featured Stock Update with an annotated graph appeared on 8/6/2013. Click here.
View all notes |
Alert me of new notes |
CANSLIM.net Company Profile |
SEC |
Zacks Reports |
StockTalk |
News |
Chart |
Request a new note
C
A N
S L
I M
|
Symbol/Exchange
Company Name
Industry Group |
PRICE |
CHANGE
(%Change) |
Day High |
Volume
(% DAV)
(% 50 day avg vol) |
52 Wk Hi
% From Hi |
Featured
Date |
Price
Featured |
Pivot Featured |
|
Max Buy |
LOPE
-
NASDAQ
Grand Canyon Education
DIVERSIFIED SERVICES - Education and; Training Services
|
$35.78
|
-0.25
-0.69% |
$36.25
|
528,567
120.90% of 50 DAV
50 DAV is 437,200
|
$37.17
-3.74%
|
6/19/2013
|
$31.47
|
PP = $34.17
|
|
MB = $35.88
|
Most Recent Note - 7/30/2013 6:37:23 PM
Y - Reported its second quarter results following today's market close after enduring mild distributional pressure near its 52-week high. Finished still perched above its pivot point and below its "max buy" level. Prior highs in the $34 area define support along with its 50 DMA line.
>>> The latest Featured Stock Update with an annotated graph appeared on 7/19/2013. Click here.
View all notes |
Alert me of new notes |
CANSLIM.net Company Profile |
SEC |
Zacks Reports |
StockTalk |
News |
Chart |
Request a new note
C
A N
S L
I M
|
PCLN
-
NASDAQ
Priceline.Com Inc
INTERNET - Internet Software and Services
|
$935.38
|
+6.80
0.73% |
$940.00
|
930,222
143.11% of 50 DAV
50 DAV is 650,000
|
$930.74
0.50%
|
7/8/2013
|
$878.28
|
PP = $847.43
|
|
MB = $889.80
|
Most Recent Note - 8/6/2013 4:16:40 PM
G - Hit a new 52-week high with above average volume behind today's 4th consecutive gain while getting more extended from its prior base. Due to report earnings August 8th. Prior highs in the $847 area define support to watch on pullbacks.
>>> The latest Featured Stock Update with an annotated graph appeared on 7/25/2013. Click here.
View all notes |
Alert me of new notes |
CANSLIM.net Company Profile |
SEC |
Zacks Reports |
StockTalk |
News |
Chart |
Request a new note
C
A N
S L
I M
|
PRAA
-
NASDAQ
Portfolio Recovery Assoc
DIVERSIFIED SERVICES - Business/Management Services
|
$51.75
|
-0.67
-1.28% |
$52.81
|
311,354
78.90% of 50 DAV
50 DAV is 394,600
|
$54.62
-5.26%
|
7/31/2013
|
$51.43
|
PP = $54.72
|
|
MB = $57.46
|
Most Recent Note - 8/2/2013 8:52:21 AM
Y - Do not be confused by 3:1 share split impacting prices today (pivot point, max buy price have been adjusted accordingly). It rallied above its 50 DMA line with a 3rd consecutive volume-driven gain but has not triggered a proper technical buy signal since returning to the Featured Stocks list highlighted in yellow with new pivot point cited based on its 6/17/13 high plus 10 cents in Wednesday's mid-day report (read here) with caution - "It faces some resistance and needs additional volume-driven gains to trigger a proper new technical buy signal. Reported earnings +37% on +24% sales revenues for the Jun '13 quarter. Showing resilience since dropped from the Featured Stocks list on 7/10/13 due to technical weakness."
>>> The latest Featured Stock Update with an annotated graph appeared on 8/2/2013. Click here.
View all notes |
Alert me of new notes |
CANSLIM.net Company Profile |
SEC |
Zacks Reports |
StockTalk |
News |
Chart |
Request a new note
C
A N
S L
I M
|
PRLB
-
NYSE
Proto Labs Inc
MANUFACTURING - Small Tools and Accessories
|
$66.03
|
-4.47
-6.34% |
$68.00
|
1,311,234
295.99% of 50 DAV
50 DAV is 443,000
|
$72.08
-8.39%
|
7/29/2013
|
$64.86
|
PP = $67.50
|
|
MB = $70.88
|
Most Recent Note - 8/6/2013 12:54:24 PM
Y - Down considerably today with higher above average volume, undercutting its pivot point again. Enduring its 2nd bout of heavy distributional pressure within 4 sessions while making limited progress above prior highs. See the latest FSU analysis for more details and a new annotated graph.
>>> The latest Featured Stock Update with an annotated graph appeared on 8/5/2013. Click here.
View all notes |
Alert me of new notes |
CANSLIM.net Company Profile |
SEC |
Zacks Reports |
StockTalk |
News |
Chart |
Request a new note
C
A N
S L
I M
|
QCOR
-
NASDAQ
Questcor Pharmaceuticals
DRUGS - Biotechnology
|
$66.07
|
-0.72
-1.08% |
$67.53
|
1,142,325
53.61% of 50 DAV
50 DAV is 2,130,700
|
$70.55
-6.35%
|
7/31/2013
|
$66.46
|
PP = $59.01
|
|
MB = $61.96
|
Most Recent Note - 8/2/2013 1:16:39 PM
G - Retreating from another new high today after an impressive streak of volume-driven gains. Quickly got extended beyond its "max buy" level after highlighted in yellow in the 7/31/13 mid-day report (read here) with a weekly graph which illustrated its powerful long-term breakout to new highs. See the latest FSU analysis for more details and an annotated daily graph.
>>> The latest Featured Stock Update with an annotated graph appeared on 8/1/2013. Click here.
View all notes |
Alert me of new notes |
CANSLIM.net Company Profile |
SEC |
Zacks Reports |
StockTalk |
News |
Chart |
Request a new note
C
A N
S L
I M
|
Symbol/Exchange
Company Name
Industry Group |
PRICE |
CHANGE
(%Change) |
Day High |
Volume
(% DAV)
(% 50 day avg vol) |
52 Wk Hi
% From Hi |
Featured
Date |
Price
Featured |
Pivot Featured |
|
Max Buy |
RRTS
-
NYSE
Roadrunner Trans Systems
TRANSPORTATION - Air Delivery and Freight Service
|
$30.26
|
-0.58
-1.88% |
$30.85
|
73,521
52.48% of 50 DAV
50 DAV is 140,100
|
$30.98
-2.34%
|
4/3/2013
|
$22.77
|
PP = $23.75
|
|
MB = $24.94
|
Most Recent Note - 8/6/2013 4:19:53 PM
G - Hovering near its 52-week high, technically extended from any sound base. Fundamentally, it reported earnings +19% on +26% in the Jun '13 quarter, raising more concerns with its 2nd consecutive quarterly comparison with earnings increasing below the +25% minimum guideline (C criteria).
>>> The latest Featured Stock Update with an annotated graph appeared on 7/22/2013. Click here.
View all notes |
Alert me of new notes |
CANSLIM.net Company Profile |
SEC |
Zacks Reports |
StockTalk |
News |
Chart |
Request a new note
C
A N
S L
I M
|
SFUN
-
NYSE
Soufun Hldgs Ltd Ads A
INTERNET - Internet Information Providers
|
$34.85
|
-0.20
-0.57% |
$35.15
|
459,908
132.46% of 50 DAV
50 DAV is 347,200
|
$36.43
-4.34%
|
7/16/2013
|
$29.54
|
PP = $27.90
|
|
MB = $29.30
|
Most Recent Note - 8/1/2013 12:55:58 PM
G - Extended from its latest base following volume-driven gains. Prior highs in the $28-29 area define initial support to watch.
>>> The latest Featured Stock Update with an annotated graph appeared on 7/16/2013. Click here.
View all notes |
Alert me of new notes |
CANSLIM.net Company Profile |
SEC |
Zacks Reports |
StockTalk |
News |
Chart |
Request a new note
C
A N
S L
I M
|
SSNC
-
NASDAQ
S S & C Technologies
COMPUTER SOFTWARE and SERVICES - Application Software
|
$35.64
|
-0.96
-2.62% |
$36.68
|
640,948
166.70% of 50 DAV
50 DAV is 384,500
|
$38.80
-8.14%
|
7/11/2013
|
$35.80
|
PP = $34.54
|
|
MB = $36.27
|
Most Recent Note - 8/6/2013 4:35:01 PM
Y - Color code is changed to yellow after slumping below its "max buy" level with today's loss on above average volume. During its recent consolidation it stayed well above prior highs in the $34 area now coinciding with its 50 DMA line and defining important near-term support. Reported earnings +45% on +47% sales revenues for the Jun '13 quarter.
>>> The latest Featured Stock Update with an annotated graph appeared on 7/12/2013. Click here.
View all notes |
Alert me of new notes |
CANSLIM.net Company Profile |
SEC |
Zacks Reports |
StockTalk |
News |
Chart |
Request a new note
C
A N
S L
I M
|
SSYS
-
NASDAQ
Stratasys Ltd
COMPUTER HARDWARE - Computer Peripherals
|
$87.02
|
-3.57
-3.94% |
$91.13
|
619,023
84.28% of 50 DAV
50 DAV is 734,500
|
$96.44
-9.77%
|
7/8/2013
|
$91.44
|
PP = $95.00
|
|
MB = $99.75
|
Most Recent Note - 8/6/2013 4:22:04 PM
Y - Fell on higher but below average volume today, slumping near its 50 DMA line and a prior low ($85.95 on 7/24/13) defining important near-term support to watch. More damaging losses could raise greater concerns and trigger worrisome technical sell signals.
>>> The latest Featured Stock Update with an annotated graph appeared on 7/24/2013. Click here.
View all notes |
Alert me of new notes |
CANSLIM.net Company Profile |
SEC |
Zacks Reports |
StockTalk |
News |
Chart |
Request a new note
C
A N
S L
I M
|
STMP
-
NASDAQ
Stamps.Com Inc
INTERNET - Internet Software and Services
|
$40.30
|
-1.25
-3.01% |
$41.37
|
280,937
203.73% of 50 DAV
50 DAV is 137,900
|
$46.47
-13.28%
|
7/31/2013
|
$40.00
|
PP = $42.98
|
|
MB = $45.13
|
Most Recent Note - 8/6/2013 4:24:51 PM
Y - Encountered more distributional pressure with today's 3rd consecutive loss on higher above average volume while slumping toward its 50 DMA line. Disciplined investors limit losses if any stock falls more than -7% from their purchase price.
>>> The latest Featured Stock Update with an annotated graph appeared on 7/31/2013. Click here.
View all notes |
Alert me of new notes |
CANSLIM.net Company Profile |
SEC |
Zacks Reports |
StockTalk |
News |
Chart |
Request a new note
C
A N
S L
I M
|
Symbol/Exchange
Company Name
Industry Group |
PRICE |
CHANGE
(%Change) |
Day High |
Volume
(% DAV)
(% 50 day avg vol) |
52 Wk Hi
% From Hi |
Featured
Date |
Price
Featured |
Pivot Featured |
|
Max Buy |
VRX
-
NYSE
Valeant Pharmaceuticals
DRUGS - Drug Manufacturers - Other
|
$95.72
|
+0.15
0.16% |
$96.20
|
1,168,902
57.64% of 50 DAV
50 DAV is 2,028,000
|
$97.02
-1.34%
|
4/30/2013
|
$60.24
|
PP = $76.66
|
|
MB = $80.49
|
Most Recent Note - 8/6/2013 4:30:21 PM
Y- Hovering near its 52-week high after wedging higher with recent gains lacking great volume conviction while rising from a 9-week cup-with-handle base. Due to report Q2 results before the open on August 7, 2013, and volume and volatility often increase near earnings news. No new pivot point has been cited while members were repeatedly cautioned - "Concerns were raised by its Mar '13 earnings report with only a +14% earnings increase, below the +25% minimum guideline (C criteria) for buy candidates."
>>> The latest Featured Stock Update with an annotated graph appeared on 7/23/2013. Click here.
View all notes |
Alert me of new notes |
CANSLIM.net Company Profile |
SEC |
Zacks Reports |
StockTalk |
News |
Chart |
Request a new note
C
A N
S L
I M
|
YNDX
-
NASDAQ
Yandex N V Class A
INTERNET - Internet Information Providers
|
$33.35
|
-0.15
-0.45% |
$33.57
|
1,492,651
59.40% of 50 DAV
50 DAV is 2,512,700
|
$34.27
-2.68%
|
7/10/2013
|
$29.29
|
PP = $29.59
|
|
MB = $31.07
|
Most Recent Note - 8/6/2013 4:31:29 PM
G - Holding its ground stubbornly near its 52-week high with small losses on light volume following volume-driven gains into new high territory. Prior highs in the $28-29 area define near-term support to watch.
>>> The latest Featured Stock Update with an annotated graph appeared on 7/26/2013. Click here.
View all notes |
Alert me of new notes |
CANSLIM.net Company Profile |
SEC |
Zacks Reports |
StockTalk |
News |
Chart |
Request a new note
C
A N
S L
I M
|
|
|
|
THESE ARE NOT BUY RECOMMENDATIONS!
Comments contained in the body of this report are technical
opinions only. The material herein has been obtained
from sources believed to be reliable and accurate, however,
its accuracy and completeness cannot be guaranteed.
This site is not an investment advisor, hence it does
not endorse or recommend any securities or other investments.
Any recommendation contained in this report may not
be suitable for all investors and it is not to be deemed
an offer or solicitation on our part with respect to
the purchase or sale of any securities. All trademarks,
service marks and trade names appearing in this report
are the property of their respective owners, and are
likewise used for identification purposes only.
This report is a service available
only to active Paid Premium Members.
You may opt-out of receiving report notifications
at any time. Questions or comments may be submitted
by writing to Premium Membership Services 665 S.E. 10 Street, Suite 201 Deerfield Beach, FL 33441-5634 or by calling 1-800-965-8307
or 954-785-1121.
|
|
|

