You are not logged in.
This means you
CAN ONLY VIEW reports that were published prior to Monday, April 14, 2025.
You
MUST UPGRADE YOUR MEMBERSHIP if you want to see any current reports.
AFTER MARKET UPDATE - MONDAY, AUGUST 6TH, 2012
Previous After Market Report Next After Market Report >>>
|
|
|
|
DOW |
+21.34 |
13,117.51 |
+0.16% |
|
Volume |
647,202,920 |
-14% |
|
Volume |
1,494,269,710 |
-11% |
|
NASDAQ |
+22.01 |
2,989.91 |
+0.74% |
|
Advancers |
1,892 |
60% |
|
Advancers |
1,522 |
59% |
|
S&P 500 |
+3.24 |
1,394.23 |
+0.23% |
|
Decliners |
1,124 |
36% |
|
Decliners |
927 |
36% |
|
Russell 2000 |
+5.87 |
794.35 |
+0.74% |
|
52 Wk Highs |
209 |
|
|
52 Wk Highs |
77 |
|
|
S&P 600 |
+2.99 |
447.22 |
+0.67% |
|
52 Wk Lows |
11 |
|
|
52 Wk Lows |
34 |
|
|
 |
Major Averages Ended Off Session Highs With Gains on Lighter Volume
Kenneth J. Gruneisen - Passed the CAN SLIM® Master's Exam
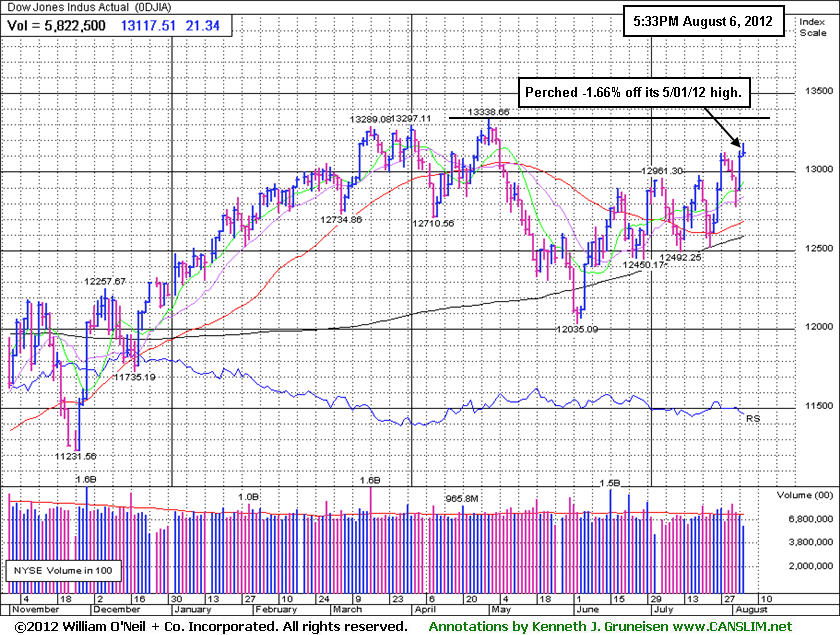
The major averages finished higher on Monday's session, albeit off their best levels. The volume totals behind the gains were again reported lighter on the NYSE and on the Nasdaq exchange versus the prior session totals, which reveals a lack of great institutional buying demand behind the market's rise. Advancing issues led decliners by about 3-2 on the NYSE and on the Nasdaq exchange. The total number of new 52-week highs led new 52-week lows on the NYSE on the Nasdaq exchange. There were 51 high-ranked companies from the CANSLIM.net Leaders List made new 52-week highs and appeared on the CANSLIM.net BreakOuts Page, down from the prior session total of 55 stocks. There were gains for 11 of the 16 high-ranked companies currently included on the Featured Stocks Page.
Stocks rallied in the opening hours of trading on positive U.S. profit tallies and hopes that the European Central Bank was close to lowering the region's borrowing costs.
Nine of the 10 sectors on the S&P finished in the green, led by a rally in material stocks as shares of Alcoa Inc (AA +1.55%) and E. I. du Pont de Nemours and Company (DD +1.39%) rose. Looking at earnings, Shares of Cognizant Technologies Solutions Corp (CTSH +13.32%) finished higher after the company posted a better-than-expected quarterly report and boosted their full year earnings forecast. In other news, Best Buy Co Inc (BBY +10.97%) jumped after its founder and former chairman offered to acquire the remaining shares of the company for $24 to $26 per share.
Turning to fixed income, Treasuries were little changed along the curve. The benchmark 10-year note was up 3/32 to yield 1.56% and the 30-year bond lower by 1/32 to yield 2.65%.
In terms of the M criteria, last week's gains brought technical improvements to the major indices' trend coupled with an expansion in leadership (stocks hitting new 52-week highs). Any sustainable rally requires a healthy crop of strong leaders hitting new 52-week highs.
Watch for an announcement soon via email concerning new monthly webcasts starting in August and a new "Market's Leading Groups" archives tab to be added on the Premium Member Homepage. These changes are aimed at satisfying member requests and improving the service. If you have questions, comments or suggestions please let us know via the inquiry form here. The most recent WEBCAST (Q2 2012) is available "ON DEMAND" - CLICK HERE.
PICTURED: The Dow Jones Industrial Average finished -1.66% off its May 1, 2012 high, which leaves it -7.6% off its October 2007 all-time high.
|
 Kenneth J. Gruneisen started out as a licensed stockbroker in August 1987, a couple of months prior to the historic stock market crash that took the Dow Jones Industrial Average down -22.6% in a single day. He has published daily fact-based fundamental and technical analysis on high-ranked stocks online for two decades. Through FACTBASEDINVESTING.COM, Kenneth provides educational articles, news, market commentary, and other information regarding proven investment systems that work in good times and bad.
Comments contained in the body of this report are technical opinions only and are not necessarily those of Gruneisen Growth Corp. The material herein has been obtained from sources believed to be reliable and accurate, however, its accuracy and completeness cannot be guaranteed. Our firm, employees, and customers may effect transactions, including transactions contrary to any recommendation herein, or have positions in the securities mentioned herein or options with respect thereto. Any recommendation contained in this report may not be suitable for all investors and it is not to be deemed an offer or solicitation on our part with respect to the purchase or sale of any securities. |
|
 |
Networking Index and Gold & Silver Index Led Gaining Groups
Kenneth J. Gruneisen - Passed the CAN SLIM® Master's Exam
The Gold & Silver Index ($XAU +2.51%) was a big gainer on Monday, meanwhile energy-related groups including the Integrated Oil Index ($XOI +0.20%) and the Oil Services Index ($OSX +0.51%) posted smaller gains. There was a slight positive bias shown by the Bank Index ($BKX +0.13%) and the Broker/Dealer Index ($XBD +0.17%) as well as the Retail Index ($RLX +0.04%). The Internet Index ($IIX +1.35%), Biotechnology Index ($BTK +0.72%), and Semiconductor Index ($SOX +0.51%) posted modest gains. Meanwhile, the Healthcare Index ($HMO -0.15%) edged lower.
Charts courtesy www.stockcharts.com
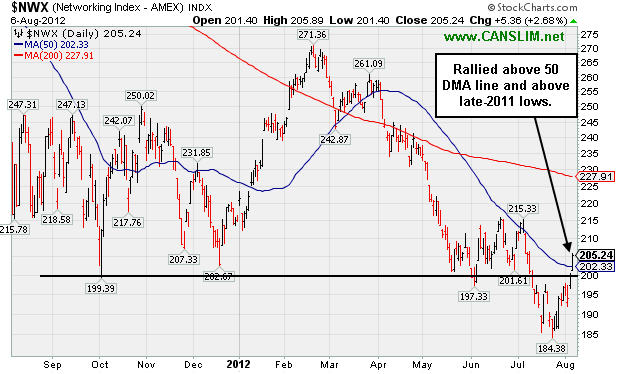
PICTURED: The Networking Index ($NWX +2.68%) rallied above its 50-day moving average (DMA) line and above its late-2011 lows.
| Oil Services |
$OSX |
222.87 |
+1.12 |
+0.51% |
+3.05% |
| Healthcare |
$HMO |
2,204.55 |
-3.32 |
-0.15% |
-3.38% |
| Integrated Oil |
$XOI |
1,215.41 |
+2.44 |
+0.20% |
-1.11% |
| Semiconductor |
$SOX |
392.08 |
+1.98 |
+0.51% |
+7.58% |
| Networking |
$NWX |
205.24 |
+5.36 |
+2.68% |
-4.61% |
| Internet |
$IIX |
309.34 |
+4.13 |
+1.35% |
+9.80% |
| Broker/Dealer |
$XBD |
78.58 |
+0.13 |
+0.17% |
-5.64% |
| Retail |
$RLX |
626.27 |
+0.26 |
+0.04% |
+19.70% |
| Gold & Silver |
$XAU |
154.10 |
+3.77 |
+2.51% |
-14.69% |
| Bank |
$BKX |
46.12 |
+0.06 |
+0.13% |
+17.12% |
| Biotech |
$BTK |
1,439.52 |
+10.31 |
+0.72% |
+31.89% |
|
|
|
 |
Perched Near 52-Week High With Some Remaining Overhead Supply
Kenneth J. Gruneisen - Passed the CAN SLIM® Master's Exam
Often, when a leading stock is setting up to breakout of a solid base it is highlighted in CANSLIM.net's Mid-Day Breakouts Report. The most relevant factors are noted in the report which alerts prudent CANSLIM oriented investors to place the issue in their watch list. After doing any necessary backup research, the investor is prepared to act after the stock triggers a technical buy signal (breaks above its pivot point on more than +50% average turnover) but before it gets too extended from a sound base. In the event the stock fails to trigger a technical buy signal and its price declines then it will simply be removed from the watch list. Disciplined investors know to buy as near as possible to the pivot point and avoid chasing stocks after they have rallied more than +5% above their pivot point. It is crucial to always limit losses whenever any stock heads the wrong direction, and disciplined investors sell if a struggling stock ever falls more than -7% from their purchase price.
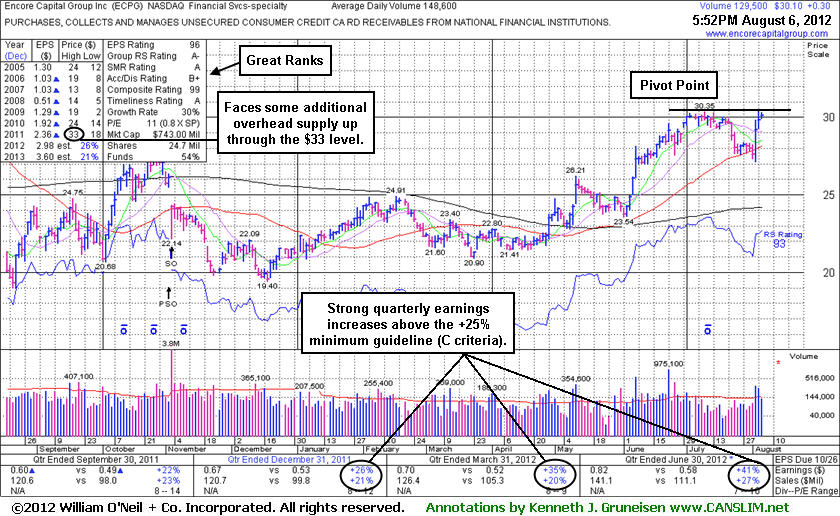
Encore Capital Group Inc (ECPG +$0.30 or +1.01% to $30.10) was featured in yellow in the 8/03/12 mid-day report (read here) with pivot point based on its 7/10/12 high while it appeared poised to rally from a short "square box" base. A subsequent volume-driven gain and close above its pivot point may trigger a technical buy signal. It found support near its 50-day moving average (DMA) line last week and gains backed by above average volume helped it touch a new 52-week high. It reported earnings +41% on +27% sales revenues for the quarter ended June 30, 2012. That marked 3 consecutive quarterly comparisons with earnings increases above the +25% minimum guideline. This Financial Services - Misc firm's annual earnings (A criteria) history has been improving since a down turn in FY '08. The number of top-rated funds owning its shares rose from 246 in Sep '11 to 258 in Jun '12, a somewhat reassuring sign concerning the I criteria. Its current Up/Down Volume Ratio of 1.8 is an unbiased indication that its shares have been under accumulation over the past 50 days. Keep in mind that it has a little bit of overhead supply up through its 2011 high near $33 that may act as near-term resistance. Subsequent gains into new all-time high could possibly signal the beginning of a much more substantial advance in price.
 |
|
|
Color Codes Explained :
Y - Better candidates highlighted by our
staff of experts.
G - Previously featured
in past reports as yellow but may no longer be buyable under the
guidelines.
***Last / Change / Volume data in this table is the closing quote data***
Symbol/Exchange
Company Name
Industry Group |
PRICE |
CHANGE
(%Change) |
Day High |
Volume
(% DAV)
(% 50 day avg vol) |
52 Wk Hi
% From Hi |
Featured
Date |
Price
Featured |
Pivot Featured |
|
Max Buy |
ALXN
-
NASDAQ
Alexion Pharmaceuticals
DRUGS - Drug Manufacturers - Other
|
$106.13
|
-0.83
-0.78% |
$107.76
|
1,484,886
66.25% of 50 DAV
50 DAV is 2,241,400
|
$109.96
-3.48%
|
5/1/2012
|
$91.73
|
PP = $95.11
|
|
MB = $99.87
|
Most Recent Note - 8/3/2012 11:57:15 AM
G - Gapped up today while consolidating well above chart support defined by its 50 DMA line (now $97.33). Reported earnings +62% on +48% sales revenues for the quarter ended June 30, 2012 versus the year ago period.
>>> The latest Featured Stock Update with an annotated graph appeared on 7/25/2012. Click here.
View all notes |
Alert me of new notes |
CANSLIM.net Company Profile |
SEC |
Zacks Reports |
StockTalk |
News |
Chart |
Request a new note
C
A N
S L
I M


|
ASPS
-
NASDAQ
Altisource Ptf Sltns Sa
REAL ESTATE - Property Management/Developmen
|
$81.86
|
+3.46
4.41% |
$82.83
|
235,628
173.77% of 50 DAV
50 DAV is 135,600
|
$79.40
3.10%
|
6/5/2012
|
$60.01
|
PP = $63.00
|
|
MB = $66.15
|
 Most Recent Note - 8/6/2012 11:51:30 AM
G - Gapped up today, on track for a 7th consecutive gain and hitting another new high, getting more extended from its prior base. Recent low and its 50 DMA line define near-term support to watch. See the latest FSU analysis for more details and an annotated graph.
>>> The latest Featured Stock Update with an annotated graph appeared on 8/3/2012. Click here.
View all notes |
Alert me of new notes |
CANSLIM.net Company Profile |
SEC |
Zacks Reports |
StockTalk |
News |
Chart |
Request a new note
C
A N
S L
I M
|
CFNL
-
NASDAQ
Cardinal Financial Corp
BANKING - Regional - Southeast Banks
|
$12.61
|
+0.11
0.88% |
$12.86
|
36,774
47.70% of 50 DAV
50 DAV is 77,100
|
$13.21
-4.54%
|
7/20/2012
|
$12.85
|
PP = $12.41
|
|
MB = $13.03
|
Most Recent Note - 8/3/2012 12:56:18 PM
Y - Rebounding back above its pivot point with today's gain on light volume. Its 50 DMA line and prior chart highs define important near-term support to watch.
>>> The latest Featured Stock Update with an annotated graph appeared on 7/26/2012. Click here.
View all notes |
Alert me of new notes |
CANSLIM.net Company Profile |
SEC |
Zacks Reports |
StockTalk |
News |
Chart |
Request a new note
C
A N
S L
I M
|
CMCSA
-
NASDAQ
Comcast Corp Cl A
MEDIA - CATV Systems
|
$34.94
|
+0.33
0.95% |
$35.06
|
12,440,075
87.42% of 50 DAV
50 DAV is 14,230,100
|
$35.09
-0.43%
|
6/11/2012
|
$29.94
|
PP = $30.98
|
|
MB = $32.53
|
Most Recent Note - 8/2/2012 12:50:06 PM
G - Hitting another new 52-week high today, getting more extended from its prior base. Gapped up on 8/01/12 after reporting earnings +19% on +6% sales revenues for the Jun '12 quarter, below the fact-based investment system's +25% minimum guideline for the C criteria, but better than Street expectations.
>>> The latest Featured Stock Update with an annotated graph appeared on 7/11/2012. Click here.
View all notes |
Alert me of new notes |
CANSLIM.net Company Profile |
SEC |
Zacks Reports |
StockTalk |
News |
Chart |
Request a new note
C
A N
S L
I M
|
DG
-
NYSE
Dollar General Corp
RETAIL - Discount, Variety Stores
|
$51.54
|
-0.36
-0.69% |
$52.46
|
1,207,976
30.02% of 50 DAV
50 DAV is 4,023,600
|
$56.04
-8.03%
|
7/16/2012
|
$54.68
|
PP = $56.14
|
|
MB = $58.95
|
Most Recent Note - 8/1/2012 11:49:03 AM
G - Consolidating below its 50 DMA line today after recent distributional pressure, and its color code is changed to green. It did not register volume-driven gains above its new pivot point to trigger a new (or add-on) technical buy signal.
>>> The latest Featured Stock Update with an annotated graph appeared on 7/12/2012. Click here.
View all notes |
Alert me of new notes |
CANSLIM.net Company Profile |
SEC |
Zacks Reports |
StockTalk |
News |
Chart |
Request a new note
C
A N
S L
I M
|
Symbol/Exchange
Company Name
Industry Group |
PRICE |
CHANGE
(%Change) |
Day High |
Volume
(% DAV)
(% 50 day avg vol) |
52 Wk Hi
% From Hi |
Featured
Date |
Price
Featured |
Pivot Featured |
|
Max Buy |
ECPG
-
NASDAQ
Encore Capital Group Inc
FINANCIAL SERVICES - Credit Services
|
$30.10
|
+0.30
1.01% |
$30.30
|
129,548
87.18% of 50 DAV
50 DAV is 148,600
|
$30.47
-1.21%
|
8/3/2012
|
$29.91
|
PP = $30.45
|
|
MB = $31.97
|
Most Recent Note - 8/6/2012 6:13:22 PM
Y - Perched near its pivot point based on its 7/10/12 high after a short "square box" base. A volume-driven gain and close above its pivot point may trigger a technical buy signal. See the latest FSU analysis for more details and a new annotated graph.
>>> The latest Featured Stock Update with an annotated graph appeared on 8/6/2012. Click here.
View all notes |
Alert me of new notes |
CANSLIM.net Company Profile |
SEC |
Zacks Reports |
StockTalk |
News |
Chart |
Request a new note
C
A N
S L
I M
|
EXPE
-
NASDAQ
Expedia Inc
INTERNET - Internet Information Providers
|
$58.42
|
+0.97
1.69% |
$58.61
|
2,459,330
63.41% of 50 DAV
50 DAV is 3,878,400
|
$58.80
-0.65%
|
4/27/2012
|
$41.80
|
PP = $35.57
|
|
MB = $37.35
|
Most Recent Note - 8/6/2012 5:32:46 PM
G - Posted a 3rd consecutive gain today on below average volume for a new high close. Reported earnings +24% on +14% sales revenues for the quarter ending June 30, 2012 versus the year ago period, just below the +25% minimum earnings guideline for buy candidates.
>>> The latest Featured Stock Update with an annotated graph appeared on 7/10/2012. Click here.
View all notes |
Alert me of new notes |
CANSLIM.net Company Profile |
SEC |
Zacks Reports |
StockTalk |
News |
Chart |
Request a new note
C
A N
S L
I M
|
GNC
-
NYSE
G N C Holdings Inc
RETAIL - Drug Stores
|
$38.49
|
-0.72
-1.84% |
$39.60
|
1,515,367
60.58% of 50 DAV
50 DAV is 2,501,400
|
$42.70
-9.86%
|
6/29/2012
|
$39.20
|
PP = $40.00
|
|
MB = $42.00
|
Most Recent Note - 8/6/2012 5:33:33 PM
Y - Quietly consolidating just above its 50 DMA line today. Reported earnings +59% on +19% sales revenues for the quarter ended June 30, 2012 versus the year ago period, beating expectations, and it also raised guidance for FY '12.
>>> The latest Featured Stock Update with an annotated graph appeared on 7/5/2012. Click here.
View all notes |
Alert me of new notes |
CANSLIM.net Company Profile |
SEC |
Zacks Reports |
StockTalk |
News |
Chart |
Request a new note
C
A N
S L
I M
|
GPX
-
NYSE
G P Strategies Corp
DIVERSIFIED SERVICES - Education and Training Services
|
$19.38
|
+0.19
0.99% |
$19.65
|
100,912
165.43% of 50 DAV
50 DAV is 61,000
|
$20.08
-3.49%
|
6/29/2012
|
$18.01
|
PP = $18.15
|
|
MB = $19.06
|
Most Recent Note - 8/6/2012 12:13:54 PM
G - On track today for a 3rd consecutive volume-driven gain. Hit new 52-week highs and color code was changed to green after rallying above its "max buy" level. Reported earnings +41% on +19% sales revenues for the Jun '12 quarter. Found support near its 50 DMA line when recently consolidating.
>>> The latest Featured Stock Update with an annotated graph appeared on 7/6/2012. Click here.
View all notes |
Alert me of new notes |
CANSLIM.net Company Profile |
SEC |
Zacks Reports |
StockTalk |
News |
Chart |
Request a new note
C
A N
S L
I M
|
HMSY
-
NASDAQ
H M S Holdings Corp
COMPUTER SOFTWARE and SERVICES - Healthcare Information Service
|
$34.74
|
+0.21
0.61% |
$35.00
|
601,715
63.65% of 50 DAV
50 DAV is 945,300
|
$35.98
-3.45%
|
7/27/2012
|
$33.91
|
PP = $34.83
|
|
MB = $36.57
|
Most Recent Note - 8/1/2012 12:02:49 PM
Y - Consolidating after spiking to a new 52-week high. Finished below its pivot point on 7/27/12 while posting a considerable gain with more than 2 times average volume. Subsequent volume-driven gains above its pivot may trigger a technical buy signal.
>>> The latest Featured Stock Update with an annotated graph appeared on 7/27/2012. Click here.
View all notes |
Alert me of new notes |
CANSLIM.net Company Profile |
SEC |
Zacks Reports |
StockTalk |
News |
Chart |
Request a new note
C
A N
S L
I M
|
Symbol/Exchange
Company Name
Industry Group |
PRICE |
CHANGE
(%Change) |
Day High |
Volume
(% DAV)
(% 50 day avg vol) |
52 Wk Hi
% From Hi |
Featured
Date |
Price
Featured |
Pivot Featured |
|
Max Buy |
N
-
NYSE
Netsuite Inc
DIVERSIFIED SERVICES - Business/Management Services
|
$57.90
|
+0.49
0.85% |
$58.27
|
539,588
71.61% of 50 DAV
50 DAV is 753,500
|
$58.56
-1.13%
|
6/20/2012
|
$51.83
|
PP = $51.88
|
|
MB = $54.47
|
Most Recent Note - 8/3/2012 12:51:44 PM
G - Color code is changed to green after rallying back above its "max buy" level. Found support near its 50 DMA line when encountering recent distributional pressure.
>>> The latest Featured Stock Update with an annotated graph appeared on 7/19/2012. Click here.
View all notes |
Alert me of new notes |
CANSLIM.net Company Profile |
SEC |
Zacks Reports |
StockTalk |
News |
Chart |
Request a new note
C
A N
S L
I M
|
NSM
-
NYSE
Nationstar Mtg Hldgs Inc
FINANCIAL SERVICES - Credit Services
|
$23.87
|
-0.28
-1.16% |
$24.43
|
469,364
56.62% of 50 DAV
50 DAV is 828,900
|
$25.11
-4.94%
|
6/27/2012
|
$20.29
|
PP = $20.46
|
|
MB = $21.48
|
Most Recent Note - 8/2/2012 3:57:33 PM
G - Considerable volume-driven gain today. It is not near a sound base, but consolidating above its "max buy" level after recently finding support above prior highs and its 50 DMA line in the $20 area. See the latest FSU analysis for more details and a new annotated graph.
>>> The latest Featured Stock Update with an annotated graph appeared on 8/1/2012. Click here.
View all notes |
Alert me of new notes |
CANSLIM.net Company Profile |
SEC |
Zacks Reports |
StockTalk |
News |
Chart |
Request a new note
C
A N
S L
I M
|
RNF
-
NYSE
Rentech Nitrogen Ptnr Lp
CHEMICALS - Agricultural Chemicals
|
$30.40
|
+0.30
1.00% |
$30.49
|
420,933
117.68% of 50 DAV
50 DAV is 357,700
|
$31.34
-3.00%
|
7/27/2012
|
$29.58
|
PP = $30.60
|
|
MB = $32.13
|
Most Recent Note - 8/3/2012 12:54:03 PM
Y - Churning above average volume this week near its 52-week high but it has encountered resistance near prior highs since highlighted yellow again in the 7/27/12 mid-day report.
>>> The latest Featured Stock Update with an annotated graph appeared on 7/31/2012. Click here.
View all notes |
Alert me of new notes |
CANSLIM.net Company Profile |
SEC |
Zacks Reports |
StockTalk |
News |
Chart |
Request a new note
C
A N
S L
I M
|
SWI
-
NYSE
Solarwinds Inc
COMPUTER SOFTWARE and SERVICES - Application Software
|
$55.88
|
+1.63
3.00% |
$56.24
|
963,393
75.66% of 50 DAV
50 DAV is 1,273,300
|
$54.67
2.21%
|
7/25/2012
|
$47.82
|
PP = $47.89
|
|
MB = $50.28
|
Most Recent Note - 8/6/2012 5:30:45 PM
G - Hit a new all-time high today with a 3rd consecutive gain on light volume. Prior highs in the $48 area define initial support to watch on pullbacks.
>>> The latest Featured Stock Update with an annotated graph appeared on 7/30/2012. Click here.
View all notes |
Alert me of new notes |
CANSLIM.net Company Profile |
SEC |
Zacks Reports |
StockTalk |
News |
Chart |
Request a new note
C
A N
S L
I M
|
TDG
-
NYSE
Transdigm Group Inc
AEROSPACE/DEFENSE - Aerospace/Defense Products and; Services
|
$122.98
|
-1.24
-1.00% |
$125.94
|
477,033
101.13% of 50 DAV
50 DAV is 471,700
|
$136.34
-9.80%
|
6/18/2012
|
$127.00
|
PP = $132.79
|
|
MB = $139.43
|
Most Recent Note - 8/3/2012 12:59:18 PM
G - Small gap up and gain today on light volume. A rebound above its 50 DMA line is needed for its technical stance and outlook to improve. Meanwhile, recent lows in the $117-118 are define near-term support above its 200 DMA line.
>>> The latest Featured Stock Update with an annotated graph appeared on 7/18/2012. Click here.
View all notes |
Alert me of new notes |
CANSLIM.net Company Profile |
SEC |
Zacks Reports |
StockTalk |
News |
Chart |
Request a new note
C
A N
S L
I M
|
Symbol/Exchange
Company Name
Industry Group |
PRICE |
CHANGE
(%Change) |
Day High |
Volume
(% DAV)
(% 50 day avg vol) |
52 Wk Hi
% From Hi |
Featured
Date |
Price
Featured |
Pivot Featured |
|
Max Buy |
VSI
-
NYSE
Vitamin Shoppe Inc
SPECIALTY RETAIL - Specialty Retail, Other
|
$56.71
|
+0.28
0.50% |
$58.23
|
488,459
138.53% of 50 DAV
50 DAV is 352,600
|
$58.88
-3.69%
|
6/29/2012
|
$54.93
|
PP = $55.03
|
|
MB = $57.78
|
Most Recent Note - 8/2/2012 4:41:12 PM
Y - Its 50 DMA line and upward trendline define near-term chart support to watch. Due to report financial results before the market open on Tuesday, August 7, 2012. See the latest FSU analysis for more details and a new annotated graph.
>>> The latest Featured Stock Update with an annotated graph appeared on 8/2/2012. Click here.
View all notes |
Alert me of new notes |
CANSLIM.net Company Profile |
SEC |
Zacks Reports |
StockTalk |
News |
Chart |
Request a new note
C
A N
S L
I M
|
|
|
|
THESE ARE NOT BUY RECOMMENDATIONS!
Comments contained in the body of this report are technical
opinions only. The material herein has been obtained
from sources believed to be reliable and accurate, however,
its accuracy and completeness cannot be guaranteed.
This site is not an investment advisor, hence it does
not endorse or recommend any securities or other investments.
Any recommendation contained in this report may not
be suitable for all investors and it is not to be deemed
an offer or solicitation on our part with respect to
the purchase or sale of any securities. All trademarks,
service marks and trade names appearing in this report
are the property of their respective owners, and are
likewise used for identification purposes only.
This report is a service available
only to active Paid Premium Members.
You may opt-out of receiving report notifications
at any time. Questions or comments may be submitted
by writing to Premium Membership Services 665 S.E. 10 Street, Suite 201 Deerfield Beach, FL 33441-5634 or by calling 1-800-965-8307
or 954-785-1121.
|
|
|

