You are not logged in.
This means you
CAN ONLY VIEW reports that were published prior to Monday, April 14, 2025.
You
MUST UPGRADE YOUR MEMBERSHIP if you want to see any current reports.
AFTER MARKET UPDATE - THURSDAY, AUGUST 6TH, 2009
Previous After Market Report Next After Market Report >>>
|
|
|
|
DOW |
-24.71 |
9,256.26 |
-0.27% |
|
Volume |
1,381,867,390 |
-27% |
|
Volume |
2,471,505,110 |
+1% |
|
NASDAQ |
-19.89 |
1,973.16 |
-1.00% |
|
Advancers |
1,149 |
37% |
|
Advancers |
848 |
30% |
|
S&P 500 |
-5.64 |
997.08 |
-0.56% |
|
Decliners |
1,875 |
60% |
|
Decliners |
1,845 |
65% |
|
Russell 2000 |
-8.37 |
557.62 |
-1.48% |
|
52 Wk Highs |
126 |
|
|
52 Wk Highs |
36 |
|
|
S&P 600 |
-4.09 |
296.16 |
-1.36% |
|
52 Wk Lows |
3 |
|
|
52 Wk Lows |
6 |
|
|
 |
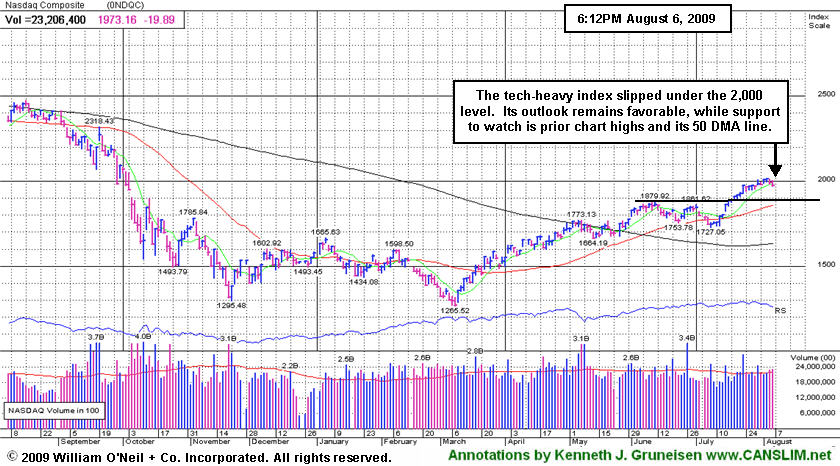
Major Averages Retreat, Yet Remain Poised To Post 4th Straight Week of Gains
Kenneth J. Gruneisen - Passed the CAN SLIM® Master's Exam
A relatively solid start turned into losses as the major averages ended unanimously lower again on Thursday. The volume total on the NYSE exchange was reported lower than the prior session, yet the Nasdaq exchange volume was reported slightly higher than the prior session total. Decliners also led advancers by nearly a 2-to-1 ratio on the Nasdaq exchange, yet the bias was less negative at about a 3-to-2 ratio on the NYSE. There were 19 high-ranked companies from the CANSLIM.net Leaders List that made a new 52-week high and appeared on the CANSLIM.net BreakOuts Page, down from the 27 issues that appeared on the prior session. On both exchanges new 52-week highs still significantly outnumbered 52-week lows, and new lows were in the single digits again.
The major indices opened higher following a smaller-than-expected weekly initial jobless claims tally of 550,000, but still at uncomfortable levels. Continuing claims were more-than-expected at 6.31 million, up from the previous week. The non-farm payrolls report for July is due before Friday's opening bell, which could be a catalyst that determines whether the major average hold on to post gains for their 4th consecutive week.
Cisco Systems (CSCO +0.62%) held its ground but failed to inspire interested in buyers in the tech sector. The Computer - Networking industry giant posted better-than-expected quarterly earnings, but gave an uninspiring revenue forecast. Meanwhile, former American International Group (AIG +1.64%) Chief Executive Maurice "Hank" Greenberg agreed to pay $15 million to settle an accounting charge by the Securities and Exchange Commission. Meanwhile, Citigroup Inc. (C +5.26%) and Bank America Corp. (BAC -0.36%) together were said to have accounted for nearly 25% of total consolidated NYSE volume.
PICTURED: The Nasdaq Composite Index has pulled back under the 2,000 level, and it is consolidating above its prior chart highs and its 50-day moving average line.
|
 Kenneth J. Gruneisen started out as a licensed stockbroker in August 1987, a couple of months prior to the historic stock market crash that took the Dow Jones Industrial Average down -22.6% in a single day. He has published daily fact-based fundamental and technical analysis on high-ranked stocks online for two decades. Through FACTBASEDINVESTING.COM, Kenneth provides educational articles, news, market commentary, and other information regarding proven investment systems that work in good times and bad.
Comments contained in the body of this report are technical opinions only and are not necessarily those of Gruneisen Growth Corp. The material herein has been obtained from sources believed to be reliable and accurate, however, its accuracy and completeness cannot be guaranteed. Our firm, employees, and customers may effect transactions, including transactions contrary to any recommendation herein, or have positions in the securities mentioned herein or options with respect thereto. Any recommendation contained in this report may not be suitable for all investors and it is not to be deemed an offer or solicitation on our part with respect to the purchase or sale of any securities. |
|
 |
Retail Index Bucks Wider Group Losses With Standout Gain
Kenneth J. Gruneisen - Passed the CAN SLIM® Master's Exam
Thursday's session was marked by mostly negative action among the various industry groups regularly tracked in this section. The financial group finally paused, ending the remarkable 11 session winning streak for the Bank Index ($BKX -0.50%) and the 5 session winning streak for the Broker/Dealer Index ($XBD -0.90%). The Biotechnology Index ($BTK -1.96%) and Semiconductor Index ($SOX -1.32%) weighed the most on the tech sector, followed by more modest losses from the Internet Index ($IIX -0.60%) and Networking Index ($NWX -0.56%). Typical defensive market areas also suffered modest losses across the board as the Integrated Oil Index ($XOI -0.85%), Oil Services Index ($OSX -0.39%), Healthcare Index ($HMO -0.28%), and Gold & Silver Index ($XAU -0.27%) each fell less than -1%.
Charts courtesy www.stockcharts.com
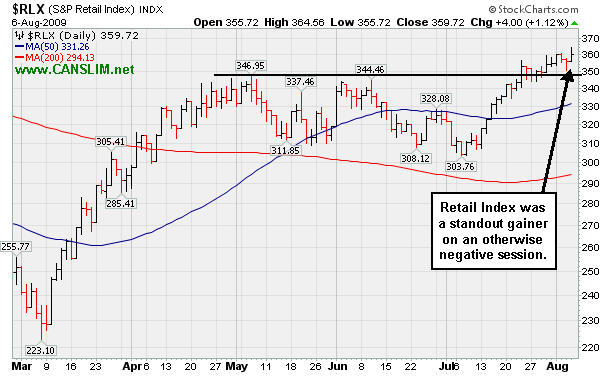
PICTURED: The Retail Index ($RLX +1.12%) was a standout gainer on an otherwise negative session. Macy's Inc (M +5.56%) and Gap Inc (GPS +8.17%) gapped up after each gave upbeat profit forecasts. They have discounted less merchandise and cut costs, and margins improved. Neither company would be on a watchlist for disciplined fans of this investment system, as each of their past 5 quarterly financial reports shows declining sales revenues versus the year ago period. A lack of sales revenues increases is a dead giveaway that a company is not growing.
| Oil Services |
$OSX |
171.59 |
-0.67 |
-0.39% |
+41.35% |
| Healthcare |
$HMO |
1,131.30 |
-3.17 |
-0.28% |
+17.82% |
| Integrated Oil |
$XOI |
959.68 |
-8.19 |
-0.85% |
-2.04% |
| Semiconductor |
$SOX |
299.84 |
-4.02 |
-1.32% |
+41.32% |
| Networking |
$NWX |
198.88 |
-1.12 |
-0.56% |
+38.22% |
| Internet |
$IIX |
201.54 |
-1.21 |
-0.60% |
+50.66% |
| Broker/Dealer |
$XBD |
109.50 |
-1.00 |
-0.90% |
+41.35% |
| Retail |
$RLX |
359.72 |
+4.00 |
+1.12% |
+28.81% |
| Gold & Silver |
$XAU |
152.72 |
-0.41 |
-0.27% |
+23.31% |
| Bank |
$BKX |
43.89 |
-0.22 |
-0.50% |
-0.97% |
| Biotech |
$BTK |
863.80 |
-17.29 |
-1.96% |
+33.47% |
|
|
|
 |
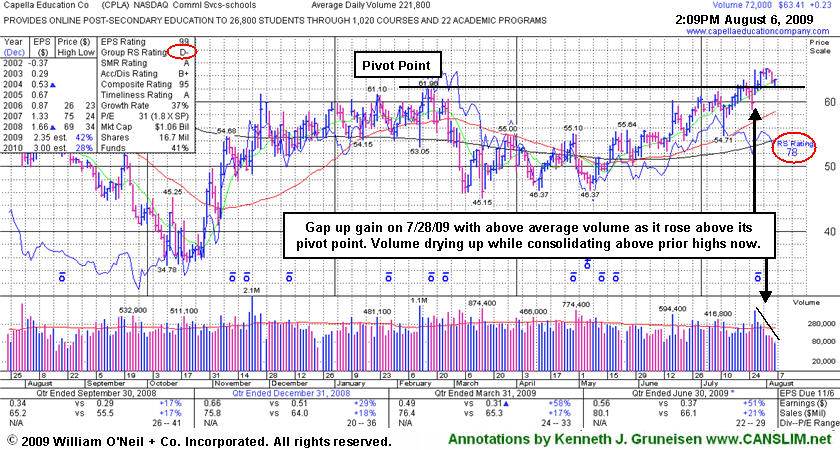
Volume Drying Up While Consolidating Above Prior Highs
Kenneth J. Gruneisen - Passed the CAN SLIM® Master's Exam
Capella Education Co. (CPLA +$0.21 or +0.33% to $63.39) is consolidating above prior chart highs now which are likely to serve as a support level. Volume has been drying up during its healthy consolidation since its gap up gain on 7/28/09 with more than +50% above average volume helped it rise above its pivot point and trigger a technical buy signal. This is a strong performing leader in the Commercial Services-Schools Group. Its small supply of only 13.9 million shares in the float could contribute to greater price volatility in the event of institutional accumulation or distribution. The number of top-rated funds owning an interest rose from 91 in Sept '08, to 134 as of March '09, which is reassuring with respect to the I criteria. It has a very good earnings history that satisfies the C & A criteria.
Since first featured in yellow in the 7/09/09 Mid-Day BreakOuts Report (read here) its Relative Strength rank has slumped under the 80+ guideline, a sign that it has recently been lagging. The group has shown some leadership, yet currently has a D- for a Relative Strength Rating. (See the red circles.)
A follow through day of constructive gains with heavy volume would be a reassuring confirmation of heavy buying demand from the large institutional investors - demand which can fuel a sustained rally. Meanwhile, subsequent deterioration back under its pivot point would negate its breakout, raise concerns, and trigger a technical sell signal.
|
|
|
Color Codes Explained :
Y - Better candidates highlighted by our
staff of experts.
G - Previously featured
in past reports as yellow but may no longer be buyable under the
guidelines.
***Last / Change / Volume quote data in this table corresponds with the timestamp on the note***
Symbol/Exchange
Company Name
Industry Group |
Last |
Chg. |
Vol
% DAV |
Date Featured |
Price Featured |
Latest Pivot Point
Featured |
Status |
| Latest Max Buy Price |
ASIA
-
|
$18.73
|
-0.87
|
495,217
63% DAV
784,033
|
8/2/2009
(Date
Featured) |
$19.27
(Price
Featured) |
PP = $22.19 |
Y |
| MB = $23.30 |
Most Recent Note - 8/6/2009 4:25:04 PM
Y - Loss today on light volume, falling near its 50 DMA line. Holding its ground above that important short term average with lighter volume trading since its its 7/30/09 gap up gain on heavy volume. It was just featured in the August 2009 CANSLIM.net News available here
There are no Featured Stock Updates™ available for this stock at this time. You may request one by clicking here
|
|
C
A
S
I |
News |
Chart |
SEC
View all notes Alert
me of new notes
Company
Profile
|
CPLA
- NASDAQ
Capella Education Co
DIVERSIFIED SERVICES - Education and Training Services
|
$63.39
|
+0.21
|
130,328
60% DAV
215,923
|
7/9/2009
(Date
Featured) |
$59.69
(Price
Featured) |
PP = $62.06 |
Y |
| MB = $65.16 |
Most Recent Note - 8/6/2009 5:33:41 PM
Y - Quietly consolidating near its 52-week high, above its pivot point but under its max buy level since its 7/28/09 breakout. Featured in yellow in the 7/09/09 Mid-Day BreakOuts Report (read here). The group has shown some leadership, yet currently has a low Relative Strength. CPLA is a high-ranked leader in the Commercial Services-Schools Group. Its small supply of only 13.9 million shares in the float could contribute to greater price volatility in the event of institutional accumulation or distribution. The number of top-rated funds owning an interest rose from 91 in Sept '08, to 134 as of March '09, which is reassuring with respect to the I criteria. It has a very good earnings history that satisfies the C & A criteria, while recent quarters showed steady sales revenues increases in the +17-18% range.
>>> The latest Featured Stock Update with an annotated graph appeared on 8/6/2009. click here.
|
|
C
A
S
I |
News |
Chart |
SEC
View all notes Alert
me of new notes
Company
Profile
|
GMCR
- NASDAQ
Green Mtn Coffee Roastrs
FOOD & BEVERAGE - Processed & Packaged Goods
|
$67.88
|
-0.50
|
1,703,203
108% DAV
1,570,848
|
7/17/2009
(Date
Featured) |
$60.15
(Price
Featured) |
PP = $63.79 |
G |
| MB = $66.98 |
Most Recent Note - 8/6/2009 5:39:22 PM
G - Holding its ground since its 8/03/09 gap down after reporting plans for an offering of 4 million shares underwritten by BofA Merrill Lynch. Prior highs in the $62-63 area are initial chart support to watch above its 50 DMA line. Do not be confused by the 3:2 stock split effective 6/09/09. GMCR traded up more than +168% since appearing with an annotated graph under the headline "It May Soon Be Time To Go Green" when featured in the January 2009 CANSLIM.net News (read here).
>>> The latest Featured Stock Update with an annotated graph appeared on 7/30/2009. click here.
|
|
C
A
S
I |
News |
Chart |
SEC
View all notes Alert
me of new notes
Company
Profile
|
HMSY
- NASDAQ
H M S Holdings Corp
COMPUTER SOFTWARE & SERVICES - Healthcare Information Service
|
$36.05
|
-0.86
|
440,917
114% DAV
387,620
|
2/20/2009
(Date
Featured) |
$34.08
(Price
Featured) |
PP = $38.38 |
G |
| MB = $40.30 |
Most Recent Note - 8/6/2009 5:44:08 PM
G - Its loss today on near average volume followed a few damaging sessions that recently drove it well below its 50 DMA line, raising concerns and triggering technical sell signal. Its 7/31/09 gap down and 50 DMA violation following its latest quarterly financial report. This high-ranked Commercial Services - Healthcare firm's prior highs in the $38 area are an important support level. A gap up gain on 6/16/09 with heavy volume triggered a technical buy signal.
>>> The latest Featured Stock Update with an annotated graph appeared on 8/4/2009. click here.
|
|
C
A
S
I |
News |
Chart |
SEC
View all notes Alert
me of new notes
Company
Profile
|
NTES
- NASDAQ
Netease Inc Adr
INTERNET - Internet Information Providers
|
$43.98
|
-1.61
|
2,030,300
89% DAV
2,285,005
|
7/17/2009
(Date
Featured) |
$39.29
(Price
Featured) |
PP = $38.74 |
G |
| MB = $40.68 |
Most Recent Note - 8/6/2009 5:55:29 PM
G - Gapped down today for a loss on lighter volume. It is still extended from its latest sound base, with the nearest chart support at its pivot point. First featured in the 3/31/09 CANSLIM.net Mid-Day Breakouts Report (read here).
>>> The latest Featured Stock Update with an annotated graph appeared on 7/23/2009. click here.
|
|
C
A
S
I |
News |
Chart |
SEC
View all notes Alert
me of new notes
Company
Profile
|
NVEC
- NASDAQ
N V E Corp
ELECTRONICS - Semiconductor - Specialized
|
$51.04
|
-3.27
|
121,731
124% DAV
97,826
|
3/13/2009
(Date
Featured) |
$33.85
(Price
Featured) |
PP = $49.60 |
Y |
| MB = $52.08 |
Most Recent Note - 8/6/2009 6:03:15 PM
Y - Considerable loss today on slightly above average volume, sinking under its "max buy" level toward its 50 DMA line to its lowest level since its 7/23/09 breakout. Prior highs are now an important support level. Its color code is changed to yellow based on its consolidation. Deterioration under its prior chart high ($49.50) would raise concerns. Featured in the 7/23/09 Mid-Day BreakOuts Report (read here) after it gapped up for a considerable gain on heavy volume following news of stronger sales revenues (+41%) and solid earnings increases for the quarter ended June 30, 2009. The technical action was described as a "breakaway gap" from a valid ascending base. Quarterly sales revenues in the 6 million dollar range are still rather minuscule, leaving concerns.
>>> The latest Featured Stock Update with an annotated graph appeared on 8/3/2009. click here.
|
|
C
A
S
I |
News |
Chart |
SEC
View all notes Alert
me of new notes
Company
Profile
|
PEGA
- NASDAQ
Pegasystems Inc
COMPUTER SOFTWARE & SERVICES - Business Software & Services
|
$31.82
|
-0.04
|
647,675
219% DAV
296,355
|
7/29/2009
(Date
Featured) |
$27.53
(Price
Featured) |
PP = $27.49 |
G |
| MB = $28.86 |
Most Recent Note - 8/6/2009 6:03:57 PM
G - Held its ground today following a considerable 8/05/09 gain with nearly 5 times average volume after reporting strong Q2 earnings and raising guidance. The high-ranked software firm triggered a technical buy signal when rising from the "double bottom" base when it was featured in the 7/29/09 mid-day report (read here). The previously noted downturn in annual earnings (the A criteria) from 2003 to 2006 has been followed by a solid turn around and big earnings increases in '07 and '08, and Street expectations for '09 are calling for well above +25% growth.
>>> The latest Featured Stock Update with an annotated graph appeared on 7/29/2009. click here.
|
|
C
A
S
I |
News |
Chart |
SEC
View all notes Alert
me of new notes
Company
Profile
|
TNDM
- NASDAQ
Tandem Diabetes Care Inc
TELECOMMUNICATIONS - Wireless Communications
|
$28.50
|
-3.68
|
3,524,799
362% DAV
973,019
|
3/2/2009
(Date
Featured) |
$18.89
(Price
Featured) |
PP = $32.67 |
G |
| MB = $34.30 |
Most Recent Note - 8/6/2009 6:13:10 PM
G - Initially gapped up today after reporting solid earnings and sales increases for the quarter ended June 30, 2009, then quickly sliced under its 50 DMA line - action indicative of distributional pressure. It rebounded off its session lows but closed below its short-term average and finished in the lower half of its wide intra-day trading range. Color code is changed to green because technically damaging action has negated its 8/03/09 breakout, raising concerns and triggering technical sell signals. A prompt show of support repairing the 50 DMA breach is necessary to help its outlook, otherwise the odds favor that it will spend more time consolidating and it could encounter more distributional pressure. It traded up as much as +82.95% since first featured at $18.89 in the 3/02/09 Mid-Day BreakOuts Report (read here).
>>> The latest Featured Stock Update with an annotated graph appeared on 8/5/2009. click here.
|
|
C
A
S
I |
News |
Chart |
SEC
View all notes Alert
me of new notes
Company
Profile
|
UTA
-
|
$14.43
|
-1.36
|
707,178
152% DAV
465,583
|
7/28/2009
(Date
Featured) |
$12.87
(Price
Featured) |
PP = $12.70 |
G |
| MB = $13.34 |
Most Recent Note - 8/6/2009 6:15:30 PM
G - Negatively reversed again today following a negative reversal on the prior session after it another new 52-week high. A streak of 4 consecutive gains with above average volume lifted it way above its "max buy" level. Prior chart highs in the $12 area are now an important support level to watch on pullbacks. Strong action prompted it to be featured in yellow with pivot point and max buy levels noted in the 7/28/09 mid-day breakouts report (read here), with additional analysis included in the after market update (read here). This Chinese provider of airline tickets and travel related services gapped up on 7/28/09, rising from a choppy 6-week base with a considerable gain on very heavy volume.
>>> The latest Featured Stock Update with an annotated graph appeared on 7/28/2009. click here.
|
|
C
A
S
I |
News |
Chart |
SEC
View all notes Alert
me of new notes
Company
Profile
|
|
|
|
THESE ARE NOT BUY RECOMMENDATIONS!
Comments contained in the body of this report are technical
opinions only. The material herein has been obtained
from sources believed to be reliable and accurate, however,
its accuracy and completeness cannot be guaranteed.
This site is not an investment advisor, hence it does
not endorse or recommend any securities or other investments.
Any recommendation contained in this report may not
be suitable for all investors and it is not to be deemed
an offer or solicitation on our part with respect to
the purchase or sale of any securities. All trademarks,
service marks and trade names appearing in this report
are the property of their respective owners, and are
likewise used for identification purposes only.
This report is a service available
only to active Paid Premium Members.
You may opt-out of receiving report notifications
at any time. Questions or comments may be submitted
by writing to Premium Membership Services 665 S.E. 10 Street, Suite 201 Deerfield Beach, FL 33441-5634 or by calling 1-800-965-8307
or 954-785-1121.
|
|
|

