You are not logged in.
This means you
CAN ONLY VIEW reports that were published prior to Monday, April 14, 2025.
You
MUST UPGRADE YOUR MEMBERSHIP if you want to see any current reports.
AFTER MARKET UPDATE - MONDAY, AUGUST 5TH, 2013
Previous After Market Report Next After Market Report >>>
|
|
|
|
DOW |
-46.23 |
15,612.13 |
-0.30% |
|
Volume |
533,003,820 |
-22% |
|
Volume |
1,427,985,800 |
-13% |
|
NASDAQ |
+3.36 |
3,692.95 |
+0.09% |
|
Advancers |
1,248 |
40% |
|
Advancers |
1,427 |
55% |
|
S&P 500 |
-2.53 |
1,707.14 |
-0.15% |
|
Decliners |
1,778 |
57% |
|
Decliners |
1,068 |
41% |
|
Russell 2000 |
+3.15 |
1,063.01 |
+0.30% |
|
52 Wk Highs |
197 |
|
|
52 Wk Highs |
214 |
|
|
S&P 600 |
+2.90 |
598.58 |
+0.49% |
|
52 Wk Lows |
108 |
|
|
52 Wk Lows |
8 |
|
|
 |
Major Averages Edge Lower With Lighter Volume Totals
Kenneth J. Gruneisen - Passed the CAN SLIM® Master's Exam
Stocks traded in a narrow range throughout the session as stronger-than-expected U.S. services sector growth failed to lift equities. The major averages finished little changed on Monday's session while the volume totals reported lighter than the prior session totals on the Nasdaq exchange and on the NYSE. Advancers led decliners by 7-5 on the Nasdaq exchange, but decliners outnumbered advancers by nearly a 3-2 margin on the NYSE. There were 71 high-ranked companies from the CANSLIM.net Leaders List made new 52-week highs and appeared on the CANSLIM.net BreakOuts Page, down from the prior session total of 75 stocks. The list of stocks hitting new 52-week highs contracted yet still solidly and outnumbered new 52-week lows on both the NYSE and the Nasdaq exchange. The new lows total was in the single digits on the Nasdaq exchange. There were gains for 11 of the 16 high-ranked companies currently included on the Featured Stocks Page.
Seven of the 10 sectors on the S&P ended lower, led by declines in utility stocks. Shares of NextEra Energy Inc (NEE -0.98%). On the earnings front, Berkshire Hathaway Inc (BRKB +0.35%) edged higher after the company posted quarterly results ahead of analysts' estimates. Also on the upside, Tyson Foods Inc (TSN +4.14%) advanced as the company reported earnings and revenues ahead of expectations. In other news, shares of Apple (AAPL +1.49%) after the White House overturned an international trade ruling that prevented the company from selling older versions of the iPhone and iPad.
Turning to fixed income markets, Treasuries ended lower along the curve. The benchmark 10-year note was down 5/16 of a point to yield 2.64% and the 30-year bond was off 25/32 to yield 3.74%.
The market (M criteria) has flashed substantial strength and leadership. Now in a confirmed rally, odds are considered favorable for investors' success with new buying efforts. Investors should be disciplined and selective while looking to be proactive and focused exclusively on the individual leaders best matching the winning models of the fact-based investment system. Study the companies on the CANSLIM.net Featured Stocks Page - a page showing the most action-worthy candidates' latest notes and links to additional resources including detailed analysis with data-packed graphs which are annotated by a Certified expert. The Premium Member Homepage - includes "dynamic archives" to all prior pay reports published. Watch for an announcement via email concerning the next WEBCAST.
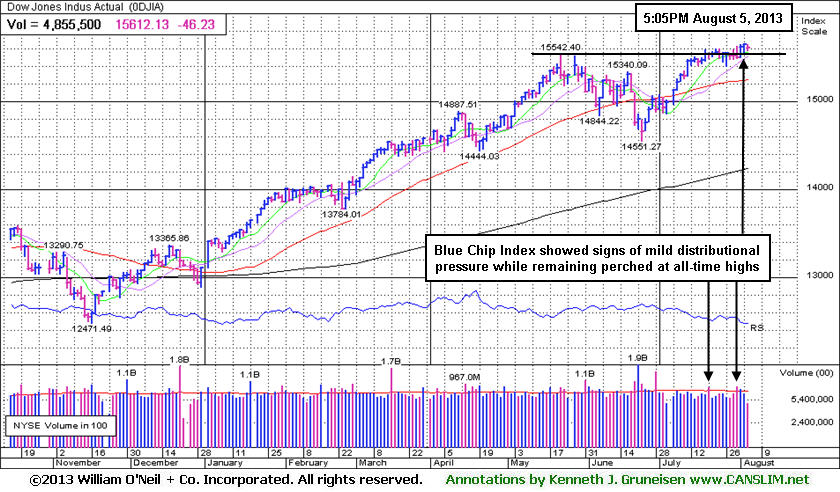
PICTURED: The Dow Jones Industrial Average is up +19.14% year-to-date and holding its ground at all-time highs despite mild distributional pressure in recent weeks. The Blue Chip Index has rallied +25.19% from its November 16, 2012 low.
|
 Kenneth J. Gruneisen started out as a licensed stockbroker in August 1987, a couple of months prior to the historic stock market crash that took the Dow Jones Industrial Average down -22.6% in a single day. He has published daily fact-based fundamental and technical analysis on high-ranked stocks online for two decades. Through FACTBASEDINVESTING.COM, Kenneth provides educational articles, news, market commentary, and other information regarding proven investment systems that work in good times and bad.
Comments contained in the body of this report are technical opinions only and are not necessarily those of Gruneisen Growth Corp. The material herein has been obtained from sources believed to be reliable and accurate, however, its accuracy and completeness cannot be guaranteed. Our firm, employees, and customers may effect transactions, including transactions contrary to any recommendation herein, or have positions in the securities mentioned herein or options with respect thereto. Any recommendation contained in this report may not be suitable for all investors and it is not to be deemed an offer or solicitation on our part with respect to the purchase or sale of any securities. |
|
 |
Healthcare, Networking, and Internet Indexes Rose
Kenneth J. Gruneisen - Passed the CAN SLIM® Master's Exam
The Healthcare Index ($HMO +0.93%) was among the session's best gaining groups while the Gold & Silver Index ($XAU -0.48%) took away from defensively positioned investors. Energy-related shares had a slightly negative bias as the Oil Services Index ($OSX -0.44%) and the Integrated Oil Index ($XOI -0.31%) edged lower. As for the influential financial groups, the Broker/Dealer Index ($XBD -0.14%) and Bank Index ($BKX -0.36%) both edged lower. The Retail Index ($RLX +0.08%) held its ground. The Networking Index ($NWX +0.80%) and the Internet Index ($IIX +0.38%) led the tech sector with modest gains, meanwhile the Biotechnology Index ($BTK +0.07%) finished flat and the Semiconductor Index ($SOX -0.26%) edged lower.
Charts courtesy www.stockcharts.com
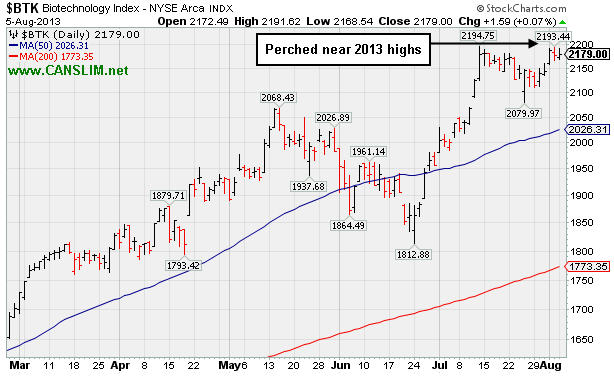
PICTURED: The Biotechnology Index ($BTK +0.07%) is perched near its 2013 high.
| Oil Services |
$OSX |
266.34 |
-1.18 |
-0.44% |
+20.98% |
| Healthcare |
$HMO |
3,403.13 |
+31.24 |
+0.93% |
+35.36% |
| Integrated Oil |
$XOI |
1,386.70 |
-4.34 |
-0.31% |
+11.67% |
| Semiconductor |
$SOX |
482.14 |
-1.24 |
-0.26% |
+25.54% |
| Networking |
$NWX |
293.61 |
+2.34 |
+0.80% |
+29.60% |
| Internet |
$IIX |
409.74 |
+1.54 |
+0.38% |
+25.30% |
| Broker/Dealer |
$XBD |
135.91 |
-0.19 |
-0.14% |
+44.08% |
| Retail |
$RLX |
851.10 |
+0.70 |
+0.08% |
+30.32% |
| Gold & Silver |
$XAU |
93.74 |
-0.45 |
-0.48% |
-43.39% |
| Bank |
$BKX |
66.71 |
-0.24 |
-0.36% |
+30.09% |
| Biotech |
$BTK |
2,179.00 |
+1.59 |
+0.07% |
+40.85% |
|
|
|
 |
Follow Through Gains Backed By Volume
Kenneth J. Gruneisen - Passed the CAN SLIM® Master's Exam
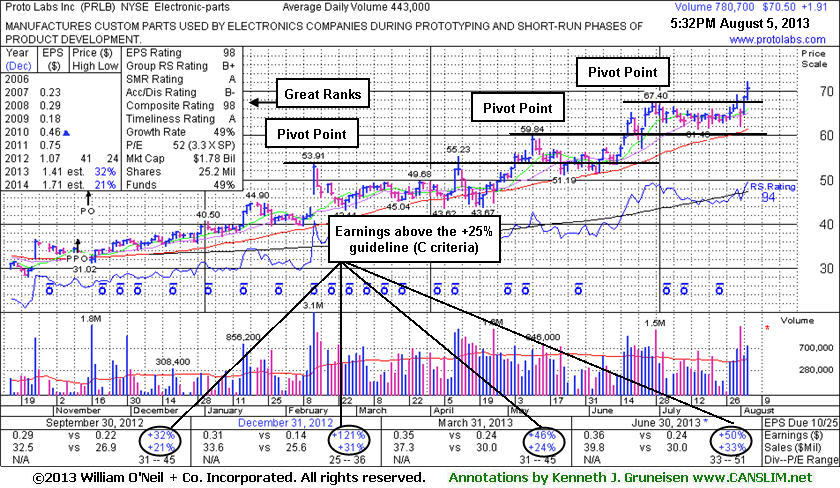
Proto Labs Inc (PRLB +$1.91 or +2.78% to $70.50) rallied with +77% above average volume as it powered further above its pivot point for yet another new 52-week high, a confirming gain following last week's new (or add-on) technical buy signal. Its 50-day moving average (DMA) line defines important support just below recent lows in the $61 area. Disciplined investors always limit losses by selling if any stock falls more than -7% from their purchase price. Its small supply of only 18.9 million shares (S criteria) in the publicly traded float is ideal, yet it can contribute to greater price volatility in the event of institutional buying or selling.
The high-ranked Electronic - Parts firm was last shown in this FSU section with an annotated graph on 7/15/13 under the headline, "Volume Totals Cooling During Tight Consolidation Near Highs". PRLB has traded up +41% from $49.97 when first featured in yellow in the 4/10/13 mid-day report (read here). Earnings were +50% on +33% sales revenues for the Jun '13 quarter, continuing its strong growth trend satisfying the C criteria and helping it earn a very high 98 Earnings Per Share rank. The number of top-rated funds owning its shares rose from 131 in Jun '12 to 218 in Jun '13, a reassuring trend concerning the I criteria.
|
|
|
Color Codes Explained :
Y - Better candidates highlighted by our
staff of experts.
G - Previously featured
in past reports as yellow but may no longer be buyable under the
guidelines.
***Last / Change / Volume data in this table is the closing quote data***
Symbol/Exchange
Company Name
Industry Group |
PRICE |
CHANGE
(%Change) |
Day High |
Volume
(% DAV)
(% 50 day avg vol) |
52 Wk Hi
% From Hi |
Featured
Date |
Price
Featured |
Pivot Featured |
|
Max Buy |
AMBA
-
NASDAQ
Ambarella Inc
ELECTRONICS - Semiconductor - Specialized
|
$16.83
|
+0.08
0.48% |
$17.24
|
730,834
61.87% of 50 DAV
50 DAV is 1,181,200
|
$19.44
-13.42%
|
7/15/2013
|
$17.87
|
PP = $18.68
|
|
MB = $19.61
|
Most Recent Note - 8/2/2013 6:58:11 PM
G - Posted a gain on lighter volume, rebounding toward its 50 DMA line which may act as resistance following the technical violation which triggered a sell signal earlier this week. A prompt rebound above that important short-term average would help its outlook improve.
>>> The latest Featured Stock Update with an annotated graph appeared on 7/17/2013. Click here.
View all notes |
Alert me of new notes |
CANSLIM.net Company Profile |
SEC |
Zacks Reports |
StockTalk |
News |
Chart |
Request a new note
C
A N
S L
I M


|
CELG
-
NASDAQ
Celgene Corp
DRUGS - Drug Manufacturers - Major
|
$146.83
|
-0.52
-0.35% |
$148.28
|
1,546,992
53.85% of 50 DAV
50 DAV is 2,872,700
|
$149.92
-2.06%
|
7/11/2013
|
$133.25
|
PP = $131.92
|
|
MB = $138.52
|
Most Recent Note - 7/29/2013 6:00:46 PM
G - Extended from its prior base after last week's volume-driven gains, it is now consolidating above prior highs defining initial support in the $131 area. See the latest FSU analysis for more details and a new annotated graph.
>>> The latest Featured Stock Update with an annotated graph appeared on 7/29/2013. Click here.
View all notes |
Alert me of new notes |
CANSLIM.net Company Profile |
SEC |
Zacks Reports |
StockTalk |
News |
Chart |
Request a new note
C
A N
S L
I M
|
FLT
-
NYSE
Fleetcor Technologies
DIVERSIFIED SERVICES - Business/Management Services
|
$98.78
|
+0.34
0.35% |
$100.30
|
514,346
70.56% of 50 DAV
50 DAV is 729,000
|
$100.87
-2.07%
|
5/29/2013
|
$86.02
|
PP = $85.66
|
|
MB = $89.94
|
Most Recent Note - 8/2/2013 12:47:14 PM
G- Reported earnings +37% on +29% sales revenues for the Jun '13 quarter. Finally making meaningful progress after forming a new late-stage base, it finished strong on the prior session and gapped up today hitting new 52-week and all-time highs with a 3rd consecutive gain backed by above average volume. Found support near its 50 DMA during its latest consolidation.
>>> The latest Featured Stock Update with an annotated graph appeared on 7/18/2013. Click here.
View all notes |
Alert me of new notes |
CANSLIM.net Company Profile |
SEC |
Zacks Reports |
StockTalk |
News |
Chart |
Request a new note
C
A N
S L
I M
|
GNRC
-
NYSE
Generac Hldgs Inc
CONSUMER DURABLES - Electronic Equipment
|
$42.47
|
+0.23
0.54% |
$42.57
|
1,173,847
98.14% of 50 DAV
50 DAV is 1,196,100
|
$44.30
-4.13%
|
7/30/2013
|
$42.60
|
PP = $42.10
|
|
MB = $44.21
|
Most Recent Note - 8/2/2013 12:49:56 PM
Y - Gapped down today after pricing a Secondary Offering. It recently rallied from an advanced "3-weeks tight" base. Disciplined investors always limit losses by selling if any stock falls more than -7% from its purchase price.
>>> The latest Featured Stock Update with an annotated graph appeared on 7/30/2013. Click here.
View all notes |
Alert me of new notes |
CANSLIM.net Company Profile |
SEC |
Zacks Reports |
StockTalk |
News |
Chart |
Request a new note
C
A N
S L
I M
|
LOPE
-
NASDAQ
Grand Canyon Education
DIVERSIFIED SERVICES - Education and; Training Services
|
$36.03
|
+0.83
2.36% |
$36.09
|
478,682
109.49% of 50 DAV
50 DAV is 437,200
|
$37.17
-3.07%
|
6/19/2013
|
$31.47
|
PP = $34.17
|
|
MB = $35.88
|
Most Recent Note - 7/30/2013 6:37:23 PM
Y - Reported its second quarter results following today's market close after enduring mild distributional pressure near its 52-week high. Finished still perched above its pivot point and below its "max buy" level. Prior highs in the $34 area define support along with its 50 DMA line.
>>> The latest Featured Stock Update with an annotated graph appeared on 7/19/2013. Click here.
View all notes |
Alert me of new notes |
CANSLIM.net Company Profile |
SEC |
Zacks Reports |
StockTalk |
News |
Chart |
Request a new note
C
A N
S L
I M
|
Symbol/Exchange
Company Name
Industry Group |
PRICE |
CHANGE
(%Change) |
Day High |
Volume
(% DAV)
(% 50 day avg vol) |
52 Wk Hi
% From Hi |
Featured
Date |
Price
Featured |
Pivot Featured |
|
Max Buy |
PCLN
-
NASDAQ
Priceline.Com Inc
INTERNET - Internet Software and Services
|
$928.58
|
+20.22
2.23% |
$930.74
|
704,503
108.39% of 50 DAV
50 DAV is 650,000
|
$926.40
0.24%
|
7/8/2013
|
$878.28
|
PP = $847.43
|
|
MB = $889.80
|
Most Recent Note - 7/29/2013 1:52:10 PM
G - Due to report earnings August 8th. Extended from its prior base, enduring distributional pressure while consolidating in a tight range near its high. Prior highs in the $847 area define support to watch on pullbacks.
>>> The latest Featured Stock Update with an annotated graph appeared on 7/25/2013. Click here.
View all notes |
Alert me of new notes |
CANSLIM.net Company Profile |
SEC |
Zacks Reports |
StockTalk |
News |
Chart |
Request a new note
C
A N
S L
I M
|
PRAA
-
NASDAQ
Portfolio Recovery Assoc
DIVERSIFIED SERVICES - Business/Management Services
|
$52.42
|
+0.34
0.65% |
$52.57
|
409,104
103.68% of 50 DAV
50 DAV is 394,600
|
$54.62
-4.03%
|
7/31/2013
|
$51.43
|
PP = $54.72
|
|
MB = $57.46
|
Most Recent Note - 8/2/2013 8:52:21 AM
Y - Do not be confused by 3:1 share split impacting prices today (pivot point, max buy price have been adjusted accordingly). It rallied above its 50 DMA line with a 3rd consecutive volume-driven gain but has not triggered a proper technical buy signal since returning to the Featured Stocks list highlighted in yellow with new pivot point cited based on its 6/17/13 high plus 10 cents in Wednesday's mid-day report (read here) with caution - "It faces some resistance and needs additional volume-driven gains to trigger a proper new technical buy signal. Reported earnings +37% on +24% sales revenues for the Jun '13 quarter. Showing resilience since dropped from the Featured Stocks list on 7/10/13 due to technical weakness."
>>> The latest Featured Stock Update with an annotated graph appeared on 8/2/2013. Click here.
View all notes |
Alert me of new notes |
CANSLIM.net Company Profile |
SEC |
Zacks Reports |
StockTalk |
News |
Chart |
Request a new note
C
A N
S L
I M
|
PRLB
-
NYSE
Proto Labs Inc
MANUFACTURING - Small Tools and Accessories
|
$70.50
|
+1.91
2.78% |
$72.08
|
786,686
177.58% of 50 DAV
50 DAV is 443,000
|
$69.22
1.86%
|
7/29/2013
|
$64.86
|
PP = $67.50
|
|
MB = $70.88
|
 Most Recent Note - 8/5/2013 6:00:38 PM
Y - Tallied confirming gains with +77% above average volume while rising further above its pivot point to a new 52-week high. See the latest FSU analysis for more details and a new annotated graph.
>>> The latest Featured Stock Update with an annotated graph appeared on 8/5/2013. Click here.
View all notes |
Alert me of new notes |
CANSLIM.net Company Profile |
SEC |
Zacks Reports |
StockTalk |
News |
Chart |
Request a new note
C
A N
S L
I M
|
QCOR
-
NASDAQ
Questcor Pharmaceuticals
DRUGS - Biotechnology
|
$66.79
|
+0.94
1.43% |
$66.80
|
1,800,567
84.51% of 50 DAV
50 DAV is 2,130,700
|
$70.55
-5.33%
|
7/31/2013
|
$66.46
|
PP = $59.01
|
|
MB = $61.96
|
Most Recent Note - 8/2/2013 1:16:39 PM
G - Retreating from another new high today after an impressive streak of volume-driven gains. Quickly got extended beyond its "max buy" level after highlighted in yellow in the 7/31/13 mid-day report (read here) with a weekly graph which illustrated its powerful long-term breakout to new highs. See the latest FSU analysis for more details and an annotated daily graph.
>>> The latest Featured Stock Update with an annotated graph appeared on 8/1/2013. Click here.
View all notes |
Alert me of new notes |
CANSLIM.net Company Profile |
SEC |
Zacks Reports |
StockTalk |
News |
Chart |
Request a new note
C
A N
S L
I M
|
RRTS
-
NYSE
Roadrunner Trans Systems
TRANSPORTATION - Air Delivery and Freight Service
|
$30.84
|
+0.35
1.15% |
$30.93
|
89,444
63.84% of 50 DAV
50 DAV is 140,100
|
$30.98
-0.46%
|
4/3/2013
|
$22.77
|
PP = $23.75
|
|
MB = $24.94
|
Most Recent Note - 7/29/2013 1:34:59 PM
G - Still perched near its 52-week high with volume totals cooling while consolidating in a tight trading range for the past few weeks. Reports results for the Jun '13 quarter on Wednesday, July 31, 2013 after market close.
>>> The latest Featured Stock Update with an annotated graph appeared on 7/22/2013. Click here.
View all notes |
Alert me of new notes |
CANSLIM.net Company Profile |
SEC |
Zacks Reports |
StockTalk |
News |
Chart |
Request a new note
C
A N
S L
I M
|
Symbol/Exchange
Company Name
Industry Group |
PRICE |
CHANGE
(%Change) |
Day High |
Volume
(% DAV)
(% 50 day avg vol) |
52 Wk Hi
% From Hi |
Featured
Date |
Price
Featured |
Pivot Featured |
|
Max Buy |
SFUN
-
NYSE
Soufun Hldgs Ltd Ads A
INTERNET - Internet Information Providers
|
$35.05
|
+0.18
0.52% |
$35.30
|
304,905
87.82% of 50 DAV
50 DAV is 347,200
|
$36.43
-3.79%
|
7/16/2013
|
$29.54
|
PP = $27.90
|
|
MB = $29.30
|
Most Recent Note - 8/1/2013 12:55:58 PM
G - Extended from its latest base following volume-driven gains. Prior highs in the $28-29 area define initial support to watch.
>>> The latest Featured Stock Update with an annotated graph appeared on 7/16/2013. Click here.
View all notes |
Alert me of new notes |
CANSLIM.net Company Profile |
SEC |
Zacks Reports |
StockTalk |
News |
Chart |
Request a new note
C
A N
S L
I M
|
SSNC
-
NASDAQ
S S & C Technologies
COMPUTER SOFTWARE and SERVICES - Application Software
|
$36.60
|
-0.38
-1.03% |
$37.29
|
464,266
120.75% of 50 DAV
50 DAV is 384,500
|
$38.80
-5.67%
|
7/11/2013
|
$35.80
|
PP = $34.54
|
|
MB = $36.27
|
Most Recent Note - 8/2/2013 10:11:54 AM
G - Gapped up today hitting a new 52-week high after reporting earnings +45% on +47% sales revenues for the Jun '13 quarter. Color code is changed to green while blasting above its "max buy" level. During its recent consolidation it stayed well above prior highs in the $34 area now coinciding with its 50 DMA line and defining important near-term support.
>>> The latest Featured Stock Update with an annotated graph appeared on 7/12/2013. Click here.
View all notes |
Alert me of new notes |
CANSLIM.net Company Profile |
SEC |
Zacks Reports |
StockTalk |
News |
Chart |
Request a new note
C
A N
S L
I M
|
SSYS
-
NASDAQ
Stratasys Ltd
COMPUTER HARDWARE - Computer Peripherals
|
$90.59
|
+0.59
0.66% |
$91.65
|
361,492
49.22% of 50 DAV
50 DAV is 734,500
|
$96.44
-6.07%
|
7/8/2013
|
$91.44
|
PP = $95.00
|
|
MB = $99.75
|
Most Recent Note - 7/30/2013 6:33:40 PM
Y - Encountered more distributional pressure and suffered a loss on higher volume while slumping near its 50 DMA line again. More damaging losses could raise greater concerns and trigger worrisome technical sell signals.
>>> The latest Featured Stock Update with an annotated graph appeared on 7/24/2013. Click here.
View all notes |
Alert me of new notes |
CANSLIM.net Company Profile |
SEC |
Zacks Reports |
StockTalk |
News |
Chart |
Request a new note
C
A N
S L
I M
|
STMP
-
NASDAQ
Stamps.Com Inc
INTERNET - Internet Software and Services
|
$41.55
|
-1.01
-2.37% |
$42.41
|
210,741
152.82% of 50 DAV
50 DAV is 137,900
|
$46.47
-10.59%
|
7/31/2013
|
$40.00
|
PP = $42.98
|
|
MB = $45.13
|
Most Recent Note - 8/5/2013 6:02:33 PM
Y - Encountered distributional pressure today with a loss on higher volume. Reported earnings +50% on +14% sales revenues for the Jun '13 quarter, continuing its strong earnings history. Disciplined investors limit losses if any stock falls more than -7% from their purchase price.
>>> The latest Featured Stock Update with an annotated graph appeared on 7/31/2013. Click here.
View all notes |
Alert me of new notes |
CANSLIM.net Company Profile |
SEC |
Zacks Reports |
StockTalk |
News |
Chart |
Request a new note
C
A N
S L
I M
|
VRX
-
NYSE
Valeant Pharmaceuticals
DRUGS - Drug Manufacturers - Other
|
$95.57
|
-0.88
-0.91% |
$97.02
|
671,100
33.09% of 50 DAV
50 DAV is 2,028,000
|
$96.95
-1.42%
|
4/30/2013
|
$60.24
|
PP = $76.66
|
|
MB = $80.49
|
Most Recent Note - 7/29/2013 1:37:46 PM
Y- Volume totals have still been cooling while consolidating near its 52-week high after completing a new Public Offering on 6/18/13 following recent M&A news. Formed a cup-with-handle base over the past 9 weeks, however no new pivot point has been cited while members were repeatedly cautioned - "Concerns were raised by its Mar '13 earnings report with only a +14% earnings increase, below the +25% minimum guideline (C criteria) for buy candidates."
>>> The latest Featured Stock Update with an annotated graph appeared on 7/23/2013. Click here.
View all notes |
Alert me of new notes |
CANSLIM.net Company Profile |
SEC |
Zacks Reports |
StockTalk |
News |
Chart |
Request a new note
C
A N
S L
I M
|
Symbol/Exchange
Company Name
Industry Group |
PRICE |
CHANGE
(%Change) |
Day High |
Volume
(% DAV)
(% 50 day avg vol) |
52 Wk Hi
% From Hi |
Featured
Date |
Price
Featured |
Pivot Featured |
|
Max Buy |
YNDX
-
NASDAQ
Yandex N V Class A
INTERNET - Internet Information Providers
|
$33.50
|
-0.28
-0.83% |
$33.81
|
1,415,235
56.32% of 50 DAV
50 DAV is 2,512,700
|
$34.27
-2.25%
|
7/10/2013
|
$29.29
|
PP = $29.59
|
|
MB = $31.07
|
Most Recent Note - 7/29/2013 1:45:38 PM
G - Retreating form its 52-week high today after getting extended following 2 consecutive volume-driven gains into new high territory. Prior highs in the $28-29 area define near-term support to watch.
>>> The latest Featured Stock Update with an annotated graph appeared on 7/26/2013. Click here.
View all notes |
Alert me of new notes |
CANSLIM.net Company Profile |
SEC |
Zacks Reports |
StockTalk |
News |
Chart |
Request a new note
C
A N
S L
I M
|
|
|
|
THESE ARE NOT BUY RECOMMENDATIONS!
Comments contained in the body of this report are technical
opinions only. The material herein has been obtained
from sources believed to be reliable and accurate, however,
its accuracy and completeness cannot be guaranteed.
This site is not an investment advisor, hence it does
not endorse or recommend any securities or other investments.
Any recommendation contained in this report may not
be suitable for all investors and it is not to be deemed
an offer or solicitation on our part with respect to
the purchase or sale of any securities. All trademarks,
service marks and trade names appearing in this report
are the property of their respective owners, and are
likewise used for identification purposes only.
This report is a service available
only to active Paid Premium Members.
You may opt-out of receiving report notifications
at any time. Questions or comments may be submitted
by writing to Premium Membership Services 665 S.E. 10 Street, Suite 201 Deerfield Beach, FL 33441-5634 or by calling 1-800-965-8307
or 954-785-1121.
|
|
|

