You are not logged in.
This means you
CAN ONLY VIEW reports that were published prior to Monday, April 14, 2025.
You
MUST UPGRADE YOUR MEMBERSHIP if you want to see any current reports.
AFTER MARKET UPDATE - WEDNESDAY, AUGUST 5TH, 2009
Previous After Market Report Next After Market Report >>>
|
|
|
|
DOW |
-39.22 |
9,280.97 |
-0.42% |
|
Volume |
1,880,773,770 |
+51% |
|
Volume |
2,450,417,400 |
+7% |
|
NASDAQ |
-21.40 |
1,993.05 |
-1.06% |
|
Advancers |
1,387 |
44% |
|
Advancers |
978 |
35% |
|
S&P 500 |
-2.93 |
1,002.72 |
-0.29% |
|
Decliners |
1,639 |
52% |
|
Decliners |
1,748 |
62% |
|
Russell 2000 |
-4.75 |
565.99 |
-0.83% |
|
52 Wk Highs |
151 |
|
|
52 Wk Highs |
52 |
|
|
S&P 600 |
-2.55 |
300.25 |
-0.84% |
|
52 Wk Lows |
4 |
|
|
52 Wk Lows |
4 |
|
|
 |
Financial Stocks Post Encouraging Gains Amid Wider Distributional Pressure
Kenneth J. Gruneisen - Passed the CAN SLIM® Master's Exam
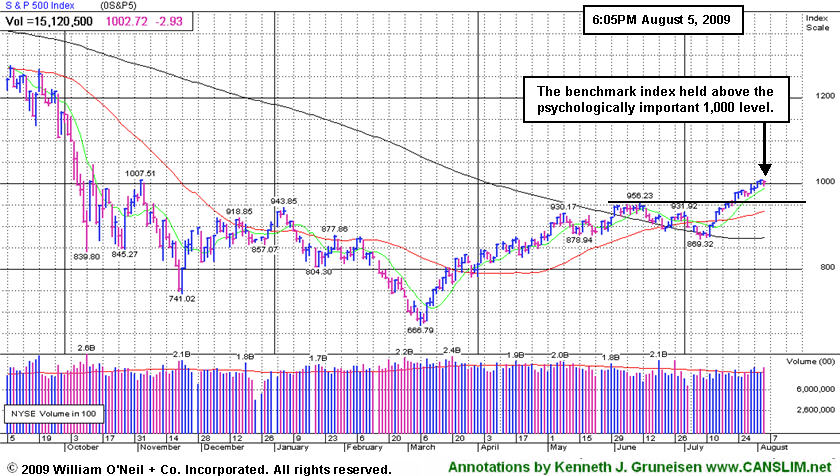
The major averages ended unanimously lower on Wednesday while volume totals on the NYSE and Nasdaq exchange were reported higher than the prior session totals, indicating distributional selling pressure from large institutional investors. Decliners led advancers by nearly a 2-to-1 ratio on the Nasdaq exchange while on the NYSE the bias was less negative with about an 8-to-7 ratio. There were 27 high-ranked companies from the CANSLIM.net Leaders List that made a new 52-week high and appeared on the CANSLIM.net BreakOuts Page, down from the 38 issues that appeared on the prior session. On both exchanges new 52-week highs still significantly outnumbered 52-week lows, and new lows were in the single digits again.
Stocks started the session flat. Before the opening bell, the latest ADP Employment Report showed 371,000 jobs were slashed in July, greater than the 350,000 job losses forecast, and data for June was revised lower to 463,000 job cuts. Selling pressure intensified ahead of the latest ISM Service Index which unexpectedly slipped for July to 46.4, down from 47.0 in June, missing expectations for a 48.0 reading. Meanwhile, the third straight monthly increase in factory orders, +0.4% higher in June, failed to inspire buyers. The non-farm payrolls report, due on Friday, is expected to show 328,000 job losses.
Better-than-expected earnings results reported by Marsh & McLennan (MMC +5.40%) helped give insurers a boost. Short-covering was said to have given AIG (AIG +62.72%) jolt. Continued strength among financial issues including Bank of America (BAC +6.52%) and JPMorgan Chase (JPM +3.90%) helped the market's outlook improve. See the Industry Group Watch section in this report (read here) for a look at the Bank Index's significant progress of late which bodes well for the broader market outlook. The market's more favorable conditions of late (concerning the M criteria) are detailed more extensively in the new August 2009 issue of our monthly newsletter, CANSLIM.net News (read here).
The US dollar traded at $1.4447 per Euro, the weakest level since December 18th. Prices were initially pressured by a larger-than-expected weekly inventory build of 1.67 million barrels, then a rebound in commodity prices lifted oil +0.8% to nearly $72 per barrel.
PICTURED: The S&P 500 Index stayed above the 1,000 level, however decliners outnumbered advancing issues by 2-to-1 among the companies in the S&P 500 Index as well as the Dow Jones Industrial Average.
|
 Kenneth J. Gruneisen started out as a licensed stockbroker in August 1987, a couple of months prior to the historic stock market crash that took the Dow Jones Industrial Average down -22.6% in a single day. He has published daily fact-based fundamental and technical analysis on high-ranked stocks online for two decades. Through FACTBASEDINVESTING.COM, Kenneth provides educational articles, news, market commentary, and other information regarding proven investment systems that work in good times and bad.
Comments contained in the body of this report are technical opinions only and are not necessarily those of Gruneisen Growth Corp. The material herein has been obtained from sources believed to be reliable and accurate, however, its accuracy and completeness cannot be guaranteed. Our firm, employees, and customers may effect transactions, including transactions contrary to any recommendation herein, or have positions in the securities mentioned herein or options with respect thereto. Any recommendation contained in this report may not be suitable for all investors and it is not to be deemed an offer or solicitation on our part with respect to the purchase or sale of any securities. |
|
 |
Bank Index Rallies Above Prior High For 11th Straight Gain
Kenneth J. Gruneisen - Passed the CAN SLIM® Master's Exam
The Healthcare Index ($HMO -3.11%) and Biotechnology Index ($BTK -1.83%) were among Wednesday's worst laggards. Losses from the energy group created a drag, with the Oil Services Index ($OSX -1.78%) and Integrated Oil Index ($XOI -1.03%) sinking on the mostly negative session. The Semiconductor Index ($SOX -1.09%) lost ground, followed by smaller losses from the Internet Index ($IIX -0.53%) and the Networking Index ($NWX -0.32%). Modest losses from the Retail Index ($RLX -0.38%) and Gold & Silver Index ($XAU -0.38%) also prohibited the major averages from making any headway.
Charts courtesy www.stockcharts.com
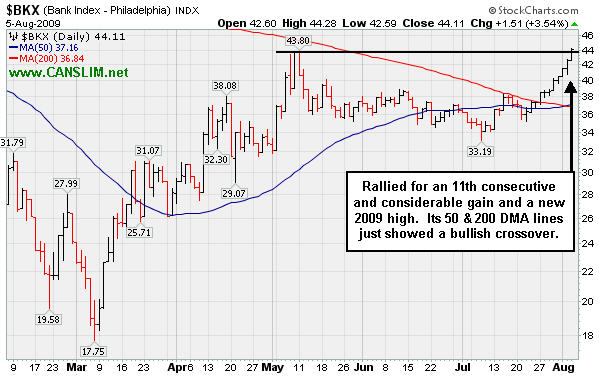
PICTURED: The Bank Index ($BKX +3.54%) was a standout gainer on Wednesday's mostly negative session, rallying for an 11th consecutive and considerable gain and a new 2009 high. Many times in the past it has been pointed out in this Industry Group Watch section that the financial group is a reliable leading indicator. This is considered very encouraging action from the financial group that bodes well for investors. The Broker/Dealer Index ($XBD +0.34% - not shown) also finished the session with a small gain, bucking the broader market's negative bias.
| Oil Services |
$OSX |
172.26 |
-3.12 |
-1.78% |
+41.91% |
| Healthcare |
$HMO |
1,134.47 |
-36.42 |
-3.11% |
+18.15% |
| Integrated Oil |
$XOI |
967.87 |
-10.07 |
-1.03% |
-1.21% |
| Semiconductor |
$SOX |
303.86 |
-3.36 |
-1.09% |
+43.22% |
| Networking |
$NWX |
200.00 |
-0.64 |
-0.32% |
+39.00% |
| Internet |
$IIX |
202.75 |
-1.08 |
-0.53% |
+51.57% |
| Broker/Dealer |
$XBD |
110.50 |
+0.37 |
+0.34% |
+42.64% |
| Retail |
$RLX |
355.72 |
-1.37 |
-0.38% |
+27.38% |
| Gold & Silver |
$XAU |
153.13 |
-0.58 |
-0.38% |
+23.64% |
| Bank |
$BKX |
44.11 |
+1.51 |
+3.54% |
-0.47% |
| Biotech |
$BTK |
881.09 |
-16.47 |
-1.83% |
+36.15% |
|
|
|
 |
Breakaway Gap Occurred Just Ahead Of Earnings News
Kenneth J. Gruneisen - Passed the CAN SLIM® Master's Exam
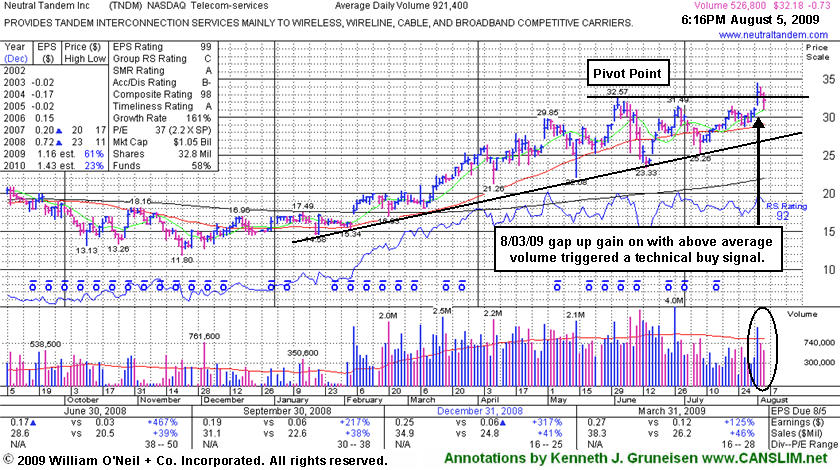
Neutral Tandem Inc (TNDM -$0.73 or -2.22% to $32.18) is consolidating on lighter volume toward prior chart highs. It gapped up on 8/03/09 for a considerable gain on more than +50% above average volume and a new all-time high, triggering a technical buy signal. It is due to report earnings before Thursday's opening bell. A recent newspaper article suggested its June 29th high ($31.49) was "an adequate buy point." It rallied above that prior peak from a 5-week flat base, but more significantly, it also cleared its resistance level at its June 2nd high of $32.57. Its color code was changed to yellow with new pivot point cited based upon its 52-week high plus ten cents.
Subsequent deterioration into its prior base would raise concerns and negate its latest breakout. After prior chart highs in the $31-32 area, its 50-day moving average line and then its multi-month upward trendline are the next important support levels where violations would trigger additional sell signals. Disciplined investors always limit losses by selling any stock if it falls more than -7% from their buy price. TNDM has traded up as much as +82.95% since first featured at $18.89 in the 3/02/09 Mid-Day BreakOuts Report (read here).
|
|
|
Color Codes Explained :
Y - Better candidates highlighted by our
staff of experts.
G - Previously featured
in past reports as yellow but may no longer be buyable under the
guidelines.
***Last / Change / Volume quote data in this table corresponds with the timestamp on the note***
Symbol/Exchange
Company Name
Industry Group |
Last |
Chg. |
Vol
% DAV |
Date Featured |
Price Featured |
Latest Pivot Point
Featured |
Status |
| Latest Max Buy Price |
ASIA
-
|
$19.56
|
-0.35
|
656,628
N/A
|
8/2/2009
(Date
Featured) |
$19.27
(Price
Featured) |
PP = $22.19 |
Y |
| MB = $23.30 |
Most Recent Note - 8/5/2009 4:08:15 PM
Y - Small loss today on light volume. Generally edging higher on lighter volume since its its 7/30/09 gap up gain on heavy volume. It was just featured in the August 2009 CANSLIM.net News available here
There are no Featured Stock Updates™ available for this stock at this time. You may request one by clicking here
|
|
C
A
S
I |
News |
Chart |
SEC
View all notes Alert
me of new notes
Company
Profile
|
CPLA
- NASDAQ
Capella Education Co
DIVERSIFIED SERVICES - Education and Training Services
|
$63.15
|
-1.57
|
88,215
N/A
|
7/9/2009
(Date
Featured) |
$59.69
(Price
Featured) |
PP = $62.06 |
Y |
| MB = $65.16 |
Most Recent Note - 8/5/2009 4:09:58 PM
Y - Quietly consolidating near its 52-week high. On 7/28/09 it reported solid results for the quarter ended June 30, 2009, with a +21% increase in sales revenues (accelerating) and +51% earnings per share, and it technically gapped up and traded more than the +50% above average volume guideline as it rose above its pivot point. Featured in yellow in the 7/09/09 Mid-Day BreakOuts Report (read here). The group has shown some leadership, yet currently has a low Relative Strength. CPLA is a high-ranked leader in the Commercial Services-Schools Group. Its small supply of only 13.9 million shares in the float could contribute to greater price volatility in the event of institutional accumulation or distribution. The number of top-rated funds owning an interest rose from 91 in Sept '08, to 135 as of March '09, which is reassuring with respect to the I criteria. It has a very good earnings history that satisfies the C & A criteria, while recent quarters showed steady sales revenues increases in the +17-18% range.
>>> The latest Featured Stock Update with an annotated graph appeared on 7/20/2009. click here.
|
|
C
A
S
I |
News |
Chart |
SEC
View all notes Alert
me of new notes
Company
Profile
|
GMCR
- NASDAQ
Green Mtn Coffee Roastrs
FOOD & BEVERAGE - Processed & Packaged Goods
|
$68.38
|
+1.62
|
1,222,350
N/A
|
7/17/2009
(Date
Featured) |
$60.15
(Price
Featured) |
PP = $63.79 |
G |
| MB = $66.98 |
Most Recent Note - 8/5/2009 4:11:07 PM
G - Quietly holding its ground since its 8/03/09 gap down after reporting plans for an offering of 4 million shares underwritten by BofA Merrill Lynch. Prior highs in the $62-63 area are initial chart support to watch above its 50 DMA line. Do not be confused by the 3:2 stock split effective 6/09/09. GMCR traded up more than +168% since appearing with an annotated graph under the headline "It May Soon Be Time To Go Green" when featured in the January 2009 CANSLIM.net News (read here).
>>> The latest Featured Stock Update with an annotated graph appeared on 7/30/2009. click here.
|
|
C
A
S
I |
News |
Chart |
SEC
View all notes Alert
me of new notes
Company
Profile
|
HMSY
- NASDAQ
H M S Holdings Corp
COMPUTER SOFTWARE & SERVICES - Healthcare Information Service
|
$36.91
|
-1.09
|
559,574
N/A
|
2/20/2009
(Date
Featured) |
$34.08
(Price
Featured) |
PP = $38.38 |
G |
| MB = $40.30 |
Most Recent Note - 8/5/2009 4:15:09 PM
G - Loss today was its 3rd loss in the past 4 sessions with above average volume, closing further below its 50 DMA line, raising more concerns. Its 7/31/09 gap down and 50 DMA violation following its latest quarterly financial report. This high-ranked Commercial Services - Healthcare firm's prior highs in the $38 area are an important support level. A gap up gain on 6/16/09 with heavy volume triggered a technical buy signal.
>>> The latest Featured Stock Update with an annotated graph appeared on 8/4/2009. click here.
|
|
C
A
S
I |
News |
Chart |
SEC
View all notes Alert
me of new notes
Company
Profile
|
NTES
- NASDAQ
Netease Inc Adr
INTERNET - Internet Information Providers
|
$45.59
|
+0.31
|
2,228,766
N/A
|
7/17/2009
(Date
Featured) |
$39.29
(Price
Featured) |
PP = $38.74 |
G |
| MB = $40.68 |
Most Recent Note - 8/5/2009 4:17:11 PM
G - Gapped down today and then positively reversed, closing near its session high. Well above prior chart highs in the $38 area, an important support level to watch. A recent series of 10 consecutive gains was capped off with a considerable gain on 7/22/09 with very heavy volume that lifted it well above its max buy level. It got extended from its latest base. On 7/17/09 it broke out from a 5-week flat base with +44% above average volume behind its gain. First featured at $26.75 in the 3/31/09 CANSLIM.net Mid-Day Breakouts Report (read here). This high-ranked Chinese Internet - Content firm was also summarized in greater detail including an annotated graph in the April 2009 issue of CANSLIM.net News (read here).
>>> The latest Featured Stock Update with an annotated graph appeared on 7/23/2009. click here.
|
|
C
A
S
I |
News |
Chart |
SEC
View all notes Alert
me of new notes
Company
Profile
|
NVEC
- NASDAQ
N V E Corp
ELECTRONICS - Semiconductor - Specialized
|
$54.31
|
-1.94
|
80,538
N/A
|
3/13/2009
(Date
Featured) |
$33.85
(Price
Featured) |
PP = $49.60 |
G |
| MB = $52.08 |
Most Recent Note - 8/5/2009 4:17:59 PM
G -Still consolidating in a tight range since its 7/23/09 breakout. Patience may allow for shares to be accumulated on pullbacks, and prior highs are now an important support level. Featured in the 7/23/09 Mid-Day BreakOuts Report (read here) after it gapped up for a considerable gain on heavy volume following news of stronger sales revenues (+41%) and solid earnings increases for the quarter ended June 30, 2009. The technical action was described as a "breakaway gap" from a valid ascending base. Quarterly sales revenues in the 6 million dollar range are still rather minuscule, leaving concerns.
>>> The latest Featured Stock Update with an annotated graph appeared on 8/3/2009. click here.
|
|
C
A
S
I |
News |
Chart |
SEC
View all notes Alert
me of new notes
Company
Profile
|
PEGA
- NASDAQ
Pegasystems Inc
COMPUTER SOFTWARE & SERVICES - Business Software & Services
|
$31.84
|
+2.55
|
1,324,653
N/A
|
7/29/2009
(Date
Featured) |
$27.53
(Price
Featured) |
PP = $27.49 |
G |
| MB = $28.86 |
Most Recent Note - 8/5/2009 4:26:12 PM
G - Closed near its session high with a considerable gain today with nearly 5 times average volume following its strong Q2 earnings and raised guidance. Featured in in the 7/29/09 mid-day report (read here) during the course of its considerable gain on heavy volume 3 times its average for a new 52-week high. There were no news headlines to be found as this software firm triggered a technical buy signal by breaking out from a third stage, 8-week "double bottom" type base. The previously noted downturn in annual earnings (the A criteria) from 2003 to 2006 has been followed by a solid turn around and big earnings increases in '07 and '08, and Street expectations for '09 are calling for well above +25% growth.
>>> The latest Featured Stock Update with an annotated graph appeared on 7/29/2009. click here.
|
|
C
A
S
I |
News |
Chart |
SEC
View all notes Alert
me of new notes
Company
Profile
|
TNDM
- NASDAQ
Tandem Diabetes Care Inc
TELECOMMUNICATIONS - Wireless Communications
|
$32.18
|
-0.73
|
526,782
N/A
|
3/2/2009
(Date
Featured) |
$18.89
(Price
Featured) |
PP = $32.67 |
Y |
| MB = $34.30 |
Most Recent Note - 8/5/2009 4:32:39 PM
Y - Consolidating on lighter volume toward prior chart highs. Gapped up on 8/03/09 for a considerable gain on above average volume and a new all-time high. It is due to report earnings before Thursday's opening bell. A recent newspaper article suggested its June 29th high ($31.49) was "an adequate buy point." It rallied above that prior peak from a 5-week flat base. More significantly, it has also cleared its resistance level at its June 2nd high of $32.57. Color code was changed to yellow with new pivot point cited based upon its 52-week high plus ten cents. Subsequent deterioration below its 50 DMA average and recent lows would raise concerns and trigger sell signals. It traded up as much as +82.95% since first featured at $18.89 in the 3/02/09 Mid-Day BreakOuts Report (read here).
>>> The latest Featured Stock Update with an annotated graph appeared on 8/5/2009. click here.
|
|
C
A
S
I |
News |
Chart |
SEC
View all notes Alert
me of new notes
Company
Profile
|
UTA
-
|
$15.79
|
-1.04
|
1,294,031
N/A
|
7/28/2009
(Date
Featured) |
$12.87
(Price
Featured) |
PP = $12.70 |
G |
| MB = $13.34 |
Most Recent Note - 8/5/2009 4:35:39 PM
G - Negatively reversed after it another new 52-week high today, breaking a streak of 4 consecutive gains with above average volume, getting very extended above its "max buy" level. Prior chart highs in the $12 area are now an important support level to watch on pullbacks. Strong action prompted it to be featured in yellow with pivot point and max buy levels noted in the 7/28/09 mid-day breakouts report (read here), with additional analysis included in the after market update (read here). This Chinese provider of airline tickets and travel related services gapped up on 7/28/09, rising from a choppy 6-week base with a considerable gain on very heavy volume.
>>> The latest Featured Stock Update with an annotated graph appeared on 7/28/2009. click here.
|
|
C
A
S
I |
News |
Chart |
SEC
View all notes Alert
me of new notes
Company
Profile
|
|
|
|
THESE ARE NOT BUY RECOMMENDATIONS!
Comments contained in the body of this report are technical
opinions only. The material herein has been obtained
from sources believed to be reliable and accurate, however,
its accuracy and completeness cannot be guaranteed.
This site is not an investment advisor, hence it does
not endorse or recommend any securities or other investments.
Any recommendation contained in this report may not
be suitable for all investors and it is not to be deemed
an offer or solicitation on our part with respect to
the purchase or sale of any securities. All trademarks,
service marks and trade names appearing in this report
are the property of their respective owners, and are
likewise used for identification purposes only.
This report is a service available
only to active Paid Premium Members.
You may opt-out of receiving report notifications
at any time. Questions or comments may be submitted
by writing to Premium Membership Services 665 S.E. 10 Street, Suite 201 Deerfield Beach, FL 33441-5634 or by calling 1-800-965-8307
or 954-785-1121.
|
|
|

