You are not logged in.
This means you
CAN ONLY VIEW reports that were published prior to Monday, April 14, 2025.
You
MUST UPGRADE YOUR MEMBERSHIP if you want to see any current reports.
AFTER MARKET UPDATE - FRIDAY, AUGUST 3RD, 2012
Previous After Market Report Next After Market Report >>>
|
|
|
|
DOW |
+217.29 |
13,096.17 |
+1.69% |
|
Volume |
753,595,390 |
-9% |
|
Volume |
1,683,561,940 |
-6% |
|
NASDAQ |
+58.13 |
2,967.90 |
+2.00% |
|
Advancers |
2,537 |
81% |
|
Advancers |
1,929 |
74% |
|
S&P 500 |
+25.99 |
1,390.99 |
+1.90% |
|
Decliners |
516 |
16% |
|
Decliners |
570 |
22% |
|
Russell 2000 |
+19.88 |
788.48 |
+2.59% |
|
52 Wk Highs |
214 |
|
|
52 Wk Highs |
73 |
|
|
S&P 600 |
+11.11 |
444.17 |
+2.57% |
|
52 Wk Lows |
20 |
|
|
52 Wk Lows |
50 |
|
|
 |
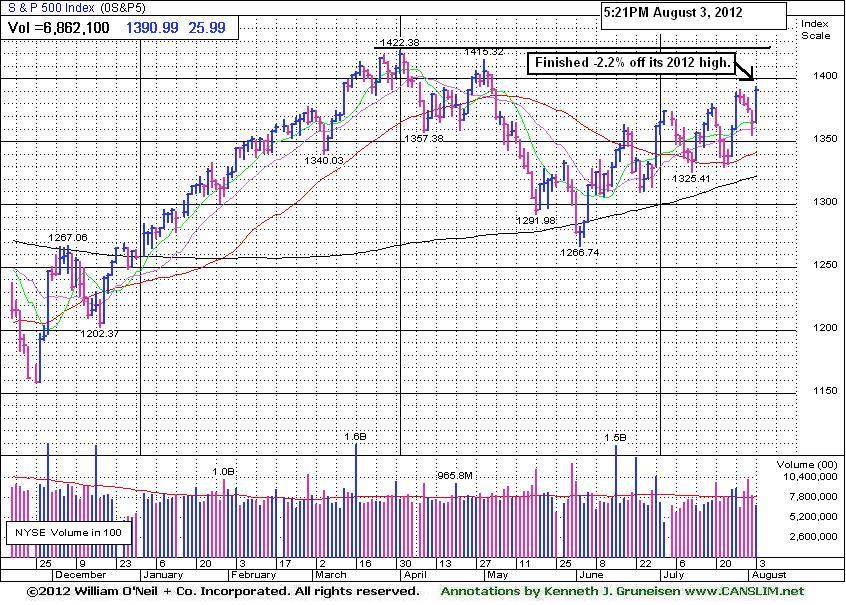
Major Averages Saved the Week With Friday's Gains on Lighter Volume
Kenneth J. Gruneisen - Passed the CAN SLIM® Master's Exam
For the week, the Dow Jones Industrial Average rose +0.2%, the S&P 500 Index gained +0.4%, and the tech-heavy Nasdaq Composite Index posted a +0.3% gain. On Friday's session the major averages ended with solid gains, however the volume totals behind the gains were reported lighter on the NYSE and on the Nasdaq exchange versus the prior session totals. Advancing issues led decliners by more than 4-1 on the NYSE and nearly 4-1 the Nasdaq exchange. The total number of new 52-week highs led new 52-week lows on the NYSE on the Nasdaq exchange. There were 55 high-ranked companies from the CANSLIM.net Leaders List made new 52-week highs and appeared on the CANSLIM.net BreakOuts Page, up from the prior session total of 18 stocks. There were gains for all of the 16 high-ranked companies currently included on the Featured Stocks Page, a substantially positive bias versus the broader market's breadth.
Stocks rallied from the opening bell following mostly positive economic reports. Looking at the data, payrolls expanded more than expected in July, while the unemployment rate ticked modestly higher to 8.3% from last month's 8.2%. In addition, the ISM non-manufacturing index unexpectedly rose to 52.6, topping expectations of a small decline in the index to 52.0.
All 10 sectors on the S&P finished higher, led by a rally in financial stocks. Shares of JP Morgan Chase & Co (JPM +2.62%) and Bank of America Corp (BAC +3.48%) rose. Energy stocks also showed strength as crude oil jumped $4.10 to $91.23 per barrel. Shares of Exxon Mobil Corp (XOM +1.94%) advanced . On the earnings front, Viacom Inc. (VIA +2.83%) and CBS Corp (CBS +6.11%) rose after both companies posted better-than-expected quarterly earnings. Kraft Foods Inc (KFT +4.03%) rose after topping estimates, and the social-networking company LinkedIn Corp (LNKD +16.04%) reported stronger-than-expected revenue and raised its full-year outlook.
Looking at fixed income, Treasuries are lower along the curve. The 10-year note was down 25/32 to yield 1.57% and the 30-year bond was off over 2 full points to yield 2.65%.
In terms of the M criteria, last week's gains brought technical improvements to the major indices' trend coupled with an expansion in leadership (stocks hitting new 52-week highs). Any sustainable rally requires a healthy crop of strong leaders hitting new 52-week highs.
Watch for an announcement soon via email concerning new monthly webcasts starting in August and a new "Market's Leading Groups" archives tab to be added on the Premium Member Homepage. These changes are aimed at satisfying member requests and improving the service. If you have questions, comments or suggestions please let us know via the inquiry form here. The most recent WEBCAST (Q2 2012) is available "ON DEMAND" - CLICK HERE.
PICTURED: The S&P 500 Index broke a streak of 4 consecutive losses with Friday's gain on lighter volume. It finished the week -2.2% off its 2012 high hit on 4/02/12.
|
 Kenneth J. Gruneisen started out as a licensed stockbroker in August 1987, a couple of months prior to the historic stock market crash that took the Dow Jones Industrial Average down -22.6% in a single day. He has published daily fact-based fundamental and technical analysis on high-ranked stocks online for two decades. Through FACTBASEDINVESTING.COM, Kenneth provides educational articles, news, market commentary, and other information regarding proven investment systems that work in good times and bad.
Comments contained in the body of this report are technical opinions only and are not necessarily those of Gruneisen Growth Corp. The material herein has been obtained from sources believed to be reliable and accurate, however, its accuracy and completeness cannot be guaranteed. Our firm, employees, and customers may effect transactions, including transactions contrary to any recommendation herein, or have positions in the securities mentioned herein or options with respect thereto. Any recommendation contained in this report may not be suitable for all investors and it is not to be deemed an offer or solicitation on our part with respect to the purchase or sale of any securities. |
|
 |
Broad Group Gains While Healthcare Group Lagged
Kenneth J. Gruneisen - Passed the CAN SLIM® Master's Exam
Financial stock provided a positive influence on Friday as the Bank Index ($BKX +3.07%) and Broker/Dealer Index ($XBD +4.74%) tallied large gains. The Networking Index ($NWX +2.96%), Semiconductor Index ($SOX +2.26%), Internet Index ($IIX +2.36%), and Biotechnology Index ($BTK +1.04%) ended unanimously higher. The Retail Index ($RLX +1.74%) was a positive influence, and strength in commodity-linked stocks boosted the Integrated Oil Index ($XOI +2.49%), Oil Services Index ($OSX +2.73%), and the Gold & Silver Index ($XAU +1.76%). Meanwhile, the Healthcare Index ($HMO -2.10%) was a clear laggard as it ended with a big loss.
Charts courtesy www.stockcharts.com
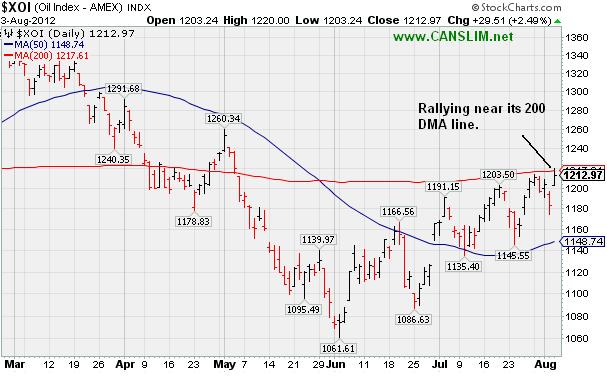
PICTURED: The Integrated Oil Index ($XOI +2.49%) rallied near its 200-day moving average (DMA) line,
| Oil Services |
$OSX |
221.75 |
+5.89 |
+2.73% |
+2.53% |
| Healthcare |
$HMO |
2,207.87 |
-47.43 |
-2.10% |
-3.23% |
| Integrated Oil |
$XOI |
1,212.97 |
+29.51 |
+2.49% |
-1.31% |
| Semiconductor |
$SOX |
390.10 |
+8.62 |
+2.26% |
+7.04% |
| Networking |
$NWX |
199.88 |
+5.75 |
+2.96% |
-7.10% |
| Internet |
$IIX |
305.21 |
+7.04 |
+2.36% |
+8.33% |
| Broker/Dealer |
$XBD |
78.44 |
+3.55 |
+4.74% |
-5.80% |
| Retail |
$RLX |
625.29 |
+10.67 |
+1.74% |
+19.51% |
| Gold & Silver |
$XAU |
150.33 |
+2.60 |
+1.76% |
-16.78% |
| Bank |
$BKX |
46.06 |
+1.37 |
+3.07% |
+16.96% |
| Biotech |
$BTK |
1,429.21 |
+14.77 |
+1.04% |
+30.95% |
|
|
|
 |
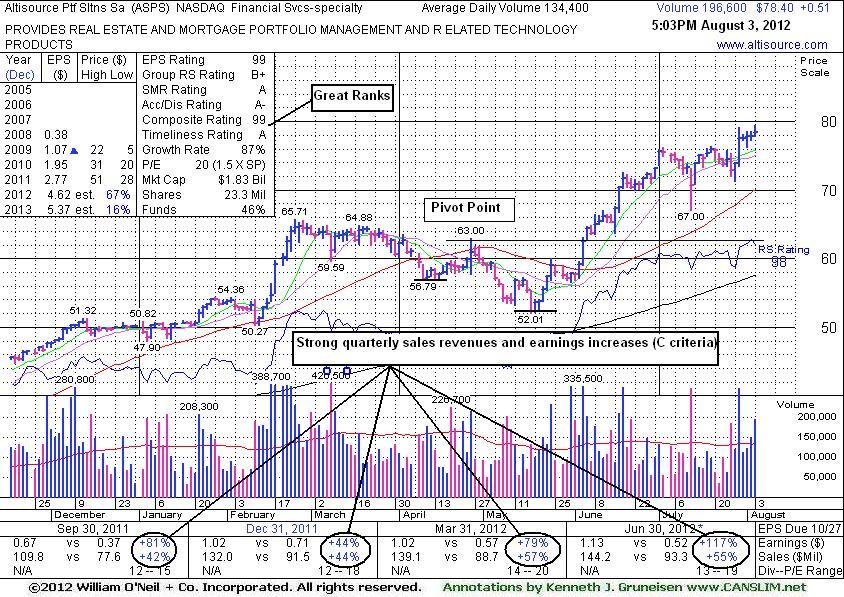
New High Close Leaves Leader Extended From Sound Base
Kenneth J. Gruneisen - Passed the CAN SLIM® Master's Exam
Altisource Portfolio Solutions Sa (ASPS +$0.51 or +0.65% to $78.40) finished at a new high close. It has been recently noted while holding its ground at its 52-week high, extended from its prior "double bottom" base. Its 50-day moving average (DMA) line defines near-term support to watch.
Since last shown in this FSU section on 7/03/12 with an annotated graph under the headline, "Extended From Prior Base, Stubbornly Holding its Ground", it reported earnings +117% on +55% sales revenues for the quarter ended June 30, 2012 versus the year ago period. Earnings increases have been above the +25% guideline, satisfying the C criteria, and backed by solid sales revenues increases in the 4 latest quarterly comparisons. This Luxembourg-based Financial Services firm's small supply (S criteria) of only 15.4 million shares in the public float can contribute to greater volatility in the event of institutional buying or selling. The number of top-rated funds owning its shares rose from 108 in Sep '11 to 151 in Jun '12., a reassuring sign concerning the I criteria. Its current Up/Down Volume Ratio of 1.7 is an unbiased indication its shares have been under accumulation over the past 50 days. Disciplined investors always avoid chasing extended stocks, and they limit losses by selling if ever any stock falls more than -7% from their purchase price.
|
|
|
Color Codes Explained :
Y - Better candidates highlighted by our
staff of experts.
G - Previously featured
in past reports as yellow but may no longer be buyable under the
guidelines.
***Last / Change / Volume data in this table is the closing quote data***
Symbol/Exchange
Company Name
Industry Group |
PRICE |
CHANGE
(%Change) |
Day High |
Volume
(% DAV)
(% 50 day avg vol) |
52 Wk Hi
% From Hi |
Featured
Date |
Price
Featured |
Pivot Featured |
|
Max Buy |
ALXN
-
NASDAQ
Alexion Pharmaceuticals
DRUGS - Drug Manufacturers - Other
|
$106.96
|
+4.66
4.56% |
$109.14
|
3,111,998
138.67% of 50 DAV
50 DAV is 2,244,200
|
$109.96
-2.73%
|
5/1/2012
|
$91.73
|
PP = $95.11
|
|
MB = $99.87
|
 Most Recent Note - 8/3/2012 11:57:15 AM
G - Gapped up today while consolidating well above chart support defined by its 50 DMA line (now $97.33). Reported earnings +62% on +48% sales revenues for the quarter ended June 30, 2012 versus the year ago period.
>>> The latest Featured Stock Update with an annotated graph appeared on 7/25/2012. Click here.
View all notes |
Alert me of new notes |
CANSLIM.net Company Profile |
SEC |
Zacks Reports |
StockTalk |
News |
Chart |
Request a new note
C
A N
S L
I M


|
ASPS
-
NASDAQ
Altisource Ptf Sltns Sa
REAL ESTATE - Property Management/Developmen
|
$78.40
|
+0.51
0.65% |
$79.40
|
196,681
146.34% of 50 DAV
50 DAV is 134,400
|
$79.20
-1.01%
|
6/5/2012
|
$60.01
|
PP = $63.00
|
|
MB = $66.15
|
Most Recent Note - 8/3/2012 5:44:26 PM
G - Posted a 6th consecutive gain for another new high close, getting more extended from its prior base. Recent low and its 50 DMA line define near-term support to watch. See the latest FSU analysis for more details and an annotated graph.
>>> The latest Featured Stock Update with an annotated graph appeared on 8/3/2012. Click here.
View all notes |
Alert me of new notes |
CANSLIM.net Company Profile |
SEC |
Zacks Reports |
StockTalk |
News |
Chart |
Request a new note
C
A N
S L
I M
|
CFNL
-
NASDAQ
Cardinal Financial Corp
BANKING - Regional - Southeast Banks
|
$12.50
|
+0.25
2.04% |
$12.71
|
80,789
103.98% of 50 DAV
50 DAV is 77,700
|
$13.21
-5.37%
|
7/20/2012
|
$12.85
|
PP = $12.41
|
|
MB = $13.03
|
Most Recent Note - 8/3/2012 12:56:18 PM
Y - Rebounding back above its pivot point with today's gain on light volume. Its 50 DMA line and prior chart highs define important near-term support to watch.
>>> The latest Featured Stock Update with an annotated graph appeared on 7/26/2012. Click here.
View all notes |
Alert me of new notes |
CANSLIM.net Company Profile |
SEC |
Zacks Reports |
StockTalk |
News |
Chart |
Request a new note
C
A N
S L
I M
|
CMCSA
-
NASDAQ
Comcast Corp Cl A
MEDIA - CATV Systems
|
$34.61
|
+0.49
1.44% |
$35.09
|
21,454,656
153.19% of 50 DAV
50 DAV is 14,005,100
|
$34.46
0.44%
|
6/11/2012
|
$29.94
|
PP = $30.98
|
|
MB = $32.53
|
Most Recent Note - 8/2/2012 12:50:06 PM
G - Hitting another new 52-week high today, getting more extended from its prior base. Gapped up on 8/01/12 after reporting earnings +19% on +6% sales revenues for the Jun '12 quarter, below the fact-based investment system's +25% minimum guideline for the C criteria, but better than Street expectations.
>>> The latest Featured Stock Update with an annotated graph appeared on 7/11/2012. Click here.
View all notes |
Alert me of new notes |
CANSLIM.net Company Profile |
SEC |
Zacks Reports |
StockTalk |
News |
Chart |
Request a new note
C
A N
S L
I M
|
DG
-
NYSE
Dollar General Corp
RETAIL - Discount, Variety Stores
|
$51.90
|
+0.43
0.84% |
$52.25
|
2,082,974
51.79% of 50 DAV
50 DAV is 4,021,800
|
$56.04
-7.39%
|
7/16/2012
|
$54.68
|
PP = $56.14
|
|
MB = $58.95
|
Most Recent Note - 8/1/2012 11:49:03 AM
G - Consolidating below its 50 DMA line today after recent distributional pressure, and its color code is changed to green. It did not register volume-driven gains above its new pivot point to trigger a new (or add-on) technical buy signal.
>>> The latest Featured Stock Update with an annotated graph appeared on 7/12/2012. Click here.
View all notes |
Alert me of new notes |
CANSLIM.net Company Profile |
SEC |
Zacks Reports |
StockTalk |
News |
Chart |
Request a new note
C
A N
S L
I M
|
Symbol/Exchange
Company Name
Industry Group |
PRICE |
CHANGE
(%Change) |
Day High |
Volume
(% DAV)
(% 50 day avg vol) |
52 Wk Hi
% From Hi |
Featured
Date |
Price
Featured |
Pivot Featured |
|
Max Buy |
ECPG
-
NASDAQ
Encore Capital Group Inc
FINANCIAL SERVICES - Credit Services
|
$29.80
|
+0.61
2.09% |
$30.47
|
273,607
190.14% of 50 DAV
50 DAV is 143,900
|
$30.35
-1.81%
|
8/3/2012
|
$29.91
|
PP = $30.45
|
|
MB = $31.97
|
Most Recent Note - 8/3/2012 12:18:18 PM
Y - Color code is changed to yellow with pivot point based on its 7/10/12 high while it appears poised to rally from a short "square box" base. A volume-driven gain and close above its pivot point may trigger a technical buy signal. Found support near its 50 DMA line this week and gains backed by above average volume helped it hit a new 52-week high. Reported earnings +41% on +27% sales revenues for the quarter ended June 30, 2012. That marks 3 consecutive quarterly comparisons with earnings increases above the +25% minimum guideline. This Financial Services - Misc firm's annual earnings (A criteria) history has been improving since a down turn in FY '08.
There are no Featured Stock Updates™ available for this stock at this time. You may request one by clicking the Request a New Note link below
View all notes |
Alert me of new notes |
CANSLIM.net Company Profile |
SEC |
Zacks Reports |
StockTalk |
News |
Chart |
Request a new note
C
A N
S L
I M
|
EXPE
-
NASDAQ
Expedia Inc
INTERNET - Internet Information Providers
|
$57.45
|
+0.65
1.14% |
$58.80
|
2,925,018
73.13% of 50 DAV
50 DAV is 3,999,700
|
$58.40
-1.62%
|
4/27/2012
|
$41.80
|
PP = $35.57
|
|
MB = $37.35
|
Most Recent Note - 8/3/2012 12:57:52 PM
G - Hit another new 52-week high today with a gain on light volume after stubbornly holding its ground for the past week. Reported earnings +24% on +14% sales revenues for the quarter ending June 30, 2012 versus the year ago period, just below the +25% minimum earnings guideline for buy candidates.
>>> The latest Featured Stock Update with an annotated graph appeared on 7/10/2012. Click here.
View all notes |
Alert me of new notes |
CANSLIM.net Company Profile |
SEC |
Zacks Reports |
StockTalk |
News |
Chart |
Request a new note
C
A N
S L
I M
|
GNC
-
NYSE
G N C Holdings Inc
RETAIL - Drug Stores
|
$39.21
|
+0.22
0.56% |
$39.81
|
1,936,423
77.17% of 50 DAV
50 DAV is 2,509,200
|
$42.70
-8.17%
|
6/29/2012
|
$39.20
|
PP = $40.00
|
|
MB = $42.00
|
Most Recent Note - 8/1/2012 11:38:21 AM
Y - Consolidating above its 50 DMA line today. Reported earnings +59% on +19% sales revenues for the quarter ended June 30, 2012 versus the year ago period, beating expectations, and it also raised guidance for FY '12.
>>> The latest Featured Stock Update with an annotated graph appeared on 7/5/2012. Click here.
View all notes |
Alert me of new notes |
CANSLIM.net Company Profile |
SEC |
Zacks Reports |
StockTalk |
News |
Chart |
Request a new note
C
A N
S L
I M
|
GPX
-
NYSE
G P Strategies Corp
DIVERSIFIED SERVICES - Education and Training Services
|
$19.19
|
+0.64
3.45% |
$20.08
|
283,387
500.68% of 50 DAV
50 DAV is 56,600
|
$19.00
1.00%
|
6/29/2012
|
$18.01
|
PP = $18.15
|
|
MB = $19.06
|
Most Recent Note - 8/3/2012 12:30:08 PM
G - Gapped up for a 2nd consecutive session and hit another new 52-week high today. Color code is changed to green after rallying above its "max buy" level. Reported earnings +41% on +19% sales revenues for the Jun '12 quarter. Found support near its 50 DMA line when recently consolidating.
>>> The latest Featured Stock Update with an annotated graph appeared on 7/6/2012. Click here.
View all notes |
Alert me of new notes |
CANSLIM.net Company Profile |
SEC |
Zacks Reports |
StockTalk |
News |
Chart |
Request a new note
C
A N
S L
I M
|
HMSY
-
NASDAQ
H M S Holdings Corp
COMPUTER SOFTWARE and SERVICES - Healthcare Information Service
|
$34.53
|
+0.40
1.17% |
$34.98
|
866,725
91.05% of 50 DAV
50 DAV is 951,900
|
$35.98
-4.03%
|
7/27/2012
|
$33.91
|
PP = $34.83
|
|
MB = $36.57
|
Most Recent Note - 8/1/2012 12:02:49 PM
Y - Consolidating after spiking to a new 52-week high. Finished below its pivot point on 7/27/12 while posting a considerable gain with more than 2 times average volume. Subsequent volume-driven gains above its pivot may trigger a technical buy signal.
>>> The latest Featured Stock Update with an annotated graph appeared on 7/27/2012. Click here.
View all notes |
Alert me of new notes |
CANSLIM.net Company Profile |
SEC |
Zacks Reports |
StockTalk |
News |
Chart |
Request a new note
C
A N
S L
I M
|
Symbol/Exchange
Company Name
Industry Group |
PRICE |
CHANGE
(%Change) |
Day High |
Volume
(% DAV)
(% 50 day avg vol) |
52 Wk Hi
% From Hi |
Featured
Date |
Price
Featured |
Pivot Featured |
|
Max Buy |
N
-
NYSE
Netsuite Inc
DIVERSIFIED SERVICES - Business/Management Services
|
$57.41
|
+3.45
6.39% |
$57.49
|
1,064,706
142.74% of 50 DAV
50 DAV is 745,900
|
$58.56
-1.96%
|
6/20/2012
|
$51.83
|
PP = $51.88
|
|
MB = $54.47
|
Most Recent Note - 8/3/2012 12:51:44 PM
G - Color code is changed to green after rallying back above its "max buy" level. Found support near its 50 DMA line when encountering recent distributional pressure.
>>> The latest Featured Stock Update with an annotated graph appeared on 7/19/2012. Click here.
View all notes |
Alert me of new notes |
CANSLIM.net Company Profile |
SEC |
Zacks Reports |
StockTalk |
News |
Chart |
Request a new note
C
A N
S L
I M
|
NSM
-
NYSE
Nationstar Mtg Hldgs Inc
FINANCIAL SERVICES - Credit Services
|
$24.15
|
+0.49
2.07% |
$24.34
|
753,426
91.57% of 50 DAV
50 DAV is 822,800
|
$25.11
-3.82%
|
6/27/2012
|
$20.29
|
PP = $20.46
|
|
MB = $21.48
|
Most Recent Note - 8/2/2012 3:57:33 PM
G - Considerable volume-driven gain today. It is not near a sound base, but consolidating above its "max buy" level after recently finding support above prior highs and its 50 DMA line in the $20 area. See the latest FSU analysis for more details and a new annotated graph.
>>> The latest Featured Stock Update with an annotated graph appeared on 8/1/2012. Click here.
View all notes |
Alert me of new notes |
CANSLIM.net Company Profile |
SEC |
Zacks Reports |
StockTalk |
News |
Chart |
Request a new note
C
A N
S L
I M
|
RNF
-
NYSE
Rentech Nitrogen Ptnr Lp
CHEMICALS - Agricultural Chemicals
|
$30.10
|
+0.95
3.26% |
$30.30
|
438,319
123.09% of 50 DAV
50 DAV is 356,100
|
$31.34
-3.96%
|
7/27/2012
|
$29.58
|
PP = $30.60
|
|
MB = $32.13
|
Most Recent Note - 8/3/2012 12:54:03 PM
Y - Churning above average volume this week near its 52-week high but it has encountered resistance near prior highs since highlighted yellow again in the 7/27/12 mid-day report.
>>> The latest Featured Stock Update with an annotated graph appeared on 7/31/2012. Click here.
View all notes |
Alert me of new notes |
CANSLIM.net Company Profile |
SEC |
Zacks Reports |
StockTalk |
News |
Chart |
Request a new note
C
A N
S L
I M
|
SWI
-
NYSE
Solarwinds Inc
COMPUTER SOFTWARE and SERVICES - Application Software
|
$54.25
|
+1.14
2.15% |
$54.67
|
657,877
51.44% of 50 DAV
50 DAV is 1,278,900
|
$53.97
0.52%
|
7/25/2012
|
$47.82
|
PP = $47.89
|
|
MB = $50.28
|
Most Recent Note - 8/1/2012 6:17:48 PM
G - Hovering near its all-time high. Prior highs in the $48 area define initial support to watch on pullbacks.
>>> The latest Featured Stock Update with an annotated graph appeared on 7/30/2012. Click here.
View all notes |
Alert me of new notes |
CANSLIM.net Company Profile |
SEC |
Zacks Reports |
StockTalk |
News |
Chart |
Request a new note
C
A N
S L
I M
|
TDG
-
NYSE
Transdigm Group Inc
AEROSPACE/DEFENSE - Aerospace/Defense Products and; Services
|
$124.22
|
+2.99
2.47% |
$124.89
|
218,500
45.65% of 50 DAV
50 DAV is 478,600
|
$136.34
-8.89%
|
6/18/2012
|
$127.00
|
PP = $132.79
|
|
MB = $139.43
|
Most Recent Note - 8/3/2012 12:59:18 PM
G - Small gap up and gain today on light volume. A rebound above its 50 DMA line is needed for its technical stance and outlook to improve. Meanwhile, recent lows in the $117-118 are define near-term support above its 200 DMA line.
>>> The latest Featured Stock Update with an annotated graph appeared on 7/18/2012. Click here.
View all notes |
Alert me of new notes |
CANSLIM.net Company Profile |
SEC |
Zacks Reports |
StockTalk |
News |
Chart |
Request a new note
C
A N
S L
I M
|
Symbol/Exchange
Company Name
Industry Group |
PRICE |
CHANGE
(%Change) |
Day High |
Volume
(% DAV)
(% 50 day avg vol) |
52 Wk Hi
% From Hi |
Featured
Date |
Price
Featured |
Pivot Featured |
|
Max Buy |
VSI
-
NYSE
Vitamin Shoppe Inc
SPECIALTY RETAIL - Specialty Retail, Other
|
$56.43
|
+0.48
0.86% |
$57.08
|
300,837
85.05% of 50 DAV
50 DAV is 353,700
|
$58.88
-4.16%
|
6/29/2012
|
$54.93
|
PP = $55.03
|
|
MB = $57.78
|
Most Recent Note - 8/2/2012 4:41:12 PM
Y - Its 50 DMA line and upward trendline define near-term chart support to watch. Due to report financial results before the market open on Tuesday, August 7, 2012. See the latest FSU analysis for more details and a new annotated graph.
>>> The latest Featured Stock Update with an annotated graph appeared on 8/2/2012. Click here.
View all notes |
Alert me of new notes |
CANSLIM.net Company Profile |
SEC |
Zacks Reports |
StockTalk |
News |
Chart |
Request a new note
C
A N
S L
I M
|
|
|
|
THESE ARE NOT BUY RECOMMENDATIONS!
Comments contained in the body of this report are technical
opinions only. The material herein has been obtained
from sources believed to be reliable and accurate, however,
its accuracy and completeness cannot be guaranteed.
This site is not an investment advisor, hence it does
not endorse or recommend any securities or other investments.
Any recommendation contained in this report may not
be suitable for all investors and it is not to be deemed
an offer or solicitation on our part with respect to
the purchase or sale of any securities. All trademarks,
service marks and trade names appearing in this report
are the property of their respective owners, and are
likewise used for identification purposes only.
This report is a service available
only to active Paid Premium Members.
You may opt-out of receiving report notifications
at any time. Questions or comments may be submitted
by writing to Premium Membership Services 665 S.E. 10 Street, Suite 201 Deerfield Beach, FL 33441-5634 or by calling 1-800-965-8307
or 954-785-1121.
|
|
|

