You are not logged in.
This means you
CAN ONLY VIEW reports that were published prior to Monday, April 14, 2025.
You
MUST UPGRADE YOUR MEMBERSHIP if you want to see any current reports.
AFTER MARKET UPDATE - FRIDAY, AUGUST 2ND, 2013
Previous After Market Report Next After Market Report >>>
|
|
|
|
DOW |
+30.34 |
15,658.36 |
+0.19% |
|
Volume |
681,525,200 |
-15% |
|
Volume |
1,637,839,180 |
-9% |
|
NASDAQ |
+13.85 |
3,689.59 |
+0.38% |
|
Advancers |
1,527 |
49% |
|
Advancers |
1,173 |
45% |
|
S&P 500 |
+2.80 |
1,709.67 |
+0.16% |
|
Decliners |
1,469 |
47% |
|
Decliners |
1,328 |
51% |
|
Russell 2000 |
-0.02 |
1,059.86 |
-0.00% |
|
52 Wk Highs |
208 |
|
|
52 Wk Highs |
236 |
|
|
S&P 600 |
-0.15 |
595.68 |
-0.03% |
|
52 Wk Lows |
55 |
|
|
52 Wk Lows |
19 |
|
|
 |
Major Averages Start August Rallying to New Highs
Kenneth J. Gruneisen - Passed the CAN SLIM® Master's Exam
For the week, the Dow Jones Industrial Average was up +0.6%, the S&P 500 Index gained +1.1% and the Nasdaq Composite Index advanced +2.1%. The indices eked out minor gains on Friday with volume totals reported lighter than the prior session totals on the Nasdaq exchange and on the NYSE. Advancers narrowly outnumbered decliners on the NYSE, but decliners outnumbered advancers by a 7-6 margin on the Nasdaq exchange. There were 75 high-ranked companies from the CANSLIM.net Leaders List made new 52-week highs and appeared on the CANSLIM.net BreakOuts Page, down from the prior session total of 127 stocks. The list of stocks hitting new 52-week highs contracted yet still solidly and outnumbered new 52-week lows on both the NYSE and the Nasdaq exchange. There were gains for 9 of the 16 high-ranked companies currently included on the Featured Stocks Page.
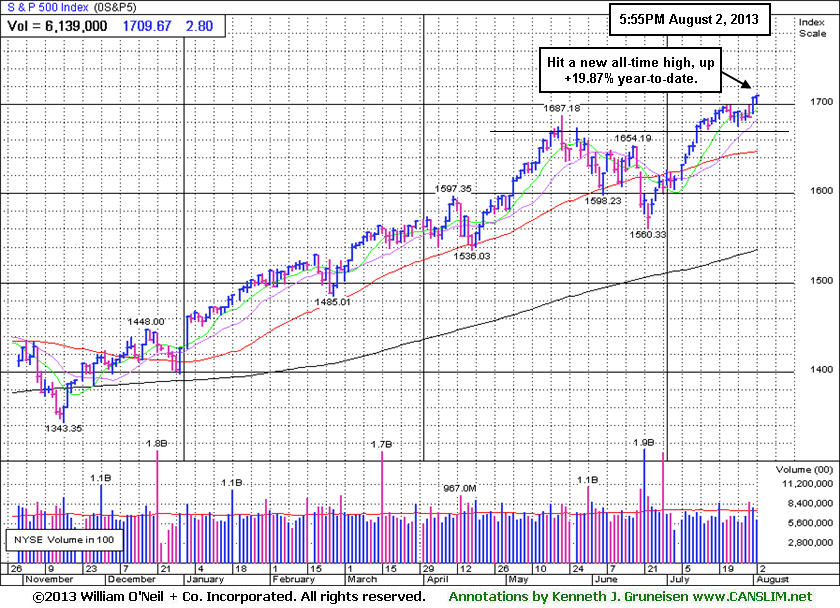
The Dow hit an all-time high, rising 30 points to 15,658. The S&P 500 Index gained 3 points to close at a record level of 1,709. The Nasdaq Composite Index climbed 14 points to 3,689. The major averages erased early losses to close in positive territory as investors weighed the fresh employment report. Before the open, non-farm payrolls rose 162,000 in July, below the consensus estimate of 185,000. The unemployment rate fell to 7.4% from 7.6%. Additional economic readings showed consumer spending increased +0.5% and factory orders grew +1.5% in June.
Consumer discretionary was the best performing group. Shares of Viacom Inc (VIA +6.53%) rallied after the media company increased its share buyback program to $20 billion. Dell Inc (DELL +5.6%) rose as a group led by founder Michael Dell improved their offer to acquire the PC maker. Shares of American International Group Inc (AIG +2.68%) rose after the insurer declared its first quarterly dividend since 2008. Energy was the worst performing sector with Chevron Corp (CVX -1.18%) falling after posting disappointing quarterly results.
Treasuries were higher with the 10-year note advancing 28/32 to yield 2.60%.
The market (M criteria) has flashed substantial strength and leadership. Now in a confirmed rally, odds are considered favorable for investors' success with new buying efforts. Investors should be disciplined and selective while looking to be proactive and focused exclusively on the individual leaders best matching the winning models of the fact-based investment system. Study the companies on the CANSLIM.net Featured Stocks Page - a page showing the most action-worthy candidates' latest notes and links to additional resources including detailed analysis with data-packed graphs which are annotated by a Certified expert. The Premium Member Homepage - includes "dynamic archives" to all prior pay reports published. Watch for an announcement via email concerning the next WEBCAST.
PICTURED: The benchmark S&P 500 Index is up +19.87% year-to-date and hitting new all-time highs.
|
 Kenneth J. Gruneisen started out as a licensed stockbroker in August 1987, a couple of months prior to the historic stock market crash that took the Dow Jones Industrial Average down -22.6% in a single day. He has published daily fact-based fundamental and technical analysis on high-ranked stocks online for two decades. Through FACTBASEDINVESTING.COM, Kenneth provides educational articles, news, market commentary, and other information regarding proven investment systems that work in good times and bad.
Comments contained in the body of this report are technical opinions only and are not necessarily those of Gruneisen Growth Corp. The material herein has been obtained from sources believed to be reliable and accurate, however, its accuracy and completeness cannot be guaranteed. Our firm, employees, and customers may effect transactions, including transactions contrary to any recommendation herein, or have positions in the securities mentioned herein or options with respect thereto. Any recommendation contained in this report may not be suitable for all investors and it is not to be deemed an offer or solicitation on our part with respect to the purchase or sale of any securities. |
|
 |
Retail and Financial Indexes Underpin Major Averages
Kenneth J. Gruneisen - Passed the CAN SLIM® Master's Exam
The Retail Index ($RLX +0.40%) underpinned the major averages on Friday and limited the damage of a widespread but modest pullback. Financial shares were mixed as the Broker/Dealer Index ($XBD +0.21%) posted a tiny gain while the Bank Index ($BKX -0.13%) edged lower. Energy-related shares were mixed as the Oil Services Index ($OSX +0.27%) posted a small gain and the Integrated Oil Index ($XOI -0.64%) fell. Defensive groups had a negative bias as the Healthcare Index ($HMO -0.32%) edged lower and the Gold & Silver Index ($XAU -2.00%) was a standout decliner.
Charts courtesy www.stockcharts.com
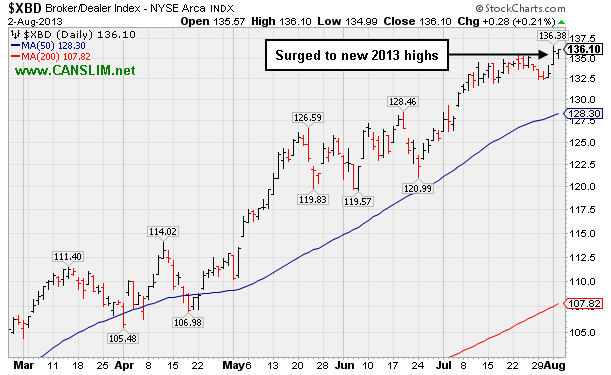
PICTURED: The Broker/Dealer Index ($XBD +0.21%) surged to new 2013 highs at the start of August following a +4.3% gain in July. Strength in financial stocks is a reassuring leading indicator that bodes well for the broader market outlook.
|
|
|
 |
Facing Some Resistance While Rallying With Volume
Kenneth J. Gruneisen - Passed the CAN SLIM® Master's Exam
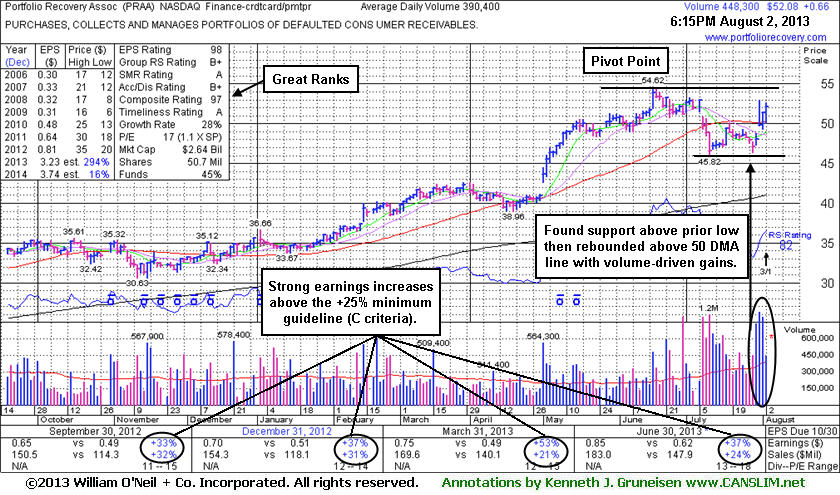
Portfolio Recovery Assoc (PRAA +$0.65 or +1.27% to $52.08) edged higher and rallied further above its 50-day moving average (DMA) line with volume-driven gains but disciplined investors will note that it has not triggered a proper technical buy signal since returning to the Featured Stocks list. It was highlighted in yellow with new pivot point cited based on its 6/17/13 high plus 10 cents in Wednesday's mid-day report (read here) yet noted with caution - "It faces some resistance and needs additional volume-driven gains to trigger a proper new technical buy signal."
Do not be confused by 3:1 share split impacting prices today (pivot point, max buy price have been adjusted accordingly). Recently it reported earnings +37% on +24% sales revenues for the Jun '13 quarter, continuing its record of strong earnings increases above the +25% minimum guideline (C criteria). It halted its slide above prior lows and showed resilience since dropped from the Featured Stocks list on 7/10/13 due to technical weakness. Disciplined investors always limit losses if any stock falls more than -7% from their purchase price. Patient investors know that if or when strength returns any previously sold stock can always be bought back. Members are often alerted to continue watching high-ranked leaders for a new base or secondary buy point to possibly develop and be noted in the weeks ahead.
This high-ranked leader from the Finance - Credit Card/Payment Processing industry group has strong fundamentals and has earned great ranks. The number of top-rated funds owning its shares rose from 308 in Jun '12 to 420 in Jun '13, a reassuring sign concerning the I criteria.
 |
|
|
Color Codes Explained :
Y - Better candidates highlighted by our
staff of experts.
G - Previously featured
in past reports as yellow but may no longer be buyable under the
guidelines.
***Last / Change / Volume data in this table is the closing quote data***
Symbol/Exchange
Company Name
Industry Group |
PRICE |
CHANGE
(%Change) |
Day High |
Volume
(% DAV)
(% 50 day avg vol) |
52 Wk Hi
% From Hi |
Featured
Date |
Price
Featured |
Pivot Featured |
|
Max Buy |
AMBA
-
NASDAQ
Ambarella Inc
ELECTRONICS - Semiconductor - Specialized
|
$16.75
|
+0.72
4.49% |
$16.79
|
955,086
79.53% of 50 DAV
50 DAV is 1,200,900
|
$19.44
-13.84%
|
7/15/2013
|
$17.87
|
PP = $18.68
|
|
MB = $19.61
|
 Most Recent Note - 8/2/2013 6:58:11 PM
G - Posted a gain on lighter volume, rebounding toward its 50 DMA line which may act as resistance following the technical violation which triggered a sell signal earlier this week. A prompt rebound above that important short-term average would help its outlook improve.
>>> The latest Featured Stock Update with an annotated graph appeared on 7/17/2013. Click here.
View all notes |
Alert me of new notes |
CANSLIM.net Company Profile |
SEC |
Zacks Reports |
StockTalk |
News |
Chart |
Request a new note
C
A N
S L
I M


|
CELG
-
NASDAQ
Celgene Corp
DRUGS - Drug Manufacturers - Major
|
$147.35
|
-1.44
-0.97% |
$149.00
|
2,330,045
80.07% of 50 DAV
50 DAV is 2,910,000
|
$149.92
-1.71%
|
7/11/2013
|
$133.25
|
PP = $131.92
|
|
MB = $138.52
|
Most Recent Note - 7/29/2013 6:00:46 PM
G - Extended from its prior base after last week's volume-driven gains, it is now consolidating above prior highs defining initial support in the $131 area. See the latest FSU analysis for more details and a new annotated graph.
>>> The latest Featured Stock Update with an annotated graph appeared on 7/29/2013. Click here.
View all notes |
Alert me of new notes |
CANSLIM.net Company Profile |
SEC |
Zacks Reports |
StockTalk |
News |
Chart |
Request a new note
C
A N
S L
I M
|
FLT
-
NYSE
Fleetcor Technologies
DIVERSIFIED SERVICES - Business/Management Services
|
$98.44
|
+6.59
7.17% |
$100.87
|
1,685,431
238.12% of 50 DAV
50 DAV is 707,800
|
$92.94
5.92%
|
5/29/2013
|
$86.02
|
PP = $85.66
|
|
MB = $89.94
|
Most Recent Note - 8/2/2013 12:47:14 PM
G- Reported earnings +37% on +29% sales revenues for the Jun '13 quarter. Finally making meaningful progress after forming a new late-stage base, it finished strong on the prior session and gapped up today hitting new 52-week and all-time highs with a 3rd consecutive gain backed by above average volume. Found support near its 50 DMA during its latest consolidation.
>>> The latest Featured Stock Update with an annotated graph appeared on 7/18/2013. Click here.
View all notes |
Alert me of new notes |
CANSLIM.net Company Profile |
SEC |
Zacks Reports |
StockTalk |
News |
Chart |
Request a new note
C
A N
S L
I M
|
GNRC
-
NYSE
Generac Hldgs Inc
CONSUMER DURABLES - Electronic Equipment
|
$42.24
|
-1.21
-2.78% |
$42.50
|
3,327,640
288.81% of 50 DAV
50 DAV is 1,152,200
|
$44.30
-4.65%
|
7/30/2013
|
$42.60
|
PP = $42.10
|
|
MB = $44.21
|
Most Recent Note - 8/2/2013 12:49:56 PM
Y - Gapped down today after pricing a Secondary Offering. It recently rallied from an advanced "3-weeks tight" base. Disciplined investors always limit losses by selling if any stock falls more than -7% from its purchase price.
>>> The latest Featured Stock Update with an annotated graph appeared on 7/30/2013. Click here.
View all notes |
Alert me of new notes |
CANSLIM.net Company Profile |
SEC |
Zacks Reports |
StockTalk |
News |
Chart |
Request a new note
C
A N
S L
I M
|
LOPE
-
NASDAQ
Grand Canyon Education
DIVERSIFIED SERVICES - Education and; Training Services
|
$35.20
|
+0.88
2.56% |
$35.36
|
406,783
90.96% of 50 DAV
50 DAV is 447,200
|
$37.17
-5.30%
|
6/19/2013
|
$31.47
|
PP = $34.17
|
|
MB = $35.88
|
Most Recent Note - 7/30/2013 6:37:23 PM
Y - Reported its second quarter results following today's market close after enduring mild distributional pressure near its 52-week high. Finished still perched above its pivot point and below its "max buy" level. Prior highs in the $34 area define support along with its 50 DMA line.
>>> The latest Featured Stock Update with an annotated graph appeared on 7/19/2013. Click here.
View all notes |
Alert me of new notes |
CANSLIM.net Company Profile |
SEC |
Zacks Reports |
StockTalk |
News |
Chart |
Request a new note
C
A N
S L
I M
|
Symbol/Exchange
Company Name
Industry Group |
PRICE |
CHANGE
(%Change) |
Day High |
Volume
(% DAV)
(% 50 day avg vol) |
52 Wk Hi
% From Hi |
Featured
Date |
Price
Featured |
Pivot Featured |
|
Max Buy |
PCLN
-
NASDAQ
Priceline.Com Inc
INTERNET - Internet Software and Services
|
$908.36
|
+4.01
0.44% |
$913.82
|
673,780
100.03% of 50 DAV
50 DAV is 673,600
|
$926.40
-1.95%
|
7/8/2013
|
$878.28
|
PP = $847.43
|
|
MB = $889.80
|
Most Recent Note - 7/29/2013 1:52:10 PM
G - Due to report earnings August 8th. Extended from its prior base, enduring distributional pressure while consolidating in a tight range near its high. Prior highs in the $847 area define support to watch on pullbacks.
>>> The latest Featured Stock Update with an annotated graph appeared on 7/25/2013. Click here.
View all notes |
Alert me of new notes |
CANSLIM.net Company Profile |
SEC |
Zacks Reports |
StockTalk |
News |
Chart |
Request a new note
C
A N
S L
I M
|
PRAA
-
NASDAQ
Portfolio Recovery Assoc
DIVERSIFIED SERVICES - Business/Management Services
|
$52.08
|
+0.65
1.27% |
$52.66
|
448,315
114.83% of 50 DAV
50 DAV is 390,400
|
$54.62
-4.66%
|
7/31/2013
|
$51.43
|
PP = $54.72
|
|
MB = $57.46
|
Most Recent Note - 8/2/2013 8:52:21 AM
Y - Do not be confused by 3:1 share split impacting prices today (pivot point, max buy price have been adjusted accordingly). It rallied above its 50 DMA line with a 3rd consecutive volume-driven gain but has not triggered a proper technical buy signal since returning to the Featured Stocks list highlighted in yellow with new pivot point cited based on its 6/17/13 high plus 10 cents in Wednesday's mid-day report (read here) with caution - "It faces some resistance and needs additional volume-driven gains to trigger a proper new technical buy signal. Reported earnings +37% on +24% sales revenues for the Jun '13 quarter. Showing resilience since dropped from the Featured Stocks list on 7/10/13 due to technical weakness."
>>> The latest Featured Stock Update with an annotated graph appeared on 8/2/2013. Click here.
View all notes |
Alert me of new notes |
CANSLIM.net Company Profile |
SEC |
Zacks Reports |
StockTalk |
News |
Chart |
Request a new note
C
A N
S L
I M
|
PRLB
-
NYSE
Proto Labs Inc
MANUFACTURING - Small Tools and Accessories
|
$68.59
|
+3.48
5.34% |
$68.60
|
523,124
116.85% of 50 DAV
50 DAV is 447,700
|
$69.22
-0.90%
|
7/29/2013
|
$64.86
|
PP = $67.50
|
|
MB = $70.88
|
Most Recent Note - 8/2/2013 7:00:15 PM
Y - Rallied with above average for a best-ever close. Its 50 DMA line defines important support just below recent lows in the $61 area. Reported earnings +50% on +33% for the Jun '13 quarter, continuing its history of strong earnings increases above the +25% minimum guideline (C criteria).
>>> The latest Featured Stock Update with an annotated graph appeared on 7/15/2013. Click here.
View all notes |
Alert me of new notes |
CANSLIM.net Company Profile |
SEC |
Zacks Reports |
StockTalk |
News |
Chart |
Request a new note
C
A N
S L
I M
|
QCOR
-
NASDAQ
Questcor Pharmaceuticals
DRUGS - Biotechnology
|
$65.85
|
-4.20
-6.00% |
$70.55
|
3,971,926
191.48% of 50 DAV
50 DAV is 2,074,300
|
$70.24
-6.25%
|
7/31/2013
|
$66.46
|
PP = $59.01
|
|
MB = $61.96
|
Most Recent Note - 8/2/2013 1:16:39 PM
G - Retreating from another new high today after an impressive streak of volume-driven gains. Quickly got extended beyond its "max buy" level after highlighted in yellow in the 7/31/13 mid-day report (read here) with a weekly graph which illustrated its powerful long-term breakout to new highs. See the latest FSU analysis for more details and an annotated daily graph.
>>> The latest Featured Stock Update with an annotated graph appeared on 8/1/2013. Click here.
View all notes |
Alert me of new notes |
CANSLIM.net Company Profile |
SEC |
Zacks Reports |
StockTalk |
News |
Chart |
Request a new note
C
A N
S L
I M
|
RRTS
-
NYSE
Roadrunner Trans Systems
TRANSPORTATION - Air Delivery and Freight Service
|
$30.49
|
-0.26
-0.85% |
$30.81
|
81,823
57.78% of 50 DAV
50 DAV is 141,600
|
$30.98
-1.59%
|
4/3/2013
|
$22.77
|
PP = $23.75
|
|
MB = $24.94
|
Most Recent Note - 7/29/2013 1:34:59 PM
G - Still perched near its 52-week high with volume totals cooling while consolidating in a tight trading range for the past few weeks. Reports results for the Jun '13 quarter on Wednesday, July 31, 2013 after market close.
>>> The latest Featured Stock Update with an annotated graph appeared on 7/22/2013. Click here.
View all notes |
Alert me of new notes |
CANSLIM.net Company Profile |
SEC |
Zacks Reports |
StockTalk |
News |
Chart |
Request a new note
C
A N
S L
I M
|
Symbol/Exchange
Company Name
Industry Group |
PRICE |
CHANGE
(%Change) |
Day High |
Volume
(% DAV)
(% 50 day avg vol) |
52 Wk Hi
% From Hi |
Featured
Date |
Price
Featured |
Pivot Featured |
|
Max Buy |
SFUN
-
NYSE
Soufun Hldgs Ltd Ads A
INTERNET - Internet Information Providers
|
$34.87
|
-0.30
-0.85% |
$35.34
|
403,904
115.57% of 50 DAV
50 DAV is 349,500
|
$36.43
-4.28%
|
7/16/2013
|
$29.54
|
PP = $27.90
|
|
MB = $29.30
|
Most Recent Note - 8/1/2013 12:55:58 PM
G - Extended from its latest base following volume-driven gains. Prior highs in the $28-29 area define initial support to watch.
>>> The latest Featured Stock Update with an annotated graph appeared on 7/16/2013. Click here.
View all notes |
Alert me of new notes |
CANSLIM.net Company Profile |
SEC |
Zacks Reports |
StockTalk |
News |
Chart |
Request a new note
C
A N
S L
I M
|
SSNC
-
NASDAQ
S S & C Technologies
COMPUTER SOFTWARE and SERVICES - Application Software
|
$36.98
|
+0.87
2.41% |
$38.80
|
659,578
174.95% of 50 DAV
50 DAV is 377,000
|
$38.47
-3.87%
|
7/11/2013
|
$35.80
|
PP = $34.54
|
|
MB = $36.27
|
Most Recent Note - 8/2/2013 10:11:54 AM
G - Gapped up today hitting a new 52-week high after reporting earnings +45% on +47% sales revenues for the Jun '13 quarter. Color code is changed to green while blasting above its "max buy" level. During its recent consolidation it stayed well above prior highs in the $34 area now coinciding with its 50 DMA line and defining important near-term support.
>>> The latest Featured Stock Update with an annotated graph appeared on 7/12/2013. Click here.
View all notes |
Alert me of new notes |
CANSLIM.net Company Profile |
SEC |
Zacks Reports |
StockTalk |
News |
Chart |
Request a new note
C
A N
S L
I M
|
SSYS
-
NASDAQ
Stratasys Ltd
COMPUTER HARDWARE - Computer Peripherals
|
$90.00
|
-0.40
-0.44% |
$91.50
|
565,011
75.72% of 50 DAV
50 DAV is 746,200
|
$96.44
-6.68%
|
7/8/2013
|
$91.44
|
PP = $95.00
|
|
MB = $99.75
|
Most Recent Note - 7/30/2013 6:33:40 PM
Y - Encountered more distributional pressure and suffered a loss on higher volume while slumping near its 50 DMA line again. More damaging losses could raise greater concerns and trigger worrisome technical sell signals.
>>> The latest Featured Stock Update with an annotated graph appeared on 7/24/2013. Click here.
View all notes |
Alert me of new notes |
CANSLIM.net Company Profile |
SEC |
Zacks Reports |
StockTalk |
News |
Chart |
Request a new note
C
A N
S L
I M
|
STMP
-
NASDAQ
Stamps.Com Inc
INTERNET - Internet Software and Services
|
$42.56
|
-1.07
-2.45% |
$44.02
|
143,544
100.38% of 50 DAV
50 DAV is 143,000
|
$46.47
-8.41%
|
7/31/2013
|
$40.00
|
PP = $42.98
|
|
MB = $45.13
|
Most Recent Note - 8/1/2013 1:00:25 PM
Y - Reported earnings +50% on +14% sales revenues for the Jun '13 quarter, continuing its strong earnings history. Gapped up today for a considerable volume-driven gain and a new 52-week high, trading near the "max buy" level of the valid secondary buy point cited following its successful test of support. See the latest FSU analysis for more details and an annotated graph.
>>> The latest Featured Stock Update with an annotated graph appeared on 7/31/2013. Click here.
View all notes |
Alert me of new notes |
CANSLIM.net Company Profile |
SEC |
Zacks Reports |
StockTalk |
News |
Chart |
Request a new note
C
A N
S L
I M
|
VRX
-
NYSE
Valeant Pharmaceuticals
DRUGS - Drug Manufacturers - Other
|
$96.45
|
+0.41
0.43% |
$96.95
|
887,028
43.75% of 50 DAV
50 DAV is 2,027,600
|
$96.43
0.02%
|
4/30/2013
|
$60.24
|
PP = $76.66
|
|
MB = $80.49
|
Most Recent Note - 7/29/2013 1:37:46 PM
Y- Volume totals have still been cooling while consolidating near its 52-week high after completing a new Public Offering on 6/18/13 following recent M&A news. Formed a cup-with-handle base over the past 9 weeks, however no new pivot point has been cited while members were repeatedly cautioned - "Concerns were raised by its Mar '13 earnings report with only a +14% earnings increase, below the +25% minimum guideline (C criteria) for buy candidates."
>>> The latest Featured Stock Update with an annotated graph appeared on 7/23/2013. Click here.
View all notes |
Alert me of new notes |
CANSLIM.net Company Profile |
SEC |
Zacks Reports |
StockTalk |
News |
Chart |
Request a new note
C
A N
S L
I M
|
Symbol/Exchange
Company Name
Industry Group |
PRICE |
CHANGE
(%Change) |
Day High |
Volume
(% DAV)
(% 50 day avg vol) |
52 Wk Hi
% From Hi |
Featured
Date |
Price
Featured |
Pivot Featured |
|
Max Buy |
YNDX
-
NASDAQ
Yandex N V Class A
INTERNET - Internet Information Providers
|
$33.78
|
+0.06
0.18% |
$33.85
|
2,444,193
97.29% of 50 DAV
50 DAV is 2,512,400
|
$34.27
-1.43%
|
7/10/2013
|
$29.29
|
PP = $29.59
|
|
MB = $31.07
|
Most Recent Note - 7/29/2013 1:45:38 PM
G - Retreating form its 52-week high today after getting extended following 2 consecutive volume-driven gains into new high territory. Prior highs in the $28-29 area define near-term support to watch.
>>> The latest Featured Stock Update with an annotated graph appeared on 7/26/2013. Click here.
View all notes |
Alert me of new notes |
CANSLIM.net Company Profile |
SEC |
Zacks Reports |
StockTalk |
News |
Chart |
Request a new note
C
A N
S L
I M
|
|
|
|
THESE ARE NOT BUY RECOMMENDATIONS!
Comments contained in the body of this report are technical
opinions only. The material herein has been obtained
from sources believed to be reliable and accurate, however,
its accuracy and completeness cannot be guaranteed.
This site is not an investment advisor, hence it does
not endorse or recommend any securities or other investments.
Any recommendation contained in this report may not
be suitable for all investors and it is not to be deemed
an offer or solicitation on our part with respect to
the purchase or sale of any securities. All trademarks,
service marks and trade names appearing in this report
are the property of their respective owners, and are
likewise used for identification purposes only.
This report is a service available
only to active Paid Premium Members.
You may opt-out of receiving report notifications
at any time. Questions or comments may be submitted
by writing to Premium Membership Services 665 S.E. 10 Street, Suite 201 Deerfield Beach, FL 33441-5634 or by calling 1-800-965-8307
or 954-785-1121.
|
|
|

