You are not logged in.
This means you
CAN ONLY VIEW reports that were published prior to Monday, March 10, 2025.
You
MUST UPGRADE YOUR MEMBERSHIP if you want to see any current reports.
AFTER MARKET UPDATE - THURSDAY, AUGUST 2ND, 2012
Previous After Market Report Next After Market Report >>>
|
|
|
|
DOW |
-92.18 |
12,878.88 |
-0.71% |
|
Volume |
825,632,940 |
-20% |
|
Volume |
1,789,846,070 |
+6% |
|
NASDAQ |
-10.44 |
2,909.77 |
-0.36% |
|
Advancers |
1,147 |
36% |
|
Advancers |
1,031 |
40% |
|
S&P 500 |
-10.32 |
1,365.00 |
-0.75% |
|
Decliners |
1,897 |
60% |
|
Decliners |
1,418 |
55% |
|
Russell 2000 |
-2.51 |
768.60 |
-0.33% |
|
52 Wk Highs |
100 |
|
|
52 Wk Highs |
23 |
|
|
S&P 600 |
-0.47 |
433.06 |
-0.11% |
|
52 Wk Lows |
62 |
|
|
52 Wk Lows |
92 |
|
|
 |
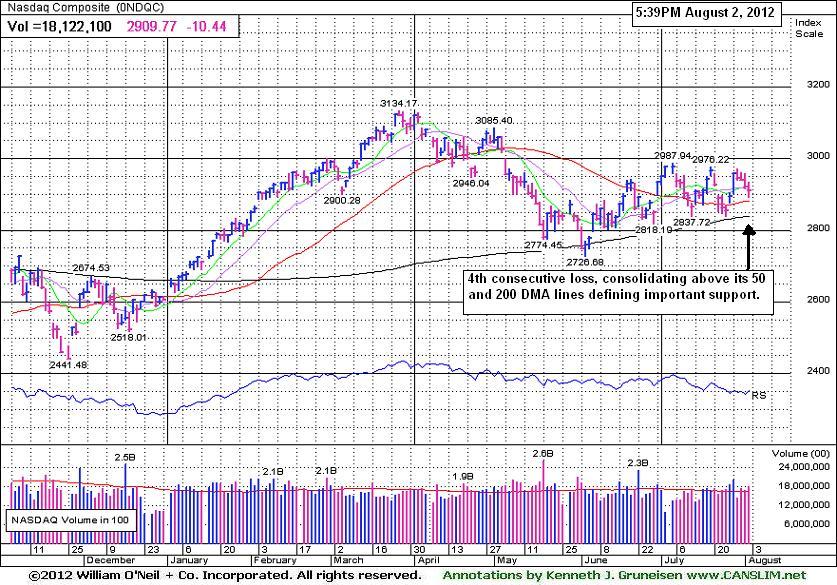
Indices End Unanimously Lower for 4th Consecutive Session
Kenneth J. Gruneisen - Passed the CAN SLIM® Master's Exam
The major averages finished unanimously lower for a 4th consecutive session. The volume totals were reported mixed, lighter on the NYSE and higher on the Nasdaq exchange versus the prior session totals. Declining issues led advancing issues by about a 3-2 margin on the NYSE and on the Nasdaq exchange. The total number of new 52-week highs led new 52-week lows on the NYSE, but new lows again outnumbered new highs on the Nasdaq exchange. There were 18 high-ranked companies from the CANSLIM.net Leaders List made new 52-week highs and appeared on the CANSLIM.net BreakOuts Page, down from the prior session total of 25 stocks. There were gains for 12 of the 15 high-ranked companies currently included on the Featured Stocks Page, a substantially positive bias versus the broader market's negative breadth.
Stocks were lower on disappointment that the ECB did not start immediate actions to help stabilize the euro zone by reducing the region's surging borrowing costs. The Bank of England also left its monetary policy unchanged despite signs of slowing growth. An unexpected drop in factory orders added to the negative tone after orders fell -0.5% versus an expectation for an advance of +0.5%. Weekly jobless claims also hit the tape, falling 8,000 to 365,000 and the previous reading was revised higher to 357,000.
In company news, Gap Inc (GPS +12.75%) reported July comparable store sales that beat estimates. In addition, Target Corp (TGT +2.23%) and Macy's Inc (M +3.82%) rose after both retailers also posted better than expected sales tallies. Prudential Financial Inc (PRU +5.17%), MetLife Inc (MET +4.17%) rallied after their latest earnings news, meanwhile Transocean Ltd (RIG -1.26%) edged lower.
The second-quarter earnings season continues to wind down and after the close notable reports were also out from Kraft Foods Inc (KFT -1.14%), and LinkedIn Corp (LNKD -2.23%). American International Group, Inc. (AIG - Unchanged), the insurer majority-owned by the U.S. Treasury Department, reported after the close that its net income rose to $2.33 billion, or $1.33 a share, from $1.84 billion, or $1, a year earlier. Its reported operating profit, which excludes some investment results, was $1.06 a share, beating the average estimate of 60 cents in a Bloomberg survey of 20 analysts.
In fixed-income, Treasuries were higher with the 10-year note up 11/32 to yield 1.48% and the 30-year bond gained 27/32 to yield 2.56%.
In terms of the M criteria, last week's gains brought technical improvements to the major indices' trend coupled with an expansion in leadership (stocks hitting new 52-week highs). Any sustainable rally requires a healthy crop of strong leaders hitting new 52-week highs.
Watch for an announcement soon via email concerning new monthly webcasts starting in August and a new "Market's Leading Groups" archives tab to be added on the Premium Member Homepage. These changes are aimed at satisfying member requests and improving the service. If you have questions, comments or suggestions please let us know via the inquiry form here. The most recent WEBCAST (Q2 2012) is available "ON DEMAND" - CLICK HERE.
PICTURED: The Nasdaq Composite Index ended with a 4th consecutive loss. It and the other major averages are consolidating above support at their 50-day and 200-day moving average (DMA) lines.
|
 Kenneth J. Gruneisen started out as a licensed stockbroker in August 1987, a couple of months prior to the historic stock market crash that took the Dow Jones Industrial Average down -22.6% in a single day. He has published daily fact-based fundamental and technical analysis on high-ranked stocks online for two decades. Through FACTBASEDINVESTING.COM, Kenneth provides educational articles, news, market commentary, and other information regarding proven investment systems that work in good times and bad.
Comments contained in the body of this report are technical opinions only and are not necessarily those of Gruneisen Growth Corp. The material herein has been obtained from sources believed to be reliable and accurate, however, its accuracy and completeness cannot be guaranteed. Our firm, employees, and customers may effect transactions, including transactions contrary to any recommendation herein, or have positions in the securities mentioned herein or options with respect thereto. Any recommendation contained in this report may not be suitable for all investors and it is not to be deemed an offer or solicitation on our part with respect to the purchase or sale of any securities. |
|
 |
Retail Group Resilient Amid Widespread Weakness
Kenneth J. Gruneisen - Passed the CAN SLIM® Master's Exam
Weakness in energy-related shares dragged the Integrated Oil Index ($XOI -1.69%) and the Oil Services Index ($OSX -1.34%) lower. The tech sector was weak as the Biotechnology Index ($BTK -1.58%), Networking Index ($NWX -1.07%), Internet Index ($IIX -0.83%), and Semiconductor Index ($SOX -0.61%) finished with unanimous losses. Defensive groups including the Gold & Silver Index ($XAU -0.93%) and the Healthcare Index ($HMO -0.91%) did nothing to reward "safe haven" investors.
The Retail Index ($RLX +0.38%) tallied a modest gain, making it a standout industry group on an otherwise negative session for most groups. Knight Capital Grp (KCG -62.82%) shares fell precipitously, closing at $2.58 after it reported a $440 million loss, down sharply after having ended July trading at $10.33. The Broker/Dealer Index ($XBD -5.32%) was smacked with a large loss as a result. The group has been disconcertingly weak this year, as the prior commentary showed the index slumping to lows not seen since November 2011 (read here), and the latest damage led to a slump under its November lows.
Charts courtesy www.stockcharts.com
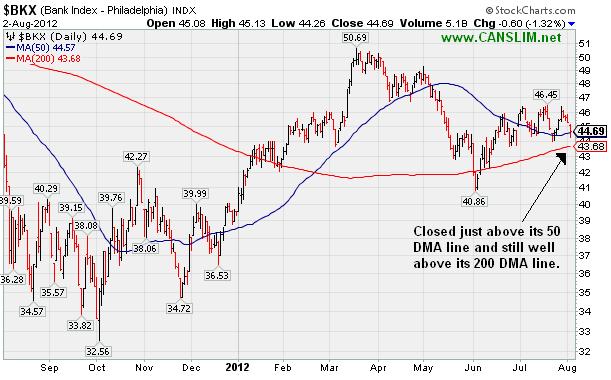
PICTURED: The Bank Index ($BKX -1.32%) slumped, closing just above its 50-day moving average (DMA) line and still well above its 200 DMA line. As "leading indicators" are concerned, the Bank Index is clearly in healthier shape than the Broker/Dealer Index, however any deterioration below its 50 or 200 DMA lines would not bode well for the broader market outlook.
| Oil Services |
$OSX |
215.86 |
-2.93 |
-1.34% |
-0.19% |
| Healthcare |
$HMO |
2,255.30 |
-20.72 |
-0.91% |
-1.15% |
| Integrated Oil |
$XOI |
1,183.46 |
-20.29 |
-1.69% |
-3.71% |
| Semiconductor |
$SOX |
381.48 |
-2.35 |
-0.61% |
+4.68% |
| Networking |
$NWX |
194.13 |
-2.11 |
-1.07% |
-9.78% |
| Internet |
$IIX |
298.17 |
-2.49 |
-0.83% |
+5.83% |
| Broker/Dealer |
$XBD |
74.89 |
-4.21 |
-5.32% |
-10.06% |
| Retail |
$RLX |
614.62 |
+2.30 |
+0.38% |
+17.47% |
| Gold & Silver |
$XAU |
147.73 |
-1.38 |
-0.93% |
-18.22% |
| Bank |
$BKX |
44.69 |
-0.60 |
-1.32% |
+13.48% |
| Biotech |
$BTK |
1,414.44 |
-22.66 |
-1.58% |
+29.60% |
|
|
|
 |
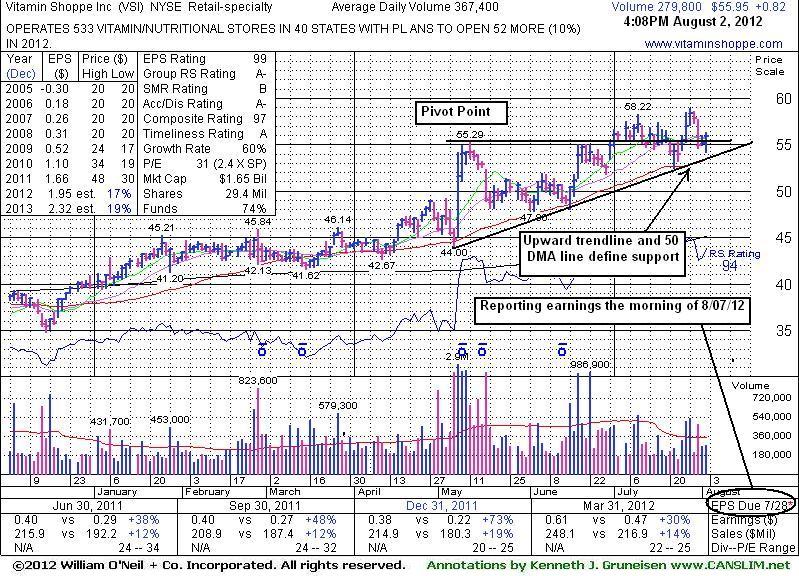
Watch for Earnings News Due Early Next Week
Kenneth J. Gruneisen - Passed the CAN SLIM® Master's Exam
Vitamin Shoppe Inc's (VSI +$0.82 or +1.49% to $55.95) nearby 50-day moving average (DMA) line and upward trendline define important chart support to watch. Violations may raise concerns and trigger technical sell signals. The company is due to report financial results before the market open on Tuesday, August 7, 2012. Volume and volatility often increase near earnings news.
Gains above its pivot point on 7/26/12 and 7/2712 were marked by above average volume, but the volume totals were not even +50% above average. For a convincing technical buy signal there should be very heavy volume driving it higher - action indicative of hearty institutional buying demand. Without great volume conviction driving a breakout, it is less likely that a stock will continue much higher for a meaningful advance. VSI was last shown in this FSU section on 7/02/12 with an annotated graph under the headline, "Volume Was Lighter Than Required For Technical Buy Signal". Earlier gains from a cup-with-handle base fell short of the minimum volume threshold for gains above a stock's pivot to clinch a proper new (or add-on) technical buy signal. Leadership (L criteria) in the Retail - Specialty group has been waning in the meanwhile, as the Group Relative Strength Rating fell to 76 from 94 when last shown.
Fundamentally, it has earned high ranks after showing strong quarterly and annual earnings increases satisfying the C and A criteria. The number of top-rated funds owning its shares rose from 288 in Jun '11 to 376 in Jun '12, a reassuring sign concerning the I criteria. Vitamin Shoppe has 29.4 million shares outstanding. That small supply is not a bad thing, but could contribute to greater price volatility. However, historic studies have shown that once companies have grown their supply (S criteria) of shares outstanding to hundreds of millions, or even billions of shares outstanding, they are less likely candidates to be "above average" gainers.
|
|
|
Color Codes Explained :
Y - Better candidates highlighted by our
staff of experts.
G - Previously featured
in past reports as yellow but may no longer be buyable under the
guidelines.
***Last / Change / Volume data in this table is the closing quote data***
Symbol/Exchange
Company Name
Industry Group |
PRICE |
CHANGE
(%Change) |
Day High |
Volume
(% DAV)
(% 50 day avg vol) |
52 Wk Hi
% From Hi |
Featured
Date |
Price
Featured |
Pivot Featured |
|
Max Buy |
ALXN
-
NASDAQ
Alexion Pharmaceuticals
DRUGS - Drug Manufacturers - Other
|
$102.30
|
-0.42
-0.41% |
$103.21
|
1,158,962
49.69% of 50 DAV
50 DAV is 2,332,400
|
$109.96
-6.97%
|
5/1/2012
|
$91.73
|
PP = $95.11
|
|
MB = $99.87
|
Most Recent Note - 8/1/2012 6:14:40 PM
G - Down today with below average volume, pulling back under prior highs in the $104 area. Important support is defined by its 50 DMA line (now $96.48). Reported earnings +62% on +48% sales revenues for the quarter ended June 30, 2012 versus the year ago period.
>>> The latest Featured Stock Update with an annotated graph appeared on 7/25/2012. Click here.
View all notes |
Alert me of new notes |
CANSLIM.net Company Profile |
SEC |
Zacks Reports |
StockTalk |
News |
Chart |
Request a new note
C
A N
S L
I M


|
ASPS
-
NASDAQ
Altisource Ptf Sltns Sa
REAL ESTATE - Property Management/Developmen
|
$77.89
|
+0.11
0.14% |
$78.52
|
151,609
112.89% of 50 DAV
50 DAV is 134,300
|
$79.20
-1.65%
|
6/5/2012
|
$60.01
|
PP = $63.00
|
|
MB = $66.15
|
Most Recent Note - 8/1/2012 6:13:03 PM
G - Holding its ground at its 52-week high, extended from its prior base. Recent low and its 50 DMA line define near-term support to watch. Reported earnings +117% on +55% sales revenues for the quarter ended June 30, 2012 versus the year ago period.
>>> The latest Featured Stock Update with an annotated graph appeared on 7/3/2012. Click here.
View all notes |
Alert me of new notes |
CANSLIM.net Company Profile |
SEC |
Zacks Reports |
StockTalk |
News |
Chart |
Request a new note
C
A N
S L
I M
|
CFNL
-
NASDAQ
Cardinal Financial Corp
BANKING - Regional - Southeast Banks
|
$12.25
|
-0.19
-1.53% |
$12.37
|
43,631
55.37% of 50 DAV
50 DAV is 78,800
|
$13.21
-7.27%
|
7/20/2012
|
$12.85
|
PP = $12.41
|
|
MB = $13.03
|
Most Recent Note - 8/1/2012 11:57:11 AM
Y - Quietly consolidating since its 7/26/12 volume-driven gain above its pivot point. Recent lows define support above its 50 DMA line and prior chart highs which were previous resistance.
>>> The latest Featured Stock Update with an annotated graph appeared on 7/26/2012. Click here.
View all notes |
Alert me of new notes |
CANSLIM.net Company Profile |
SEC |
Zacks Reports |
StockTalk |
News |
Chart |
Request a new note
C
A N
S L
I M
|
CMCSA
-
NASDAQ
Comcast Corp Cl A
MEDIA - CATV Systems
|
$34.12
|
+0.57
1.70% |
$34.46
|
23,926,418
173.82% of 50 DAV
50 DAV is 13,765,400
|
$34.00
0.35%
|
6/11/2012
|
$29.94
|
PP = $30.98
|
|
MB = $32.53
|
 Most Recent Note - 8/2/2012 12:50:06 PM
G - Hitting another new 52-week high today, getting more extended from its prior base. Gapped up on 8/01/12 after reporting earnings +19% on +6% sales revenues for the Jun '12 quarter, below the fact-based investment system's +25% minimum guideline for the C criteria, but better than Street expectations.
>>> The latest Featured Stock Update with an annotated graph appeared on 7/11/2012. Click here.
View all notes |
Alert me of new notes |
CANSLIM.net Company Profile |
SEC |
Zacks Reports |
StockTalk |
News |
Chart |
Request a new note
C
A N
S L
I M
|
DG
-
NYSE
Dollar General Corp
RETAIL - Discount, Variety Stores
|
$51.47
|
+0.41
0.80% |
$51.57
|
2,333,844
58.09% of 50 DAV
50 DAV is 4,017,700
|
$56.04
-8.15%
|
7/16/2012
|
$54.68
|
PP = $56.14
|
|
MB = $58.95
|
Most Recent Note - 8/1/2012 11:49:03 AM
G - Consolidating below its 50 DMA line today after recent distributional pressure, and its color code is changed to green. It did not register volume-driven gains above its new pivot point to trigger a new (or add-on) technical buy signal.
>>> The latest Featured Stock Update with an annotated graph appeared on 7/12/2012. Click here.
View all notes |
Alert me of new notes |
CANSLIM.net Company Profile |
SEC |
Zacks Reports |
StockTalk |
News |
Chart |
Request a new note
C
A N
S L
I M
|
Symbol/Exchange
Company Name
Industry Group |
PRICE |
CHANGE
(%Change) |
Day High |
Volume
(% DAV)
(% 50 day avg vol) |
52 Wk Hi
% From Hi |
Featured
Date |
Price
Featured |
Pivot Featured |
|
Max Buy |
EXPE
-
NASDAQ
Expedia Inc
INTERNET - Internet Information Providers
|
$56.80
|
+0.40
0.71% |
$56.95
|
2,017,057
50.22% of 50 DAV
50 DAV is 4,016,800
|
$58.40
-2.73%
|
4/27/2012
|
$41.80
|
PP = $35.57
|
|
MB = $37.35
|
Most Recent Note - 8/1/2012 6:16:20 PM
G - Perched at its 52-week high, pausing today after a spurt of volume-driven gains. Reported earnings +24% on +14% sales revenues for the quarter ending June 30, 2012 versus the year ago period, just below the +25% minimum earnings guideline for buy candidates.
>>> The latest Featured Stock Update with an annotated graph appeared on 7/10/2012. Click here.
View all notes |
Alert me of new notes |
CANSLIM.net Company Profile |
SEC |
Zacks Reports |
StockTalk |
News |
Chart |
Request a new note
C
A N
S L
I M
|
GNC
-
NYSE
G N C Holdings Inc
RETAIL - Drug Stores
|
$38.99
|
+1.24
3.28% |
$39.32
|
2,190,403
87.49% of 50 DAV
50 DAV is 2,503,700
|
$42.70
-8.69%
|
6/29/2012
|
$39.20
|
PP = $40.00
|
|
MB = $42.00
|
Most Recent Note - 8/1/2012 11:38:21 AM
Y - Consolidating above its 50 DMA line today. Reported earnings +59% on +19% sales revenues for the quarter ended June 30, 2012 versus the year ago period, beating expectations, and it also raised guidance for FY '12.
>>> The latest Featured Stock Update with an annotated graph appeared on 7/5/2012. Click here.
View all notes |
Alert me of new notes |
CANSLIM.net Company Profile |
SEC |
Zacks Reports |
StockTalk |
News |
Chart |
Request a new note
C
A N
S L
I M
|
GPX
-
NYSE
G P Strategies Corp
DIVERSIFIED SERVICES - Education and Training Services
|
$18.55
|
+1.73
10.29% |
$19.00
|
133,771
243.22% of 50 DAV
50 DAV is 55,000
|
$18.99
-2.32%
|
6/29/2012
|
$18.01
|
PP = $18.15
|
|
MB = $19.06
|
Most Recent Note - 8/2/2012 1:12:31 PM
Y - Reported earnings +41% on +19% sales revenues for the Jun '12 quarter. Gapped up and touched a new 52-week high earlier today. Found support near its 50 DMA line when recently consolidating.
>>> The latest Featured Stock Update with an annotated graph appeared on 7/6/2012. Click here.
View all notes |
Alert me of new notes |
CANSLIM.net Company Profile |
SEC |
Zacks Reports |
StockTalk |
News |
Chart |
Request a new note
C
A N
S L
I M
|
HMSY
-
NASDAQ
H M S Holdings Corp
COMPUTER SOFTWARE and SERVICES - Healthcare Information Service
|
$34.13
|
+0.53
1.58% |
$34.25
|
587,860
60.94% of 50 DAV
50 DAV is 964,600
|
$35.98
-5.14%
|
7/27/2012
|
$33.91
|
PP = $34.83
|
|
MB = $36.57
|
Most Recent Note - 8/1/2012 12:02:49 PM
Y - Consolidating after spiking to a new 52-week high. Finished below its pivot point on 7/27/12 while posting a considerable gain with more than 2 times average volume. Subsequent volume-driven gains above its pivot may trigger a technical buy signal.
>>> The latest Featured Stock Update with an annotated graph appeared on 7/27/2012. Click here.
View all notes |
Alert me of new notes |
CANSLIM.net Company Profile |
SEC |
Zacks Reports |
StockTalk |
News |
Chart |
Request a new note
C
A N
S L
I M
|
N
-
NYSE
Netsuite Inc
DIVERSIFIED SERVICES - Business/Management Services
|
$53.96
|
+0.54
1.01% |
$54.73
|
790,639
106.53% of 50 DAV
50 DAV is 742,200
|
$58.56
-7.86%
|
6/20/2012
|
$51.83
|
PP = $51.88
|
|
MB = $54.47
|
Most Recent Note - 8/1/2012 11:47:30 AM
Y - Color code is changed to yellow after retreating below its "max buy" level, however odds are most favorable for investors when buying while a stock is rising. Rebounding from today's early lows after an abrupt pullback briefly undercut its 50 DMA line and recent lows raising concerns.
>>> The latest Featured Stock Update with an annotated graph appeared on 7/19/2012. Click here.
View all notes |
Alert me of new notes |
CANSLIM.net Company Profile |
SEC |
Zacks Reports |
StockTalk |
News |
Chart |
Request a new note
C
A N
S L
I M
|
Symbol/Exchange
Company Name
Industry Group |
PRICE |
CHANGE
(%Change) |
Day High |
Volume
(% DAV)
(% 50 day avg vol) |
52 Wk Hi
% From Hi |
Featured
Date |
Price
Featured |
Pivot Featured |
|
Max Buy |
NSM
-
NYSE
Nationstar Mtg Hldgs Inc
FINANCIAL SERVICES - Credit Services
|
$23.66
|
+1.34
6.00% |
$23.70
|
1,014,487
125.12% of 50 DAV
50 DAV is 810,800
|
$25.11
-5.77%
|
6/27/2012
|
$20.29
|
PP = $20.46
|
|
MB = $21.48
|
Most Recent Note - 8/2/2012 3:57:33 PM
G - Considerable volume-driven gain today. It is not near a sound base, but consolidating above its "max buy" level after recently finding support above prior highs and its 50 DMA line in the $20 area. See the latest FSU analysis for more details and a new annotated graph.
>>> The latest Featured Stock Update with an annotated graph appeared on 8/1/2012. Click here.
View all notes |
Alert me of new notes |
CANSLIM.net Company Profile |
SEC |
Zacks Reports |
StockTalk |
News |
Chart |
Request a new note
C
A N
S L
I M
|
RNF
-
NYSE
Rentech Nitrogen Ptnr Lp
CHEMICALS - Agricultural Chemicals
|
$30.32
|
-0.24
-0.79% |
$30.80
|
685,106
198.01% of 50 DAV
50 DAV is 346,000
|
$31.34
-3.25%
|
7/27/2012
|
$29.58
|
PP = $30.60
|
|
MB = $32.13
|
Most Recent Note - 8/2/2012 1:43:28 PM
Y - Churned above average volume this week near its 52-week high but it has encountered resistance near prior highs since highlighted yellow again in the 7/27/12 mid-day report.
>>> The latest Featured Stock Update with an annotated graph appeared on 7/31/2012. Click here.
View all notes |
Alert me of new notes |
CANSLIM.net Company Profile |
SEC |
Zacks Reports |
StockTalk |
News |
Chart |
Request a new note
C
A N
S L
I M
|
SWI
-
NYSE
Solarwinds Inc
COMPUTER SOFTWARE and SERVICES - Application Software
|
$53.11
|
+0.70
1.34% |
$53.82
|
901,827
69.99% of 50 DAV
50 DAV is 1,288,500
|
$53.97
-1.59%
|
7/25/2012
|
$47.82
|
PP = $47.89
|
|
MB = $50.28
|
Most Recent Note - 8/1/2012 6:17:48 PM
G - Hovering near its all-time high. Prior highs in the $48 area define initial support to watch on pullbacks.
>>> The latest Featured Stock Update with an annotated graph appeared on 7/30/2012. Click here.
View all notes |
Alert me of new notes |
CANSLIM.net Company Profile |
SEC |
Zacks Reports |
StockTalk |
News |
Chart |
Request a new note
C
A N
S L
I M
|
TDG
-
NYSE
Transdigm Group Inc
AEROSPACE/DEFENSE - Aerospace/Defense Products and; Services
|
$121.23
|
+0.97
0.81% |
$121.42
|
488,492
101.62% of 50 DAV
50 DAV is 480,700
|
$136.34
-11.08%
|
6/18/2012
|
$127.00
|
PP = $132.79
|
|
MB = $139.43
|
Most Recent Note - 8/1/2012 11:42:52 AM
G - Still holding its ground since a damaging loss on 7/24/12 with heavy volume violated its 50 DMA line triggering a technical sell signal. A rebound above its 50 DMA line is needed for its technical stance and outlook to improve. Meanwhile, recent lows in the $117-118 are define near-term support above its 200 DMA line.
>>> The latest Featured Stock Update with an annotated graph appeared on 7/18/2012. Click here.
View all notes |
Alert me of new notes |
CANSLIM.net Company Profile |
SEC |
Zacks Reports |
StockTalk |
News |
Chart |
Request a new note
C
A N
S L
I M
|
VSI
-
NYSE
Vitamin Shoppe Inc
SPECIALTY RETAIL - Specialty Retail, Other
|
$55.95
|
+0.82
1.49% |
$56.36
|
284,618
80.61% of 50 DAV
50 DAV is 353,100
|
$58.88
-4.98%
|
6/29/2012
|
$54.93
|
PP = $55.03
|
|
MB = $57.78
|
Most Recent Note - 8/2/2012 4:41:12 PM
Y - Its 50 DMA line and upward trendline define near-term chart support to watch. Due to report financial results before the market open on Tuesday, August 7, 2012. See the latest FSU analysis for more details and a new annotated graph.
>>> The latest Featured Stock Update with an annotated graph appeared on 8/2/2012. Click here.
View all notes |
Alert me of new notes |
CANSLIM.net Company Profile |
SEC |
Zacks Reports |
StockTalk |
News |
Chart |
Request a new note
C
A N
S L
I M
|
Symbol/Exchange
Company Name
Industry Group |
PRICE |
CHANGE
(%Change) |
Day High |
Volume
(% DAV)
(% 50 day avg vol) |
52 Wk Hi
% From Hi |
Featured
Date |
Price
Featured |
Pivot Featured |
|
Max Buy |
|
|
|
THESE ARE NOT BUY RECOMMENDATIONS!
Comments contained in the body of this report are technical
opinions only. The material herein has been obtained
from sources believed to be reliable and accurate, however,
its accuracy and completeness cannot be guaranteed.
This site is not an investment advisor, hence it does
not endorse or recommend any securities or other investments.
Any recommendation contained in this report may not
be suitable for all investors and it is not to be deemed
an offer or solicitation on our part with respect to
the purchase or sale of any securities. All trademarks,
service marks and trade names appearing in this report
are the property of their respective owners, and are
likewise used for identification purposes only.
This report is a service available
only to active Paid Premium Members.
You may opt-out of receiving report notifications
at any time. Questions or comments may be submitted
by writing to Premium Membership Services 665 S.E. 10 Street, Suite 201 Deerfield Beach, FL 33441-5634 or by calling 1-800-965-8307
or 954-785-1121.
|
|
|

