You are not logged in.
This means you
CAN ONLY VIEW reports that were published prior to Monday, April 14, 2025.
You
MUST UPGRADE YOUR MEMBERSHIP if you want to see any current reports.
AFTER MARKET UPDATE - THURSDAY, AUGUST 1ST, 2013
Previous After Market Report Next After Market Report >>>
|
|
|
|
DOW |
+128.48 |
15,628.02 |
+0.83% |
|
Volume |
798,373,080 |
-12% |
|
Volume |
1,803,610,230 |
-3% |
|
NASDAQ |
+49.37 |
3,675.74 |
+1.36% |
|
Advancers |
1,913 |
61% |
|
Advancers |
1,833 |
70% |
|
S&P 500 |
+21.14 |
1,706.87 |
+1.25% |
|
Decliners |
1,156 |
37% |
|
Decliners |
704 |
27% |
|
Russell 2000 |
+14.62 |
1,059.88 |
+1.40% |
|
52 Wk Highs |
403 |
|
|
52 Wk Highs |
314 |
|
|
S&P 600 |
+8.07 |
595.83 |
+1.37% |
|
52 Wk Lows |
86 |
|
|
52 Wk Lows |
10 |
|
|
 |
Major Averages Extend Rally Into Record High Ground
Kenneth J. Gruneisen - Passed the CAN SLIM® Master's Exam
The Dow Jones Industrial Average and S&P 500 Index both advanced into new record high territory on Thursday. Volume totals were above average but lighter than the prior session totals on the Nasdaq exchange and on the NYSE. Advancers outnumbered decliners by more than 2-1 on the Nasdaq exchange and by nearly 2-1 on the NYSE. There were 127 high-ranked companies from the CANSLIM.net Leaders List made new 52-week highs and appeared on the CANSLIM.net BreakOuts Page, up from the prior session total of 78 stocks. The list of stocks hitting new 52-week highs expanded and outnumbered new 52-week lows on both the NYSE and the Nasdaq exchange. There were gains for 14 of the 16 high-ranked companies currently included on the Featured Stocks Page.
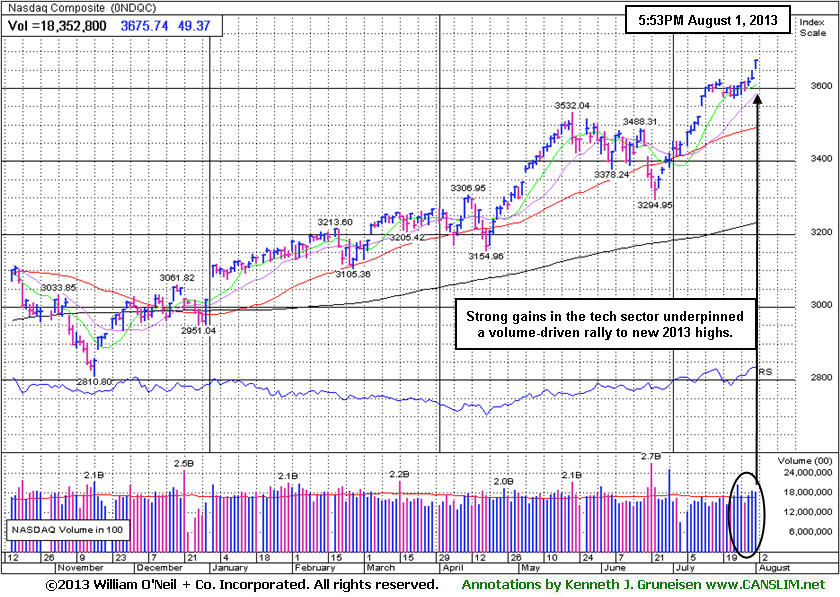
The major averages rallied convincingly on the first trading day of August prompted by better-than-expected economic data. Ahead of Friday's employment report, weekly jobless claims declined to 326,000 from a revised prior reading of 345,000. The market extended its gains after the Institute for Supply Management reported manufacturing activity expanded in July at a faster pace than projected.
Procter & Gamble Co (PG +1.67%) rose after posting quarterly results above consensus estimates. Shares of Exxon Mobile Corp (XOM -1.09%) fell as it reported its first profit decline in four years. Financials were among the best performing groups with insurer Lincoln National Corp (LNC +6.65%) and Bank of America Corp (BAC +2.40%). Industrials and consumer stocks also paced the advance as FedEx Corp (FDX +3.77%) and CBS Corp (CBS +3.86%) rallied.
The market (M criteria) has flashed substantial strength and leadership. Now in a confirmed rally, odds are considered favorable for investors' success with new buying efforts. Investors should be disciplined and selective while looking to be proactive and focused exclusively on the individual leaders best matching the winning models of the fact-based investment system. Study the companies on the CANSLIM.net Featured Stocks Page - a page showing the most action-worthy candidates' latest notes and links to additional resources including detailed analysis with data-packed graphs which are annotated by a Certified expert. The Premium Member Homepage - includes "dynamic archives" to all prior pay reports published. Watch for an announcement via email concerning the next WEBCAST.
PICTURED: The Nasdaq Composite Index is up +21.7% year-to-date after strong gains in the tech sector underpinned a volume-driven rally to new 2013 highs.
|
 Kenneth J. Gruneisen started out as a licensed stockbroker in August 1987, a couple of months prior to the historic stock market crash that took the Dow Jones Industrial Average down -22.6% in a single day. He has published daily fact-based fundamental and technical analysis on high-ranked stocks online for two decades. Through FACTBASEDINVESTING.COM, Kenneth provides educational articles, news, market commentary, and other information regarding proven investment systems that work in good times and bad.
Comments contained in the body of this report are technical opinions only and are not necessarily those of Gruneisen Growth Corp. The material herein has been obtained from sources believed to be reliable and accurate, however, its accuracy and completeness cannot be guaranteed. Our firm, employees, and customers may effect transactions, including transactions contrary to any recommendation herein, or have positions in the securities mentioned herein or options with respect thereto. Any recommendation contained in this report may not be suitable for all investors and it is not to be deemed an offer or solicitation on our part with respect to the purchase or sale of any securities. |
|
 |
Financial and Tech Indexes Underpinned Widespread Rally
Kenneth J. Gruneisen - Passed the CAN SLIM® Master's Exam
The Retail Index ($RLX +1.30%) rose and strong gains from financial stocks were a positive influence on the major averages as the Bank Index ($BKX +1.93%) and the Broker/Dealer Index ($XBD +2.00%) rose. The tech sector saw unanimous gains from the Internet Index ($IIX +0.95%), Networking Index ($NWX +1.40%), Semiconductor Index ($SOX +1.85%), and the Biotechnology Index ($BTK +2.12%). Energy-related shares rose with the Oil Services Index ($OSX +1.75%) outpacing the Integrated Oil Index ($XOI +0.32%). The Healthcare Index ($HMO +0.40%) posted a modest gain. The Gold & Silver Index ($XAU -2.68%) was a standout laggard as it lost ground while investors shunned the classic safe-haven group for growth-oriented stocks.
Charts courtesy www.stockcharts.com
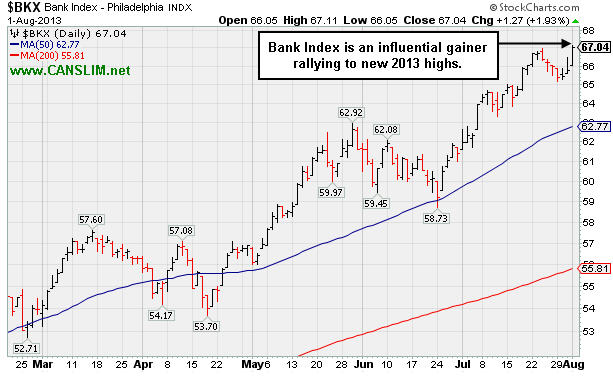
PICTURED: The Bank Index ($BKX +1.93%) was a positive influence on the major averages as it advanced to new 2013 highs on Thursday.
| Oil Services |
$OSX |
266.79 |
+4.59 |
+1.75% |
+21.18% |
| Healthcare |
$HMO |
3,382.79 |
+13.49 |
+0.40% |
+34.55% |
| Integrated Oil |
$XOI |
1,400.01 |
+4.50 |
+0.32% |
+12.74% |
| Semiconductor |
$SOX |
486.60 |
+8.82 |
+1.85% |
+26.70% |
| Networking |
$NWX |
290.83 |
+4.00 |
+1.40% |
+28.37% |
| Internet |
$IIX |
408.83 |
+3.85 |
+0.95% |
+25.02% |
| Broker/Dealer |
$XBD |
135.81 |
+2.66 |
+2.00% |
+43.98% |
| Retail |
$RLX |
847.00 |
+10.86 |
+1.30% |
+29.70% |
| Gold & Silver |
$XAU |
96.11 |
-2.65 |
-2.68% |
-41.96% |
| Bank |
$BKX |
67.04 |
+1.27 |
+1.93% |
+30.73% |
| Biotech |
$BTK |
2,188.26 |
+45.50 |
+2.12% |
+41.45% |
|
|
|
 |
Following Breakaway Gap Getting Extended Quickly
Kenneth J. Gruneisen - Passed the CAN SLIM® Master's Exam
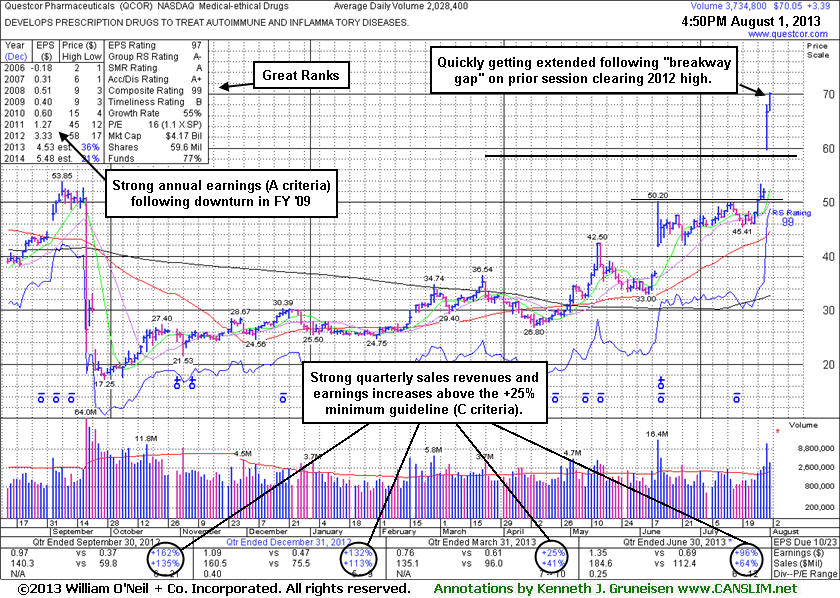
Questcor Pharmaceuticals (QCOR +$3.39 or +5.09% to $70.05) blasted higher with additional volume-driven gains today and its color code was changed to green after quickly getting even more extended from its "max buy" level. It was highlighted in yellow in the 7/31/13 mid-day report (read here) with a weekly graph which illustrated its powerful long-term breakout to new highs. The pivot point cited was based on its 7/09/12 high plus 10 cents, a prior high which is not shown on its annotated daily graph included below.
Regular readers may note that a "breakaway gap" has been noted many times in the past as one valid exception to the rule which limits investors from buying stocks at more than +5% above their prior chart high or pivot point. The newspaper and experts teaching the Certification suggest that in a very bullish market environment it is permissible to buy stocks as much as 10% above their prior highs when a stock stages a powerful breakaway gap. However, the risk of being stopped out with a -7% loss on an ordinary pullback increases the further above prior highs one purchases a stock, which why it is usually best to buy as near the pivot point as possible after a technical breakout. Patient investors may also watch for secondary buy points or new bases to possibly develop and be noted in the weeks ahead.
Considering its deep consolidation below its 200-day moving average (DMA) line over the past year, the technical breakout to new highs has the look of what could be the beginning of a substantial and sustained leg up. However, the quick pullback in its past also serves as a reminder for investors to always have a stop loss order in place or follow strict selling rules in the event of any damaging losses. It rebounded impressively from its September 2012 lows in the $17 area.
QCOR had recently been noted as it cleared a shorter and very orderly flat base. It reported earnings +96% on +64% sales for the Jun '13 quarter, continuing its streak of strong quarterly comparisons with solid sales revenues and earnings increases satisfy the C criteria of the fact-based system. Since a FY '09 downturn its annual earnings (A criteria) growth has been strong. The small supply (S criteria) of 59.6 million shares outstanding can contribute to greater price volatility in the event of institutional buying or selling. The number of top-rated funds owning its shares rose from 441 in Dec '12 to 464 in Jun '13, a reassuring sign concerning the I criteria. The Medical - Ethical Drugs group has an A- rating and leadership in the group is an encouraging sign concerning the L criteria.
|
|
|
Color Codes Explained :
Y - Better candidates highlighted by our
staff of experts.
G - Previously featured
in past reports as yellow but may no longer be buyable under the
guidelines.
***Last / Change / Volume data in this table is the closing quote data***
Symbol/Exchange
Company Name
Industry Group |
PRICE |
CHANGE
(%Change) |
Day High |
Volume
(% DAV)
(% 50 day avg vol) |
52 Wk Hi
% From Hi |
Featured
Date |
Price
Featured |
Pivot Featured |
|
Max Buy |
AMBA
-
NASDAQ
Ambarella Inc
ELECTRONICS - Semiconductor - Specialized
|
$16.03
|
-0.57
-3.43% |
$16.89
|
1,872,423
155.41% of 50 DAV
50 DAV is 1,204,800
|
$19.44
-17.54%
|
7/15/2013
|
$17.87
|
PP = $18.68
|
|
MB = $19.61
|
Most Recent Note - 7/30/2013 6:30:51 PM
G - Violated its 50 DMA line triggering a technical sell signal with a damaging loss backed by above average volume. Color code is changed to green as weakness raised concerns. Only a prompt rebound above that important short-term average would help its outlook improve.
>>> The latest Featured Stock Update with an annotated graph appeared on 7/17/2013. Click here.
View all notes |
Alert me of new notes |
CANSLIM.net Company Profile |
SEC |
Zacks Reports |
StockTalk |
News |
Chart |
Request a new note
C
A N
S L
I M


|
CELG
-
NASDAQ
Celgene Corp
DRUGS - Drug Manufacturers - Major
|
$148.79
|
+1.93
1.31% |
$149.92
|
2,455,110
84.40% of 50 DAV
50 DAV is 2,908,900
|
$146.22
1.76%
|
7/11/2013
|
$133.25
|
PP = $131.92
|
|
MB = $138.52
|
Most Recent Note - 7/29/2013 6:00:46 PM
G - Extended from its prior base after last week's volume-driven gains, it is now consolidating above prior highs defining initial support in the $131 area. See the latest FSU analysis for more details and a new annotated graph.
>>> The latest Featured Stock Update with an annotated graph appeared on 7/29/2013. Click here.
View all notes |
Alert me of new notes |
CANSLIM.net Company Profile |
SEC |
Zacks Reports |
StockTalk |
News |
Chart |
Request a new note
C
A N
S L
I M
|
FLT
-
NYSE
Fleetcor Technologies
DIVERSIFIED SERVICES - Business/Management Services
|
$91.85
|
+2.08
2.32% |
$92.94
|
1,145,039
164.05% of 50 DAV
50 DAV is 698,000
|
$90.92
1.02%
|
5/29/2013
|
$86.02
|
PP = $85.66
|
|
MB = $89.94
|
Most Recent Note - 7/26/2013 5:04:34 PM
G- Rallied for a new all-time high today with a gain lacking great volume conviction. Found support near its 50 DMA during its latest consolidation.
>>> The latest Featured Stock Update with an annotated graph appeared on 7/18/2013. Click here.
View all notes |
Alert me of new notes |
CANSLIM.net Company Profile |
SEC |
Zacks Reports |
StockTalk |
News |
Chart |
Request a new note
C
A N
S L
I M
|
GNRC
-
NYSE
Generac Hldgs Inc
CONSUMER DURABLES - Electronic Equipment
|
$43.45
|
+0.10
0.23% |
$43.69
|
1,318,932
114.88% of 50 DAV
50 DAV is 1,148,100
|
$44.30
-1.92%
|
7/30/2013
|
$42.60
|
PP = $42.10
|
|
MB = $44.21
|
Most Recent Note - 7/30/2013 6:27:17 PM
Y - Triggered a technical buy signal with a gap up today for a new 52-week high with its considerable gain backed more than 2 times average volume. It was highlighted in yellow with a pivot point based on its 7/17/13 high plus 10 cents while rallying from an advanced "3-weeks tight" base. Reported earnings +64% on +45% sales for the June '13 quarter. Recent quarterly comparisons show impressive sequential acceleration in sales revenues and earnings growth, making it a better match with the C criteria of the fact-based system. See the latest FSU analysis for more details and a new annotated graph.
>>> The latest Featured Stock Update with an annotated graph appeared on 7/30/2013. Click here.
View all notes |
Alert me of new notes |
CANSLIM.net Company Profile |
SEC |
Zacks Reports |
StockTalk |
News |
Chart |
Request a new note
C
A N
S L
I M
|
LOPE
-
NASDAQ
Grand Canyon Education
DIVERSIFIED SERVICES - Education and; Training Services
|
$34.32
|
+0.50
1.48% |
$34.82
|
596,423
133.85% of 50 DAV
50 DAV is 445,600
|
$36.45
-5.84%
|
6/19/2013
|
$31.47
|
PP = $34.17
|
|
MB = $35.88
|
Most Recent Note - 7/30/2013 6:37:23 PM
Y - Reported its second quarter results following today's market close after enduring mild distributional pressure near its 52-week high. Finished still perched above its pivot point and below its "max buy" level. Prior highs in the $34 area define support along with its 50 DMA line.
>>> The latest Featured Stock Update with an annotated graph appeared on 7/19/2013. Click here.
View all notes |
Alert me of new notes |
CANSLIM.net Company Profile |
SEC |
Zacks Reports |
StockTalk |
News |
Chart |
Request a new note
C
A N
S L
I M
|
Symbol/Exchange
Company Name
Industry Group |
PRICE |
CHANGE
(%Change) |
Day High |
Volume
(% DAV)
(% 50 day avg vol) |
52 Wk Hi
% From Hi |
Featured
Date |
Price
Featured |
Pivot Featured |
|
Max Buy |
PCLN
-
NASDAQ
Priceline.Com Inc
INTERNET - Internet Software and Services
|
$904.35
|
+28.68
3.28% |
$906.53
|
1,008,594
149.27% of 50 DAV
50 DAV is 675,700
|
$926.40
-2.38%
|
7/8/2013
|
$878.28
|
PP = $847.43
|
|
MB = $889.80
|
Most Recent Note - 7/29/2013 1:52:10 PM
G - Due to report earnings August 8th. Extended from its prior base, enduring distributional pressure while consolidating in a tight range near its high. Prior highs in the $847 area define support to watch on pullbacks.
>>> The latest Featured Stock Update with an annotated graph appeared on 7/25/2013. Click here.
View all notes |
Alert me of new notes |
CANSLIM.net Company Profile |
SEC |
Zacks Reports |
StockTalk |
News |
Chart |
Request a new note
C
A N
S L
I M
|
PRAA
-
NASDAQ
Portfolio Recovery Assoc
DIVERSIFIED SERVICES - Business/Management Services
|
$154.28
|
+4.97
3.33% |
$154.47
|
252,694
199.92% of 50 DAV
50 DAV is 126,400
|
$163.87
-5.85%
|
7/31/2013
|
$154.30
|
PP = $163.97
|
|
MB = $172.17
|
 Most Recent Note - 8/1/2013 6:25:45 PM
Y - Rallied above its 50 DMA line with today's 3rd consecutive volume-driven gain. It was highlighted in yellow with new pivot point cited based on its 6/17/13 high plus 10 cents in the Wednesday's mid-day report (read here). It was noted - "It faces some resistance and needs additional volume-driven gains to trigger a proper new technical buy signal. Reported earnings +37% on +24% sales revenues for the Jun '13 quarter. Showing resilience since dropped from the Featured Stocks list on 7/10/13 due to technical weakness."
>>> The latest Featured Stock Update with an annotated graph appeared on 6/25/2013. Click here.
View all notes |
Alert me of new notes |
CANSLIM.net Company Profile |
SEC |
Zacks Reports |
StockTalk |
News |
Chart |
Request a new note
C
A N
S L
I M
|
PRLB
-
NYSE
Proto Labs Inc
MANUFACTURING - Small Tools and Accessories
|
$65.11
|
-2.56
-3.78% |
$65.99
|
1,796,043
431.33% of 50 DAV
50 DAV is 416,400
|
$67.40
-3.40%
|
7/29/2013
|
$64.86
|
PP = $67.50
|
|
MB = $70.88
|
Most Recent Note - 8/1/2013 12:53:55 PM
Y - Reported earnings +50% on +33% for the Jun '13 quarter, continuing its history of strong earnings increases above the +25% minimum guideline (C criteria). Retreating from its 52-week high hit on the prior session with a damaging gap down today promptly negating its technical breakout while falling back into the latest base. Its 50 DMA line defines important support just below recent lows in the $61 area.
>>> The latest Featured Stock Update with an annotated graph appeared on 7/15/2013. Click here.
View all notes |
Alert me of new notes |
CANSLIM.net Company Profile |
SEC |
Zacks Reports |
StockTalk |
News |
Chart |
Request a new note
C
A N
S L
I M
|
QCOR
-
NASDAQ
Questcor Pharmaceuticals
DRUGS - Biotechnology
|
$70.05
|
+3.39
5.09% |
$70.24
|
3,765,936
185.66% of 50 DAV
50 DAV is 2,028,400
|
$53.85
30.08%
|
7/31/2013
|
$66.46
|
PP = $59.01
|
|
MB = $61.96
|
Most Recent Note - 8/1/2013 5:51:50 PM
G - Blasted higher with additional volume-driven gains today and its color code is changed to green after quickly getting even more extended from its "max buy" level. It was highlighted in yellow in the 7/31/13 mid-day report (read here) with a weekly graph which illustrated its powerful long-term breakout to new highs. See the latest FSU analysis for more details and an annotated daily graph.
>>> The latest Featured Stock Update with an annotated graph appeared on 8/1/2013. Click here.
View all notes |
Alert me of new notes |
CANSLIM.net Company Profile |
SEC |
Zacks Reports |
StockTalk |
News |
Chart |
Request a new note
C
A N
S L
I M
|
RRTS
-
NYSE
Roadrunner Trans Systems
TRANSPORTATION - Air Delivery and Freight Service
|
$30.75
|
+0.52
1.72% |
$30.98
|
216,984
154.66% of 50 DAV
50 DAV is 140,300
|
$30.50
0.82%
|
4/3/2013
|
$22.77
|
PP = $23.75
|
|
MB = $24.94
|
Most Recent Note - 7/29/2013 1:34:59 PM
G - Still perched near its 52-week high with volume totals cooling while consolidating in a tight trading range for the past few weeks. Reports results for the Jun '13 quarter on Wednesday, July 31, 2013 after market close.
>>> The latest Featured Stock Update with an annotated graph appeared on 7/22/2013. Click here.
View all notes |
Alert me of new notes |
CANSLIM.net Company Profile |
SEC |
Zacks Reports |
StockTalk |
News |
Chart |
Request a new note
C
A N
S L
I M
|
Symbol/Exchange
Company Name
Industry Group |
PRICE |
CHANGE
(%Change) |
Day High |
Volume
(% DAV)
(% 50 day avg vol) |
52 Wk Hi
% From Hi |
Featured
Date |
Price
Featured |
Pivot Featured |
|
Max Buy |
SFUN
-
NYSE
Soufun Hldgs Ltd Ads A
INTERNET - Internet Information Providers
|
$35.17
|
+0.41
1.18% |
$35.39
|
750,405
219.80% of 50 DAV
50 DAV is 341,400
|
$36.43
-3.46%
|
7/16/2013
|
$29.54
|
PP = $27.90
|
|
MB = $29.30
|
Most Recent Note - 8/1/2013 12:55:58 PM
G - Extended from its latest base following volume-driven gains. Prior highs in the $28-29 area define initial support to watch.
>>> The latest Featured Stock Update with an annotated graph appeared on 7/16/2013. Click here.
View all notes |
Alert me of new notes |
CANSLIM.net Company Profile |
SEC |
Zacks Reports |
StockTalk |
News |
Chart |
Request a new note
C
A N
S L
I M
|
SSNC
-
NASDAQ
S S & C Technologies
COMPUTER SOFTWARE and SERVICES - Application Software
|
$36.11
|
+0.33
0.92% |
$36.59
|
345,271
92.07% of 50 DAV
50 DAV is 375,000
|
$38.47
-6.13%
|
7/11/2013
|
$35.80
|
PP = $34.54
|
|
MB = $36.27
|
Most Recent Note - 7/26/2013 6:07:04 PM
Y - Loss today with above average volume was a sign of distributional pressure. Color code is changed to yellow after slumping below its "max buy" level. Prior highs in the $34 area define initial support to watch above its 50 DMA line.
>>> The latest Featured Stock Update with an annotated graph appeared on 7/12/2013. Click here.
View all notes |
Alert me of new notes |
CANSLIM.net Company Profile |
SEC |
Zacks Reports |
StockTalk |
News |
Chart |
Request a new note
C
A N
S L
I M
|
SSYS
-
NASDAQ
Stratasys Ltd
COMPUTER HARDWARE - Computer Peripherals
|
$90.40
|
+1.75
1.97% |
$90.88
|
578,613
77.48% of 50 DAV
50 DAV is 746,800
|
$96.44
-6.26%
|
7/8/2013
|
$91.44
|
PP = $95.00
|
|
MB = $99.75
|
Most Recent Note - 7/30/2013 6:33:40 PM
Y - Encountered more distributional pressure and suffered a loss on higher volume while slumping near its 50 DMA line again. More damaging losses could raise greater concerns and trigger worrisome technical sell signals.
>>> The latest Featured Stock Update with an annotated graph appeared on 7/24/2013. Click here.
View all notes |
Alert me of new notes |
CANSLIM.net Company Profile |
SEC |
Zacks Reports |
StockTalk |
News |
Chart |
Request a new note
C
A N
S L
I M
|
STMP
-
NASDAQ
Stamps.Com Inc
INTERNET - Internet Software and Services
|
$43.63
|
+3.77
9.46% |
$46.47
|
495,651
368.51% of 50 DAV
50 DAV is 134,500
|
$42.98
1.51%
|
7/31/2013
|
$40.00
|
PP = $42.98
|
|
MB = $45.13
|
Most Recent Note - 8/1/2013 1:00:25 PM
Y - Reported earnings +50% on +14% sales revenues for the Jun '13 quarter, continuing its strong earnings history. Gapped up today for a considerable volume-driven gain and a new 52-week high, trading near the "max buy" level of the valid secondary buy point cited following its successful test of support. See the latest FSU analysis for more details and an annotated graph.
>>> The latest Featured Stock Update with an annotated graph appeared on 7/31/2013. Click here.
View all notes |
Alert me of new notes |
CANSLIM.net Company Profile |
SEC |
Zacks Reports |
StockTalk |
News |
Chart |
Request a new note
C
A N
S L
I M
|
VRX
-
NYSE
Valeant Pharmaceuticals
DRUGS - Drug Manufacturers - Other
|
$96.04
|
+2.44
2.61% |
$96.43
|
2,069,774
103.13% of 50 DAV
50 DAV is 2,006,900
|
$96.25
-0.22%
|
4/30/2013
|
$60.24
|
PP = $76.66
|
|
MB = $80.49
|
Most Recent Note - 7/29/2013 1:37:46 PM
Y- Volume totals have still been cooling while consolidating near its 52-week high after completing a new Public Offering on 6/18/13 following recent M&A news. Formed a cup-with-handle base over the past 9 weeks, however no new pivot point has been cited while members were repeatedly cautioned - "Concerns were raised by its Mar '13 earnings report with only a +14% earnings increase, below the +25% minimum guideline (C criteria) for buy candidates."
>>> The latest Featured Stock Update with an annotated graph appeared on 7/23/2013. Click here.
View all notes |
Alert me of new notes |
CANSLIM.net Company Profile |
SEC |
Zacks Reports |
StockTalk |
News |
Chart |
Request a new note
C
A N
S L
I M
|
Symbol/Exchange
Company Name
Industry Group |
PRICE |
CHANGE
(%Change) |
Day High |
Volume
(% DAV)
(% 50 day avg vol) |
52 Wk Hi
% From Hi |
Featured
Date |
Price
Featured |
Pivot Featured |
|
Max Buy |
YNDX
-
NASDAQ
Yandex N V Class A
INTERNET - Internet Information Providers
|
$33.72
|
+1.21
3.72% |
$34.27
|
4,176,574
168.07% of 50 DAV
50 DAV is 2,485,000
|
$33.66
0.18%
|
7/10/2013
|
$29.29
|
PP = $29.59
|
|
MB = $31.07
|
Most Recent Note - 7/29/2013 1:45:38 PM
G - Retreating form its 52-week high today after getting extended following 2 consecutive volume-driven gains into new high territory. Prior highs in the $28-29 area define near-term support to watch.
>>> The latest Featured Stock Update with an annotated graph appeared on 7/26/2013. Click here.
View all notes |
Alert me of new notes |
CANSLIM.net Company Profile |
SEC |
Zacks Reports |
StockTalk |
News |
Chart |
Request a new note
C
A N
S L
I M
|
|
|
|
THESE ARE NOT BUY RECOMMENDATIONS!
Comments contained in the body of this report are technical
opinions only. The material herein has been obtained
from sources believed to be reliable and accurate, however,
its accuracy and completeness cannot be guaranteed.
This site is not an investment advisor, hence it does
not endorse or recommend any securities or other investments.
Any recommendation contained in this report may not
be suitable for all investors and it is not to be deemed
an offer or solicitation on our part with respect to
the purchase or sale of any securities. All trademarks,
service marks and trade names appearing in this report
are the property of their respective owners, and are
likewise used for identification purposes only.
This report is a service available
only to active Paid Premium Members.
You may opt-out of receiving report notifications
at any time. Questions or comments may be submitted
by writing to Premium Membership Services 665 S.E. 10 Street, Suite 201 Deerfield Beach, FL 33441-5634 or by calling 1-800-965-8307
or 954-785-1121.
|
|
|

