You are not logged in.
This means you
CAN ONLY VIEW reports that were published prior to Monday, April 14, 2025.
You
MUST UPGRADE YOUR MEMBERSHIP if you want to see any current reports.
AFTER MARKET UPDATE - WEDNESDAY, JULY 31ST, 2013
Previous After Market Report Next After Market Report >>>
|
|
|
|
DOW |
-21.05 |
15,499.54 |
-0.14% |
|
Volume |
903,871,530 |
+33% |
|
Volume |
1,865,146,400 |
+9% |
|
NASDAQ |
+9.90 |
3,626.37 |
+0.27% |
|
Advancers |
1,559 |
50% |
|
Advancers |
1,365 |
52% |
|
S&P 500 |
-0.23 |
1,685.73 |
-0.01% |
|
Decliners |
1,453 |
47% |
|
Decliners |
1,144 |
44% |
|
Russell 2000 |
+1.75 |
1,045.26 |
+0.17% |
|
52 Wk Highs |
205 |
|
|
52 Wk Highs |
184 |
|
|
S&P 600 |
+1.24 |
587.76 |
+0.21% |
|
52 Wk Lows |
72 |
|
|
52 Wk Lows |
20 |
|
|
 |
Major Averages Tallied Solid Gains in July
Kenneth J. Gruneisen - Passed the CAN SLIM® Master's Exam
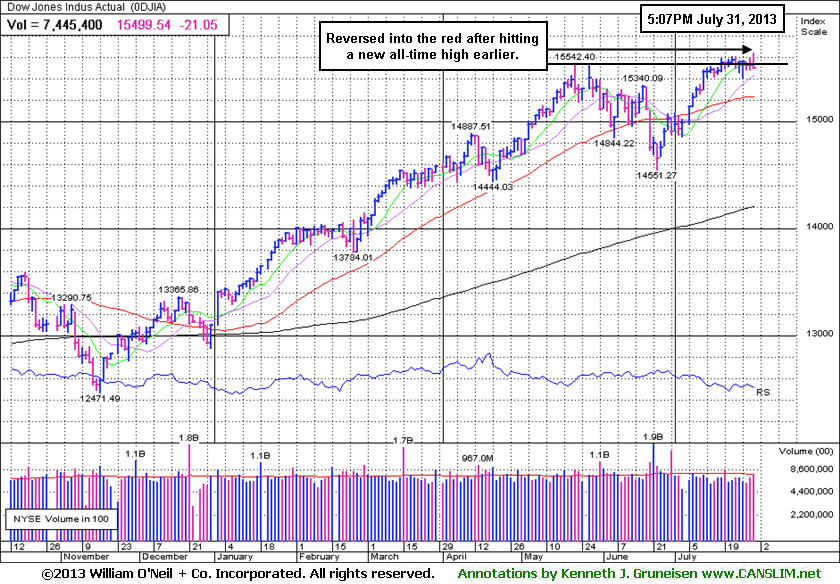
On Wednesday the major averages ended mixed. For the month, the Dow Jones Industrial Average was up +4.0%, the S&P 500 Index advanced +5.0% and the Nasdaq Composite Index gained +6.6%.Volume totals were reported higher than the prior session totals on the Nasdaq exchange and on the NYSE. Advancers again just narrowly outnumbered decliners on the Nasdaq exchange and on the NYSE. There were 78 high-ranked companies from the CANSLIM.net Leaders List made new 52-week highs and appeared on the CANSLIM.net BreakOuts Page, up from the prior session total of 48 stocks. The list of stocks hitting new 52-week highs expanded and outnumbered new 52-week lows on both the NYSE and the Nasdaq exchange. There were gains for 13 of the 16 high-ranked companies currently included on the Featured Stocks Page.
The major averages finished little changed as the Fed failed to provide investors with an indication when it may begin to taper its asset purchases. The market had been up for most of the session prompted by encouraging economic data. Before the open, reports showed GDP expanded at a +1.7% annualized rate and private payrolls gained 200,000 jobs in July. Stocks failed to maintain their gains following the conclusion of the Fed's policy meeting. In its statement, the central bank said it would maintain its bond-buying program until the employment outlook improves.
Consumer discretionary and energy were the best performing sectors in the S&P 500 today. Comcast Corp (CMCSA +5.55%) rose and Hess Corp (HES +1.74%) after posting quarterly results above analyst projections. Treasuries reversed early losses with the 10-year note finishing up 6/32 to 2.59%.
The market (M criteria) has flashed substantial strength and leadership. Now in a confirmed rally, odds are considered favorable for investors' success with new buying efforts. Investors should be disciplined and selective while looking to be proactive and focused exclusively on the individual leaders best matching the winning models of the fact-based investment system. Study the companies on the CANSLIM.net Featured Stocks Page - a page showing the most action-worthy candidates' latest notes and links to additional resources including detailed analysis with data-packed graphs which are annotated by a Certified expert. The Premium Member Homepage - includes "dynamic archives" to all prior pay reports published. Watch for an announcement via email concerning the next WEBCAST.
PICTURED: The Dow Jones Industrial Average reversed into the red after hitting yet another new all-time high.
|
 Kenneth J. Gruneisen started out as a licensed stockbroker in August 1987, a couple of months prior to the historic stock market crash that took the Dow Jones Industrial Average down -22.6% in a single day. He has published daily fact-based fundamental and technical analysis on high-ranked stocks online for two decades. Through FACTBASEDINVESTING.COM, Kenneth provides educational articles, news, market commentary, and other information regarding proven investment systems that work in good times and bad.
Comments contained in the body of this report are technical opinions only and are not necessarily those of Gruneisen Growth Corp. The material herein has been obtained from sources believed to be reliable and accurate, however, its accuracy and completeness cannot be guaranteed. Our firm, employees, and customers may effect transactions, including transactions contrary to any recommendation herein, or have positions in the securities mentioned herein or options with respect thereto. Any recommendation contained in this report may not be suitable for all investors and it is not to be deemed an offer or solicitation on our part with respect to the purchase or sale of any securities. |
|
 |
Financial and Energy-Related Groups Edged Higher
Kenneth J. Gruneisen - Passed the CAN SLIM® Master's Exam
Small gains from financial stocks helped provide influential leadership for the major averages as the Broker/Dealer Index ($XBD +0.47%) and Bank Index ($BKX +0.50%) rose. Energy-related shares also had a slightly positive bias as the Oil Services Index ($OSX +0.64%) and the Integrated Oil Index ($XOI +0.69%) posted modest gains on Wednesday. The Networking Index ($NWX -0.59%) pulled back and the Internet Index ($IIX +0.03%) and Biotechnology Index ($BTK +0.16%) were little changed while the Semiconductor Index ($SOX +0.46%) led the tech sector. The Retail Index ($RLX +0.26%) edged higher. Defensive groups were mixed with a small loss for the Gold & Silver Index ($XAU -0.42%) and a small gain for the Healthcare Index ($HMO +0.53%).
Charts courtesy www.stockcharts.com
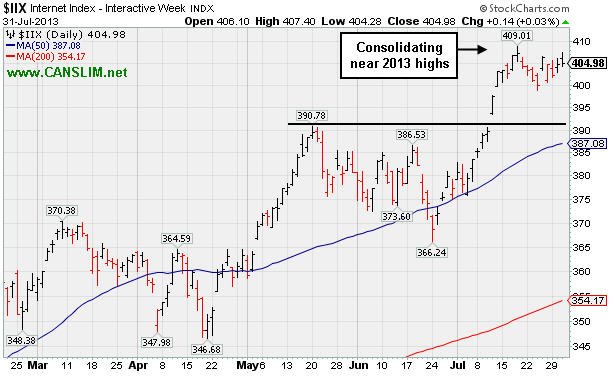
PICTURED: The Internet Index ($IIX +0.03%) is consolidating in a tight range near its 2013 high.
| Oil Services |
$OSX |
262.20 |
+1.67 |
+0.64% |
+19.10% |
| Healthcare |
$HMO |
3,369.30 |
+17.89 |
+0.53% |
+34.01% |
| Integrated Oil |
$XOI |
1,395.51 |
+9.54 |
+0.69% |
+12.38% |
| Semiconductor |
$SOX |
477.78 |
+2.19 |
+0.46% |
+24.40% |
| Networking |
$NWX |
286.83 |
-1.70 |
-0.59% |
+26.61% |
| Internet |
$IIX |
404.98 |
+0.14 |
+0.03% |
+23.85% |
| Broker/Dealer |
$XBD |
133.15 |
+0.63 |
+0.47% |
+41.16% |
| Retail |
$RLX |
836.14 |
+2.14 |
+0.26% |
+28.03% |
| Gold & Silver |
$XAU |
98.76 |
-0.42 |
-0.42% |
-40.36% |
| Bank |
$BKX |
65.77 |
+0.33 |
+0.50% |
+28.26% |
| Biotech |
$BTK |
2,142.76 |
+3.48 |
+0.16% |
+38.51% |
|
|
|
 |
Following Test of Support Secondary Buy Point Exists
Kenneth J. Gruneisen - Passed the CAN SLIM® Master's Exam
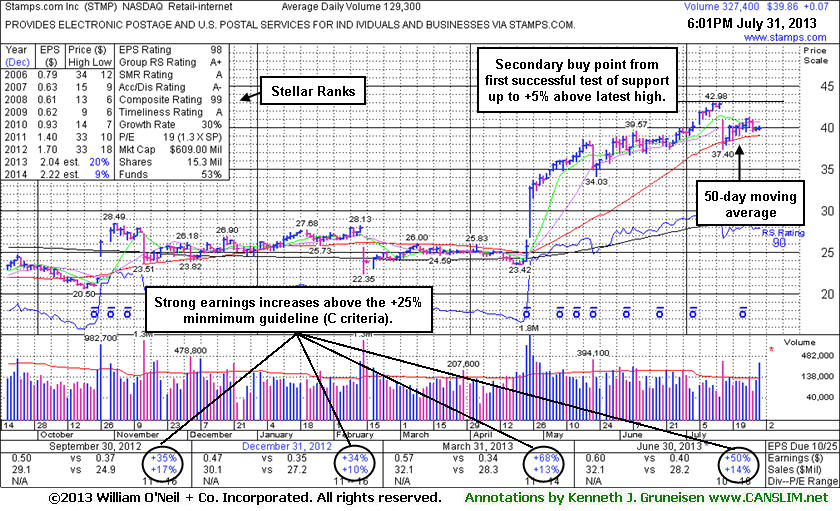
In the Certification they teach that stocks can be bought from their first test of the 10-week moving average (WMA) line up to as much as +5% above the latest high following an earlier technical breakout. The approach offers investors a "secondary buy point" if they missed an opportunity to accumulate shares at an earlier breakout, or if they wish to make add-on purchases and "force feed" their winning positions. The 10 WMA line closely corresponds with the 50-day moving average (DMA) line shown on the graph below. Obviously any damaging pullback may prompt investors to limit their losses at the -7% threshold from their purchase price, as always.
Stamps.Com Inc (STMP +$0.07 or +0.18% to $39.86) found prompt support at its 50-day moving average (DMA) line when it was hit with distributional pressure since last noted in the 6/25/13 mid-day report. Disciplined investors may watch for it to possibly form a proper base of sufficient length and be noted in the weeks ahead. The graph below shows its powerful breakout in late April. After clearing multi-year resistance in the $33 area it subsequently made steady progress by mostly wedging higher with gains lacking great volume conviction. That lack of great volume conviction in recent month helps explain why it failed to meet the screening criteria to show up in the daily mid-day report which is produced via a screening of the high-ranked Leaders List since the 6/25/13 mid-day report had noted - "It has not formed a sound base yet made gradual progress above multi-year highs in the $33 area since last noted in the 4/29/13 mid-day report - "Patient and disciplined investors may watch for a new base or secondary buy point to possibly develop and be noted in the weeks ahead. Reported earnings +68% on +13% sales revenues for the quarter ended March 31, 2013 versus the year ago period, marking a 3rd consecutive quarter above the +25% minimum guideline (C criteria). It survived but failed to impress since dropped from the Featured Stocks list on 2/14/12 based on the fundamental and technical concerns."
STMP had not formed a sound new base, however it was highlighted in yellow in today's mid-day report (read here) as it was noted - "A valid secondary buy point exists following its successful test of support up to +5% above its prior high. Reported earnings +68% on +13% sales revenues for the quarter ended March 31, 2013 versus the year ago period, marking a 3rd consecutive quarter above the +25% minimum guideline (C criteria). Due to report earnings after the close, and volume and volatility often increase near earnings news. "
After the close it reported earnings +50% on +14% sales for the quarter ended June 30, 2013 versus the year ago period, continuing its strong earnings track record. It has earned an Earnings Per Share Rating of 98, putting it in the top 2% of all publicly traded stocks based on its earnings history over the past 5 years. The Retail - Internet firm has other strong leaders in the group confirming the L criteria, as the group has an A+ Group Relative Strength Rating. Its annual earnings (A criteria) history has shown strong and steady increases since FY '09 following a couple of flat years. The number of top-rated funds owning its shares rose from 194 in Dec '12 to 199 in Jun '13, a reassuring sign concerning the I criteria. Its small supply of only 15.3 million shares outstanding (S criteria) can contribute to greater price volatility in the event of institutional buying or selling.
|
|
|
Color Codes Explained :
Y - Better candidates highlighted by our
staff of experts.
G - Previously featured
in past reports as yellow but may no longer be buyable under the
guidelines.
***Last / Change / Volume data in this table is the closing quote data***
Symbol/Exchange
Company Name
Industry Group |
PRICE |
CHANGE
(%Change) |
Day High |
Volume
(% DAV)
(% 50 day avg vol) |
52 Wk Hi
% From Hi |
Featured
Date |
Price
Featured |
Pivot Featured |
|
Max Buy |
AMBA
-
NASDAQ
Ambarella Inc
ELECTRONICS - Semiconductor - Specialized
|
$16.60
|
+0.46
2.85% |
$16.85
|
1,396,793
112.74% of 50 DAV
50 DAV is 1,239,000
|
$19.44
-14.61%
|
7/15/2013
|
$17.87
|
PP = $18.68
|
|
MB = $19.61
|
Most Recent Note - 7/30/2013 6:30:51 PM
G - Violated its 50 DMA line triggering a technical sell signal with a damaging loss backed by above average volume. Color code is changed to green as weakness raised concerns. Only a prompt rebound above that important short-term average would help its outlook improve.
>>> The latest Featured Stock Update with an annotated graph appeared on 7/17/2013. Click here.
View all notes |
Alert me of new notes |
CANSLIM.net Company Profile |
SEC |
Zacks Reports |
StockTalk |
News |
Chart |
Request a new note
C
A N
S L
I M


|
CELG
-
NASDAQ
Celgene Corp
DRUGS - Drug Manufacturers - Major
|
$146.86
|
+1.49
1.02% |
$148.98
|
3,059,537
105.77% of 50 DAV
50 DAV is 2,892,600
|
$146.22
0.44%
|
7/11/2013
|
$133.25
|
PP = $131.92
|
|
MB = $138.52
|
Most Recent Note - 7/29/2013 6:00:46 PM
G - Extended from its prior base after last week's volume-driven gains, it is now consolidating above prior highs defining initial support in the $131 area. See the latest FSU analysis for more details and a new annotated graph.
>>> The latest Featured Stock Update with an annotated graph appeared on 7/29/2013. Click here.
View all notes |
Alert me of new notes |
CANSLIM.net Company Profile |
SEC |
Zacks Reports |
StockTalk |
News |
Chart |
Request a new note
C
A N
S L
I M
|
FLT
-
NYSE
Fleetcor Technologies
DIVERSIFIED SERVICES - Business/Management Services
|
$89.77
|
+0.20
0.22% |
$91.62
|
1,021,247
146.35% of 50 DAV
50 DAV is 697,800
|
$90.92
-1.26%
|
5/29/2013
|
$86.02
|
PP = $85.66
|
|
MB = $89.94
|
Most Recent Note - 7/26/2013 5:04:34 PM
G- Rallied for a new all-time high today with a gain lacking great volume conviction. Found support near its 50 DMA during its latest consolidation.
>>> The latest Featured Stock Update with an annotated graph appeared on 7/18/2013. Click here.
View all notes |
Alert me of new notes |
CANSLIM.net Company Profile |
SEC |
Zacks Reports |
StockTalk |
News |
Chart |
Request a new note
C
A N
S L
I M
|
GNRC
-
NYSE
Generac Hldgs Inc
CONSUMER DURABLES - Electronic Equipment
|
$43.35
|
+0.15
0.35% |
$43.61
|
1,177,615
103.49% of 50 DAV
50 DAV is 1,137,900
|
$44.30
-2.14%
|
7/30/2013
|
$42.60
|
PP = $42.10
|
|
MB = $44.21
|
Most Recent Note - 7/30/2013 6:27:17 PM
Y - Triggered a technical buy signal with a gap up today for a new 52-week high with its considerable gain backed more than 2 times average volume. It was highlighted in yellow with a pivot point based on its 7/17/13 high plus 10 cents while rallying from an advanced "3-weeks tight" base. Reported earnings +64% on +45% sales for the June '13 quarter. Recent quarterly comparisons show impressive sequential acceleration in sales revenues and earnings growth, making it a better match with the C criteria of the fact-based system. See the latest FSU analysis for more details and a new annotated graph.
>>> The latest Featured Stock Update with an annotated graph appeared on 7/30/2013. Click here.
View all notes |
Alert me of new notes |
CANSLIM.net Company Profile |
SEC |
Zacks Reports |
StockTalk |
News |
Chart |
Request a new note
C
A N
S L
I M
|
LOPE
-
NASDAQ
Grand Canyon Education
DIVERSIFIED SERVICES - Education and; Training Services
|
$33.82
|
-1.43
-4.06% |
$37.17
|
1,996,770
481.61% of 50 DAV
50 DAV is 414,600
|
$36.45
-7.22%
|
6/19/2013
|
$31.47
|
PP = $34.17
|
|
MB = $35.88
|
Most Recent Note - 7/30/2013 6:37:23 PM
Y - Reported its second quarter results following today's market close after enduring mild distributional pressure near its 52-week high. Finished still perched above its pivot point and below its "max buy" level. Prior highs in the $34 area define support along with its 50 DMA line.
>>> The latest Featured Stock Update with an annotated graph appeared on 7/19/2013. Click here.
View all notes |
Alert me of new notes |
CANSLIM.net Company Profile |
SEC |
Zacks Reports |
StockTalk |
News |
Chart |
Request a new note
C
A N
S L
I M
|
Symbol/Exchange
Company Name
Industry Group |
PRICE |
CHANGE
(%Change) |
Day High |
Volume
(% DAV)
(% 50 day avg vol) |
52 Wk Hi
% From Hi |
Featured
Date |
Price
Featured |
Pivot Featured |
|
Max Buy |
PCLN
-
NASDAQ
Priceline.Com Inc
INTERNET - Internet Software and Services
|
$875.67
|
-11.19
-1.26% |
$890.17
|
654,307
94.92% of 50 DAV
50 DAV is 689,300
|
$926.40
-5.48%
|
7/8/2013
|
$878.28
|
PP = $847.43
|
|
MB = $889.80
|
Most Recent Note - 7/29/2013 1:52:10 PM
G - Due to report earnings August 8th. Extended from its prior base, enduring distributional pressure while consolidating in a tight range near its high. Prior highs in the $847 area define support to watch on pullbacks.
>>> The latest Featured Stock Update with an annotated graph appeared on 7/25/2013. Click here.
View all notes |
Alert me of new notes |
CANSLIM.net Company Profile |
SEC |
Zacks Reports |
StockTalk |
News |
Chart |
Request a new note
C
A N
S L
I M
|
PRAA
-
NASDAQ
Portfolio Recovery Assoc
DIVERSIFIED SERVICES - Business/Management Services
|
$149.31
|
+5.18
3.59% |
$159.00
|
482,123
408.58% of 50 DAV
50 DAV is 118,000
|
$163.87
-8.89%
|
7/31/2013
|
$154.30
|
PP = $163.97
|
|
MB = $172.17
|
 Most Recent Note - 7/31/2013 1:07:43 PM
Y - Color code is changed to yellow with new pivot point cited based on its 6/17/13 high plus 10 cents. It faces some resistance and needs additional volume-driven gains to trigger a proper new technical buy signal. Gapped up from below its 50 DMA line today, rallying toward its 52-week high with a big gain backed by above average volume. Reported earnings +37% on +24% sales revenues for the Jun '13 quarter. Showing resilience since dropped from the Featured Stocks list on 7/10/13 due to technical weakness.
>>> The latest Featured Stock Update with an annotated graph appeared on 6/25/2013. Click here.
View all notes |
Alert me of new notes |
CANSLIM.net Company Profile |
SEC |
Zacks Reports |
StockTalk |
News |
Chart |
Request a new note
C
A N
S L
I M
|
PRLB
-
NYSE
Proto Labs Inc
MANUFACTURING - Small Tools and Accessories
|
$67.67
|
+1.76
2.67% |
$69.22
|
691,908
168.14% of 50 DAV
50 DAV is 411,500
|
$67.40
0.40%
|
7/29/2013
|
$64.86
|
PP = $67.50
|
|
MB = $70.88
|
Most Recent Note - 7/29/2013 1:59:10 PM
Y - Color code is changed to yellow and a new pivot point is cited based on its 6/28/13 high plus 10 cents. Due to report financial results for the second quarter of 2013 before the opening of the market on Thursday, Aug. 1, 2013. A volume-driven gain above its pivot point may trigger a new (or add-on) technical buy signal. Holding its ground in a tight rage with volume totals cooling while consolidating in an orderly fashion above prior highs and its 50 DMA line defining important support.
>>> The latest Featured Stock Update with an annotated graph appeared on 7/15/2013. Click here.
View all notes |
Alert me of new notes |
CANSLIM.net Company Profile |
SEC |
Zacks Reports |
StockTalk |
News |
Chart |
Request a new note
C
A N
S L
I M
|
QCOR
-
NASDAQ
Questcor Pharmaceuticals
DRUGS - Biotechnology
|
$66.66
|
+14.75
28.41% |
$68.08
|
12,846,055
713.87% of 50 DAV
50 DAV is 1,799,500
|
$53.85
23.79%
|
7/31/2013
|
$66.46
|
PP = $59.01
|
|
MB = $61.96
|
Most Recent Note - 7/31/2013 1:21:52 PM
Y - Color code is changed to yellow with pivot point cited based on its 7/09/12 high plus 10 cents. Considerable "breakaway gap" today hitting new 52-week highs. Recently cleared an orderly flat base. Reported earnings +96% on +64% sales for the Jun '13 quarter. Strong quarterly comparisons with solid sales revenues and earnings increases satisfy the C criteria of the fact-based system. Downward turn in its FY '09 earnings was previously noted as a flaw concerning the A criteria. Rebounded impressively from its September 2012 lows in the $17 area.

There are no Featured Stock Updates™ available for this stock at this time. You may request one by clicking the Request a New Note link below
View all notes |
Alert me of new notes |
CANSLIM.net Company Profile |
SEC |
Zacks Reports |
StockTalk |
News |
Chart |
Request a new note
C
A N
S L
I M
|
RRTS
-
NYSE
Roadrunner Trans Systems
TRANSPORTATION - Air Delivery and Freight Service
|
$30.23
|
-0.13
-0.43% |
$30.61
|
95,885
65.27% of 50 DAV
50 DAV is 146,900
|
$30.50
-0.89%
|
4/3/2013
|
$22.77
|
PP = $23.75
|
|
MB = $24.94
|
Most Recent Note - 7/29/2013 1:34:59 PM
G - Still perched near its 52-week high with volume totals cooling while consolidating in a tight trading range for the past few weeks. Reports results for the Jun '13 quarter on Wednesday, July 31, 2013 after market close.
>>> The latest Featured Stock Update with an annotated graph appeared on 7/22/2013. Click here.
View all notes |
Alert me of new notes |
CANSLIM.net Company Profile |
SEC |
Zacks Reports |
StockTalk |
News |
Chart |
Request a new note
C
A N
S L
I M
|
Symbol/Exchange
Company Name
Industry Group |
PRICE |
CHANGE
(%Change) |
Day High |
Volume
(% DAV)
(% 50 day avg vol) |
52 Wk Hi
% From Hi |
Featured
Date |
Price
Featured |
Pivot Featured |
|
Max Buy |
SFUN
-
NYSE
Soufun Hldgs Ltd Ads A
INTERNET - Internet Information Providers
|
$34.76
|
+1.10
3.27% |
$35.00
|
626,993
187.33% of 50 DAV
50 DAV is 334,700
|
$36.43
-4.58%
|
7/16/2013
|
$29.54
|
PP = $27.90
|
|
MB = $29.30
|
Most Recent Note - 7/29/2013 1:09:36 PM
G - Abruptly retreating from its all-time high today with above average volume behind its loss after getting extended from its latest base with a spurt of volume-driven gains last week. Prior highs in the $28-29 area define initial support to watch.
>>> The latest Featured Stock Update with an annotated graph appeared on 7/16/2013. Click here.
View all notes |
Alert me of new notes |
CANSLIM.net Company Profile |
SEC |
Zacks Reports |
StockTalk |
News |
Chart |
Request a new note
C
A N
S L
I M
|
SSNC
-
NASDAQ
S S & C Technologies
COMPUTER SOFTWARE and SERVICES - Application Software
|
$35.78
|
+0.01
0.03% |
$36.32
|
173,202
45.47% of 50 DAV
50 DAV is 380,900
|
$38.47
-6.99%
|
7/11/2013
|
$35.80
|
PP = $34.54
|
|
MB = $36.27
|
Most Recent Note - 7/26/2013 6:07:04 PM
Y - Loss today with above average volume was a sign of distributional pressure. Color code is changed to yellow after slumping below its "max buy" level. Prior highs in the $34 area define initial support to watch above its 50 DMA line.
>>> The latest Featured Stock Update with an annotated graph appeared on 7/12/2013. Click here.
View all notes |
Alert me of new notes |
CANSLIM.net Company Profile |
SEC |
Zacks Reports |
StockTalk |
News |
Chart |
Request a new note
C
A N
S L
I M
|
SSYS
-
NASDAQ
Stratasys Ltd
COMPUTER HARDWARE - Computer Peripherals
|
$88.65
|
+1.20
1.37% |
$90.00
|
683,949
91.25% of 50 DAV
50 DAV is 749,500
|
$96.44
-8.08%
|
7/8/2013
|
$91.44
|
PP = $95.00
|
|
MB = $99.75
|
Most Recent Note - 7/30/2013 6:33:40 PM
Y - Encountered more distributional pressure and suffered a loss on higher volume while slumping near its 50 DMA line again. More damaging losses could raise greater concerns and trigger worrisome technical sell signals.
>>> The latest Featured Stock Update with an annotated graph appeared on 7/24/2013. Click here.
View all notes |
Alert me of new notes |
CANSLIM.net Company Profile |
SEC |
Zacks Reports |
StockTalk |
News |
Chart |
Request a new note
C
A N
S L
I M
|
STMP
-
NASDAQ
Stamps.Com Inc
INTERNET - Internet Software and Services
|
$39.86
|
+0.07
0.18% |
$40.11
|
359,935
278.37% of 50 DAV
50 DAV is 129,300
|
$42.98
-7.26%
|
7/31/2013
|
$40.00
|
PP = $42.98
|
|
MB = $45.13
|
Most Recent Note - 7/31/2013 1:33:06 PM
Y - Found prompt support at its 50 DMA line when hit with distributional pressure since last noted in the 6/25/13 mid-day report. Did not form a sound new base, however its color code is changed to yellow as a valid secondary buy point exists following its successful test of support up to +5% above its prior high. Reported earnings +68% on +13% sales revenues for the quarter ended March 31, 2013 versus the year ago period, marking a 3rd consecutive quarter above the +25% minimum guideline (C criteria). Due to report earnings after the close, and volume and volatility often increase near earnings news.
>>> The latest Featured Stock Update with an annotated graph appeared on 7/31/2013. Click here.
View all notes |
Alert me of new notes |
CANSLIM.net Company Profile |
SEC |
Zacks Reports |
StockTalk |
News |
Chart |
Request a new note
C
A N
S L
I M
|
VRX
-
NYSE
Valeant Pharmaceuticals
DRUGS - Drug Manufacturers - Other
|
$93.60
|
+2.60
2.86% |
$93.64
|
1,375,561
68.72% of 50 DAV
50 DAV is 2,001,700
|
$96.25
-2.75%
|
4/30/2013
|
$60.24
|
PP = $76.66
|
|
MB = $80.49
|
Most Recent Note - 7/29/2013 1:37:46 PM
Y- Volume totals have still been cooling while consolidating near its 52-week high after completing a new Public Offering on 6/18/13 following recent M&A news. Formed a cup-with-handle base over the past 9 weeks, however no new pivot point has been cited while members were repeatedly cautioned - "Concerns were raised by its Mar '13 earnings report with only a +14% earnings increase, below the +25% minimum guideline (C criteria) for buy candidates."
>>> The latest Featured Stock Update with an annotated graph appeared on 7/23/2013. Click here.
View all notes |
Alert me of new notes |
CANSLIM.net Company Profile |
SEC |
Zacks Reports |
StockTalk |
News |
Chart |
Request a new note
C
A N
S L
I M
|
Symbol/Exchange
Company Name
Industry Group |
PRICE |
CHANGE
(%Change) |
Day High |
Volume
(% DAV)
(% 50 day avg vol) |
52 Wk Hi
% From Hi |
Featured
Date |
Price
Featured |
Pivot Featured |
|
Max Buy |
YNDX
-
NASDAQ
Yandex N V Class A
INTERNET - Internet Information Providers
|
$32.51
|
+0.03
0.09% |
$32.63
|
3,150,656
125.76% of 50 DAV
50 DAV is 2,505,200
|
$33.66
-3.42%
|
7/10/2013
|
$29.29
|
PP = $29.59
|
|
MB = $31.07
|
Most Recent Note - 7/29/2013 1:45:38 PM
G - Retreating form its 52-week high today after getting extended following 2 consecutive volume-driven gains into new high territory. Prior highs in the $28-29 area define near-term support to watch.
>>> The latest Featured Stock Update with an annotated graph appeared on 7/26/2013. Click here.
View all notes |
Alert me of new notes |
CANSLIM.net Company Profile |
SEC |
Zacks Reports |
StockTalk |
News |
Chart |
Request a new note
C
A N
S L
I M
|
|
|
|
THESE ARE NOT BUY RECOMMENDATIONS!
Comments contained in the body of this report are technical
opinions only. The material herein has been obtained
from sources believed to be reliable and accurate, however,
its accuracy and completeness cannot be guaranteed.
This site is not an investment advisor, hence it does
not endorse or recommend any securities or other investments.
Any recommendation contained in this report may not
be suitable for all investors and it is not to be deemed
an offer or solicitation on our part with respect to
the purchase or sale of any securities. All trademarks,
service marks and trade names appearing in this report
are the property of their respective owners, and are
likewise used for identification purposes only.
This report is a service available
only to active Paid Premium Members.
You may opt-out of receiving report notifications
at any time. Questions or comments may be submitted
by writing to Premium Membership Services 665 S.E. 10 Street, Suite 201 Deerfield Beach, FL 33441-5634 or by calling 1-800-965-8307
or 954-785-1121.
|
|
|

