You are not logged in.
This means you
CAN ONLY VIEW reports that were published prior to Monday, April 14, 2025.
You
MUST UPGRADE YOUR MEMBERSHIP if you want to see any current reports.
AFTER MARKET UPDATE - FRIDAY, JULY 31ST, 2009
Previous After Market Report Next After Market Report >>>
|
|
|
|
DOW |
+17.15 |
9,171.61 |
+0.19% |
|
Volume |
1,515,142,020 |
+12% |
|
Volume |
2,294,179,310 |
-12% |
|
NASDAQ |
-5.80 |
1,978.50 |
-0.29% |
|
Advancers |
1,877 |
60% |
|
Advancers |
1,321 |
47% |
|
S&P 500 |
+0.73 |
987.48 |
+0.07% |
|
Decliners |
1,137 |
36% |
|
Decliners |
1,386 |
49% |
|
Russell 2000 |
-1.09 |
556.71 |
-0.20% |
|
52 Wk Highs |
110 |
|
|
52 Wk Highs |
64 |
|
|
S&P 600 |
-0.01 |
295.73 |
-0.00% |
|
52 Wk Lows |
7 |
|
|
52 Wk Lows |
3 |
|
|
 |
Major Averages Post Their Third Consecutive Weekly Gains
Kenneth J. Gruneisen - Passed the CAN SLIM® Master's Exam
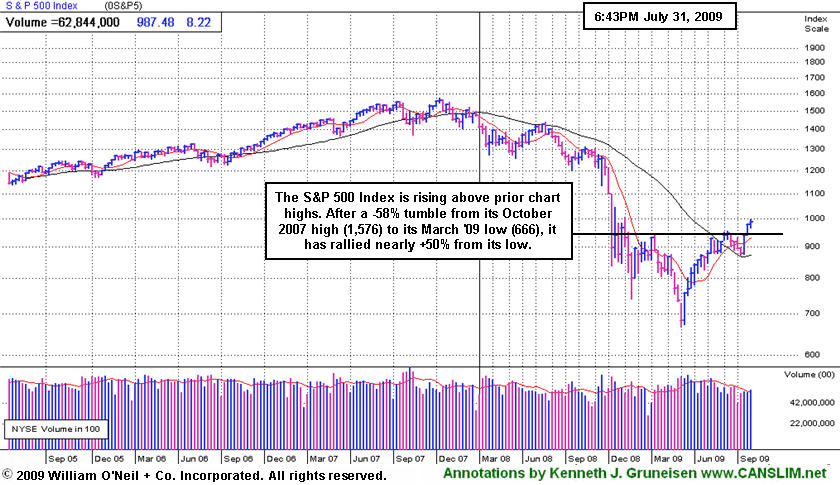
The major averages traded in a tight range, ending mixed and little changed on Friday. Behind modest gains for the S&P 500 Index and Dow Jones Industrial Average the volume total on the NYSE was higher, yet total volume on the Nasdaq exchange was reported lighter than the prior session total as the Nasdaq Composite ended with a small loss. That kind of action is most desirable, as it indicates a bias toward accumulation rather than distribution by large institutional investors. Advancing issues led decliners on the NYSE by a 3-to-2 ratio, but the mix was nearly even on the Nasdaq exchange. There were 20 high-ranked companies from the CANSLIM.net Leaders List that made a new 52-week high and appeared on the CANSLIM.net BreakOuts Page, down from the 42 issues that appeared on the prior session. On both exchanges new 52-week highs still significantly outnumbered 52-week lows, the latter of which remained in the single digits.
The advance Q2 GDP report showed the economy contracted at an annualized rate of -1.0%, marking the 4th consecutive declining quarter. That reading was much improved from a downwardly revised -6.4% (from -5.5%) in the first quarter and it was also better than the expected -1.5% decline. Reaction to the Q2 GDP reading was muted. Personal consumption expenditures, which are the main driver of the economy, fell at an annualized rate of -1.2%. This was worse than the expected decline of -0.5%.
Walt Disney (DIS -4.2%) fell after reporting that its revenue dropped by a larger-than-expected -6.9% year-over-year. Ford (F +8.25%) rose as the House of Representatives passed a plan for the "cash-for-clunkers" programs to get $2 billion in additional funding through September 2010. Neither firm has the fundamentals to be considered a buy under the investment system's guidelines.
Be sure to study the August issue of CANSLIM.net News which will be published this weekend.
PICTURED: The S&P 500 Index surged +7.4% in July, its fifth consecutive monthly gain, rising above prior chart highs and approaching the psychologically important 1,000 level.
Money Management Services - WE FOLLOW THE RULES! DOES YOUR BROKER?
Managing money can be difficult at times. Are you looking for a money manager who follows a proven set of rules? If you are frustrated because your broker/money manager does not follow all of the rules of this powerful investment system, contact us. We have veterans who have been in business for over 20 years who pride themselves on their ability to closely follow all the rules of the investment system in both bull and bear markets. All of our portfolio managers have completed the Master's Program and are highly skilled at using this powerful investment system. You may inquire about having your account professionally managed using this fact-based investment system by clicking HERE. *Accounts over $250,000 please. ** Serious inquiries only.
|
 Kenneth J. Gruneisen started out as a licensed stockbroker in August 1987, a couple of months prior to the historic stock market crash that took the Dow Jones Industrial Average down -22.6% in a single day. He has published daily fact-based fundamental and technical analysis on high-ranked stocks online for two decades. Through FACTBASEDINVESTING.COM, Kenneth provides educational articles, news, market commentary, and other information regarding proven investment systems that work in good times and bad.
Comments contained in the body of this report are technical opinions only and are not necessarily those of Gruneisen Growth Corp. The material herein has been obtained from sources believed to be reliable and accurate, however, its accuracy and completeness cannot be guaranteed. Our firm, employees, and customers may effect transactions, including transactions contrary to any recommendation herein, or have positions in the securities mentioned herein or options with respect thereto. Any recommendation contained in this report may not be suitable for all investors and it is not to be deemed an offer or solicitation on our part with respect to the purchase or sale of any securities. |
|
 |
Commodity-Linked and Financial Shares Rise
Kenneth J. Gruneisen - Passed the CAN SLIM® Master's Exam
The Gold & Silver Index ($XAU +3.95%) was a standout gainer on Friday's mixed session. Energy and financial shares also posted modest gains, with the Oil Services Index ($OSX +0.94%), Integrated Oil Index ($XOI +0.72%), Broker/Dealer Index ($XBD +0.39%), and Bank Index ($BKX +1.13%) posting gains that helped offset weakness in the Healthcare Index ($HMO -1.44%), Biotechnology Index ($BTK -0.89%), and the Networking Index ($NWX -0.59%). The Internet Index ($IIX -0.07%) ended flat and the Semiconductor Index ($SOX +0.23%) edged higher.
Charts courtesy www.stockcharts.com
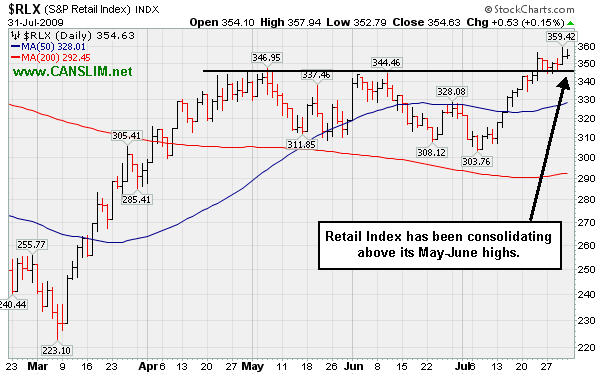
PICTURED: The Retail Index ($RLX +0.15%) has been consolidating above its May-June highs.
| Oil Services |
$OSX |
170.55 |
+1.58 |
+0.94% |
+40.50% |
| Healthcare |
$HMO |
1,173.29 |
-17.09 |
-1.44% |
+22.19% |
| Integrated Oil |
$XOI |
961.20 |
+6.86 |
+0.72% |
-1.89% |
| Semiconductor |
$SOX |
301.74 |
+0.69 |
+0.23% |
+42.22% |
| Networking |
$NWX |
195.87 |
-1.17 |
-0.59% |
+36.12% |
| Internet |
$IIX |
201.17 |
-0.15 |
-0.07% |
+50.38% |
| Broker/Dealer |
$XBD |
108.87 |
+0.42 |
+0.39% |
+40.53% |
| Retail |
$RLX |
354.63 |
+0.53 |
+0.15% |
+26.99% |
| Gold & Silver |
$XAU |
148.62 |
+5.65 |
+3.95% |
+20.00% |
| Bank |
$BKX |
40.44 |
+0.45 |
+1.13% |
-8.75% |
| Biotech |
$BTK |
870.36 |
-7.82 |
-0.89% |
+34.49% |
|
|
|
 |
Poor Action Follows Earnings and News Of CEO's Retirement
Kenneth J. Gruneisen - Passed the CAN SLIM® Master's Exam
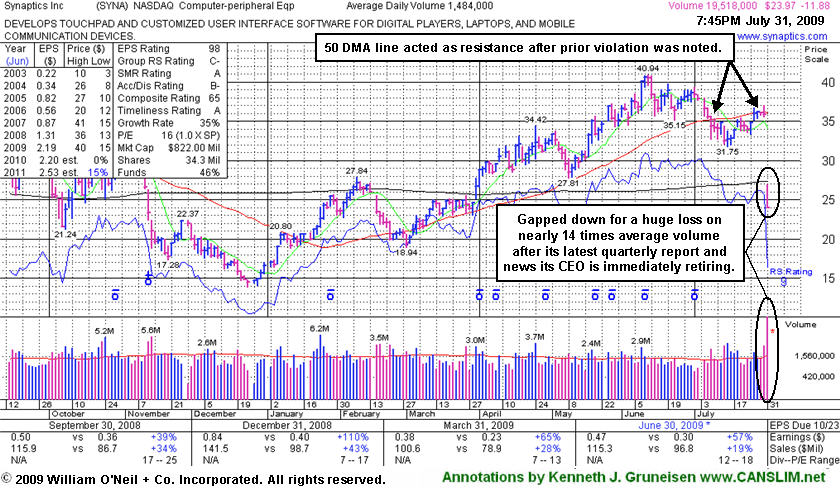
Synaptics Inc. (SYNA -$11.88 or -33.14% to $23.97) gapped down for a huge loss on 13 times average volume after its latest quarterly report and news its CEO is immediately retiring. Its 50-day moving average (DMA) line acted as resistance after the prior violation was noted. Prior reviews in this Featured Stock Update section included cautionary remarks under telling headlines such as "Relative Strength Has Slumped While Trading Under 50 Day Average" (7/22/2009) and "50 Day Average and Upward Trendline Violations This Week Raised Concerns" (7/10/2009). It was stated, "For its outlook to improve, technically, it still needs to repair the 50 DMA violation and show signs of institutional demand. It found support near prior chart highs after 7 session losing streak and a worrisome gap down on 7/14/09. Deterioration under its $31.75 low on July 15th would raise raise more serious concerns and trigger additional technical sell signals. For now it should remain on an active watch list in the event it shows strength and completes a new sound base."
SYNA is being dropped from the Featured Stocks list tonight based upon its poor action. It was first featured in yellow in the May 18, 2009 Mid-Day BreakOuts Report (read here).
|
|
|
Color Codes Explained :
Y - Better candidates highlighted by our
staff of experts.
G - Previously featured
in past reports as yellow but may no longer be buyable under the
guidelines.
***Last / Change / Volume quote data in this table corresponds with the timestamp on the note***
Symbol/Exchange
Company Name
Industry Group |
Last |
Chg. |
Vol
% DAV |
Date Featured |
Price Featured |
Latest Pivot Point
Featured |
Status |
| Latest Max Buy Price |
CPLA
- NASDAQ
Capella Education Co
DIVERSIFIED SERVICES - Education and Training Services
|
$64.36
|
-0.11
|
197,393
88% DAV
223,364
|
7/9/2009
(Date
Featured) |
$59.69
(Price
Featured) |
PP = $62.06 |
Y |
| MB = $65.16 |
Most Recent Note - 7/31/2009 5:31:50 PM
Y - Perched less than -1% from its 52-week high. On 7/28/09 it reported solid results for the quarter ended June 30, 2009, with a +21% increase in sales revenues (accelerating) and +51% earnings per share, and it technically gapped up and traded more than the +50% above average volume guideline as it rose above its pivot point. Featured in yellow in the 7/09/09 Mid-Day BreakOuts Report (read here). The group has shown some leadership, yet currently has a D- and 13 for Relative Strength Rating/Ranks. CPLA is a high-ranked leader in the Commercial Services-Schools Group. Its small supply of only 13.9 million shares in the float could contribute to greater price volatility in the event of institutional accumulation or distribution. The number of top-rated funds owning an interest rose from 91 in Sept '08, to 135 as of March '09, which is reassuring with respect to the I criteria. It has a very good earnings history that satisfies the C & A criteria, while recent quarters showed steady sales revenues increases in the +17-18% range.
>>> The latest Featured Stock Update with an annotated graph appeared on 7/20/2009. click here.
|
|
C
A
S
I |
News |
Chart |
SEC
View all notes Alert
me of new notes
Company
Profile
|
GMCR
- NASDAQ
Green Mtn Coffee Roastrs
FOOD & BEVERAGE - Processed & Packaged Goods
|
$71.48
|
+2.71
|
1,242,360
86% DAV
1,439,858
|
7/17/2009
(Date
Featured) |
$60.15
(Price
Featured) |
PP = $63.79 |
G |
| MB = $66.98 |
Most Recent Note - 7/31/2009 1:58:39 PM
G - At all-time highs today following a positive reversal and rally to new highs on 7/30/09 after initially gapping down following another strong quarterly financial report. Prior highs in the $62-63 area are initial chart support to watch above its 50 DMA line. Do not be confused by the 3:2 stock split effective 6/09/09. GMCR traded up more than +168% since appearing with an annotated graph under the headline "It May Soon Be Time To Go Green" when featured in the January 2009 CANSLIM.net News (read here).
>>> The latest Featured Stock Update with an annotated graph appeared on 7/30/2009. click here.
|
|
C
A
S
I |
News |
Chart |
SEC
View all notes Alert
me of new notes
Company
Profile
|
HMSY
- NASDAQ
H M S Holdings Corp
COMPUTER SOFTWARE & SERVICES - Healthcare Information Service
|
$38.40
|
-2.62
|
1,888,391
537% DAV
351,671
|
2/20/2009
(Date
Featured) |
$34.08
(Price
Featured) |
PP = $38.38 |
G |
| MB = $40.30 |
Most Recent Note - 7/31/2009 5:39:36 PM
G - Gapped down today after its latest quarterly report, violating its 50 DMA line and triggering technical sell signals, yet it closed in the middle of its range. This high-ranked Commercial Services - Healthcare firm's prior highs in the $38 area are an important support level. A gap up gain on 6/16/09 with heavy volume triggered a technical buy signal.
>>> The latest Featured Stock Update with an annotated graph appeared on 7/24/2009. click here.
|
|
C
A
S
I |
News |
Chart |
SEC
View all notes Alert
me of new notes
Company
Profile
|
NTES
- NASDAQ
Netease Inc Adr
INTERNET - Internet Information Providers
|
$44.06
|
+1.23
|
1,765,724
71% DAV
2,478,383
|
7/17/2009
(Date
Featured) |
$39.29
(Price
Featured) |
PP = $38.74 |
G |
| MB = $40.68 |
Most Recent Note - 7/31/2009 5:41:47 PM
G - Closed at it best level ever after a 4th consecutive gain on light volume. Well above prior chart highs in the $38 area, an important support level to watch. A recent series of 10 consecutive gains was capped off with a considerable gain on 7/22/09 with very heavy volume that lifted it well above its max buy level. It got extended from its latest base. On 7/17/09 it broke out from a 5-week flat base with +44% above average volume behind its gain. First featured at $26.75 in the 3/31/09 CANSLIM.net Mid-Day Breakouts Report (read here). This high-ranked Chinese Internet - Content firm was also summarized in greater detail including an annotated graph in the April 2009 issue of CANSLIM.net News (read here).
>>> The latest Featured Stock Update with an annotated graph appeared on 7/23/2009. click here.
|
|
C
A
S
I |
News |
Chart |
SEC
View all notes Alert
me of new notes
Company
Profile
|
NVEC
- NASDAQ
N V E Corp
ELECTRONICS - Semiconductor - Specialized
|
$53.73
|
+0.19
|
49,825
53% DAV
94,325
|
3/13/2009
(Date
Featured) |
$33.85
(Price
Featured) |
PP = $49.60 |
G |
| MB = $52.08 |
Most Recent Note - 7/31/2009 5:44:51 PM
G - Volume has been drying up while consolidating in a tight range since its 7/23/09 breakout. Patience may allow for shares to be accumulated on pullbacks, and prior highs are now an important support level. Featured in the 7/23/09 Mid-Day BreakOuts Report (read here) after it gapped up for a considerable gain on heavy volume following news of stronger sales revenues (+41%) and solid earnings increases for the quarter ended June 30, 2009. The technical action was described as a "breakaway gap" from a valid ascending base. Quarterly sales revenues in the 6 million dollar range are still rather minuscule, leaving concerns.
>>> The latest Featured Stock Update with an annotated graph appeared on 7/17/2009. click here.
|
|
C
A
S
I |
News |
Chart |
SEC
View all notes Alert
me of new notes
Company
Profile
|
PEGA
- NASDAQ
Pegasystems Inc
COMPUTER SOFTWARE & SERVICES - Business Software & Services
|
$28.30
|
-0.76
|
394,585
153% DAV
258,622
|
7/29/2009
(Date
Featured) |
$27.53
(Price
Featured) |
PP = $27.49 |
Y |
| MB = $28.86 |
Most Recent Note - 7/31/2009 5:45:46 PM
Y - Consolidating under its max buy level today, its color code was changed to yellow. Featured in in the 7/29/09 mid-day report (read here) during the course of its considerable gain on heavy volume 3 times its average for a new 52-week high. There were no news headlines to be found as this software firm triggered a technical buy signal by breaking out from a third stage, 8-week "double bottom" type base. The previously noted downturn in annual earnings (the A criteria) from 2003 to 2006 has been followed by a solid turn around and big earnings increases in '07 and '08, and Street expectations for '09 are calling for well above +25% growth.
>>> The latest Featured Stock Update with an annotated graph appeared on 7/29/2009. click here.
|
|
C
A
S
I |
News |
Chart |
SEC
View all notes Alert
me of new notes
Company
Profile
|
TNDM
- NASDAQ
Tandem Diabetes Care Inc
TELECOMMUNICATIONS - Wireless Communications
|
$31.00
|
+0.60
|
380,135
42% DAV
900,805
|
3/2/2009
(Date
Featured) |
$18.89
(Price
Featured) |
PP = $29.85 |
G |
| MB = $31.34 |
Most Recent Note - 7/31/2009 5:49:29 PM
G - Quietly consolidating in recent weeks above its 50 DMA line, less than -5% off its all-time high. Building on a choppy base since its June 2nd high of $32.57 was reached. Subsequent deterioration below its 50 DMA average and recent lows would raise concerns and trigger sell signals. It traded up as much as +72.42% since first featured at $18.89 in the 3/02/09 Mid-Day BreakOuts Report (read here).
>>> The latest Featured Stock Update with an annotated graph appeared on 7/21/2009. click here.
|
|
C
A
S
I |
News |
Chart |
SEC
View all notes Alert
me of new notes
Company
Profile
|
UTA
-
|
$13.97
|
+0.53
|
595,641
156% DAV
381,824
|
7/28/2009
(Date
Featured) |
$12.87
(Price
Featured) |
PP = $12.70 |
G |
| MB = $13.34 |
Most Recent Note - 7/31/2009 5:50:36 PM
G - Gapped up today and rallied for a new high close. Its 2 prior sessions were marked by heavy volume and a lack of progress -a worrisome sign of "churning" distributional action. Its color code was changed to green after rising above its "max buy" level. Strong action prompted it to be featured in yellow with pivot point and max buy levels noted in the 7/28/09 mid-day breakouts report (read here), with additional analysis included in the after market update (read here). This Chinese provider of airline tickets and travel related services gapped up on 7/28/09, rising from a choppy 6-week base with a considerable gain on very heavy volume.
>>> The latest Featured Stock Update with an annotated graph appeared on 7/28/2009. click here.
|
|
C
A
S
I |
News |
Chart |
SEC
View all notes Alert
me of new notes
Company
Profile
|
|
|
|
THESE ARE NOT BUY RECOMMENDATIONS!
Comments contained in the body of this report are technical
opinions only. The material herein has been obtained
from sources believed to be reliable and accurate, however,
its accuracy and completeness cannot be guaranteed.
This site is not an investment advisor, hence it does
not endorse or recommend any securities or other investments.
Any recommendation contained in this report may not
be suitable for all investors and it is not to be deemed
an offer or solicitation on our part with respect to
the purchase or sale of any securities. All trademarks,
service marks and trade names appearing in this report
are the property of their respective owners, and are
likewise used for identification purposes only.
This report is a service available
only to active Paid Premium Members.
You may opt-out of receiving report notifications
at any time. Questions or comments may be submitted
by writing to Premium Membership Services 665 S.E. 10 Street, Suite 201 Deerfield Beach, FL 33441-5634 or by calling 1-800-965-8307
or 954-785-1121.
|
|
|

