You are not logged in.
This means you
CAN ONLY VIEW reports that were published prior to Monday, April 14, 2025.
You
MUST UPGRADE YOUR MEMBERSHIP if you want to see any current reports.
AFTER MARKET UPDATE - TUESDAY, JULY 30TH, 2013
Previous After Market Report Next After Market Report >>>
|
|
|
|
DOW |
-1.38 |
15,520.59 |
-0.01% |
|
Volume |
677,565,460 |
+17% |
|
Volume |
1,706,203,170 |
+19% |
|
NASDAQ |
+17.33 |
3,616.47 |
+0.48% |
|
Advancers |
1,525 |
49% |
|
Advancers |
1,311 |
50% |
|
S&P 500 |
+0.63 |
1,685.96 |
+0.04% |
|
Decliners |
1,453 |
47% |
|
Decliners |
1,197 |
46% |
|
Russell 2000 |
+2.85 |
1,043.51 |
+0.27% |
|
52 Wk Highs |
118 |
|
|
52 Wk Highs |
123 |
|
|
S&P 600 |
+1.63 |
586.52 |
+0.28% |
|
52 Wk Lows |
40 |
|
|
52 Wk Lows |
17 |
|
|
 |
Breadth Mixed While Nasdaq Leads Indices Higher
Kenneth J. Gruneisen - Passed the CAN SLIM® Master's Exam
On Tuesday the Nasdaq Composite Index posted a gain while its peers finished virtually unchanged. The Dow gave back a 72 point advance to close down a point at 15,520. Volume totals were reported higher than the prior session totals on the Nasdaq exchange and on the NYSE. Breadth was even as advancers only narrowly outnumbered decliners on the Nasdaq exchange and on the NYSE. There were 48 high-ranked companies from the CANSLIM.net Leaders List made new 52-week highs and appeared on the CANSLIM.net BreakOuts Page, up from the prior session total of 34 stocks. The list of stocks hitting new 52-week highs outnumbered new 52-week lows on both the NYSE and the Nasdaq exchange. There were gains for 7 of the 13 high-ranked companies currently included on the Featured Stocks Page.
Investors are awaiting the conclusion of the Fed's policy meeting. Market action was also attributed to investors digesting the latest economic and earnings releases. Before the open, a report showed May home prices increased by the most in more than seven years. A separate report revealed consumer confidence declined in July.
On the earnings front, Goodyear Tire & Rubber Co (GT +8.92%) climbed as its quarterly results topped analyst projections. Coach Inc(COH -7.87%) retreated after the handbag maker reported a -12% decline in profits. Tech and industrials were the best performing sectors on the session. Rockwell Automation Inc (ROK +5.61%) advanced following its increased full-year forecast. Telecom was the worst performing group with Verizon Communications Inc (VZ -2.08%) finishing lower. Agricultural chemical maker The Mosaic Co (MOS -17.28%) tumbled after a Russian company said it would end limits on potash production.
Treasuries were little changed with the 10-year note flat to yield 2.60%.
The market (M criteria) has flashed substantial strength and leadership. Now in a confirmed rally, odds are considered favorable for investors' success with new buying efforts. Investors should be disciplined and selective while looking to be proactive and focused exclusively on the individual leaders best matching the winning models of the fact-based investment system. Study the companies on the CANSLIM.net Featured Stocks Page - a page showing the most action-worthy candidates' latest notes and links to additional resources including detailed analysis with data-packed graphs which are annotated by a Certified expert. The Premium Member Homepage - includes "dynamic archives" to all prior pay reports published. Watch for an announcement via email concerning the next WEBCAST.
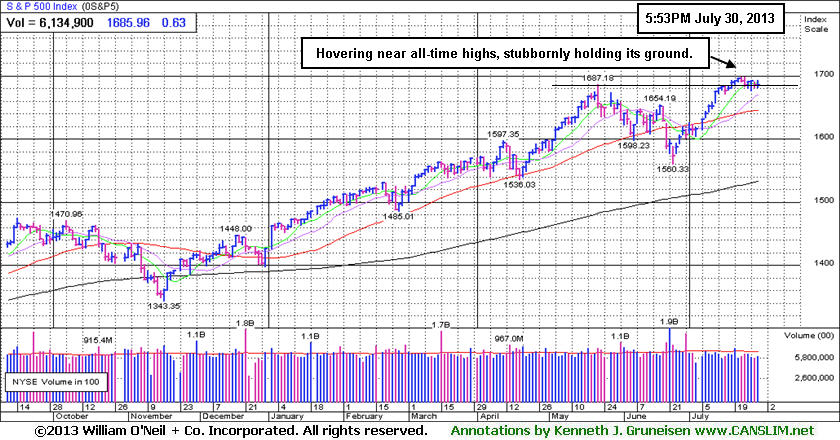
PICTURED: The benchmark S&P 500 Index is consolidating in a tight range near its all-time highs with an +18.2% year-to-date gain.
|
 Kenneth J. Gruneisen started out as a licensed stockbroker in August 1987, a couple of months prior to the historic stock market crash that took the Dow Jones Industrial Average down -22.6% in a single day. He has published daily fact-based fundamental and technical analysis on high-ranked stocks online for two decades. Through FACTBASEDINVESTING.COM, Kenneth provides educational articles, news, market commentary, and other information regarding proven investment systems that work in good times and bad.
Comments contained in the body of this report are technical opinions only and are not necessarily those of Gruneisen Growth Corp. The material herein has been obtained from sources believed to be reliable and accurate, however, its accuracy and completeness cannot be guaranteed. Our firm, employees, and customers may effect transactions, including transactions contrary to any recommendation herein, or have positions in the securities mentioned herein or options with respect thereto. Any recommendation contained in this report may not be suitable for all investors and it is not to be deemed an offer or solicitation on our part with respect to the purchase or sale of any securities. |
|
 |
Tech Sector Rose and Defensive Groups Fell
Kenneth J. Gruneisen - Passed the CAN SLIM® Master's Exam
The Nasdaq Composite Index outpaced its peers as the tech sector saw unanimous gains from the Internet Index ($IIX +0.67%), Semiconductor Index ($SOX +1.20%), Biotechnology Index ($BTK +1.21%), and the Networking Index ($NWX +2.66%). The influential Broker/Dealer Index ($XBD -0.13%), Bank Index ($BKX +0.08%), and Retail Index ($RLX +0.10%) showed no decisiveness. Energy-related shares were also quiet as the Integrated Oil Index ($XOI -0.51%) edged lower while the Oil Services Index ($OSX +0.12%) finished with a tiny gain. Meanwhile, defensive groups had a negative bias as the Healthcare Index ($HMO -0.89%) and the Gold & Silver Index ($XAU -0.84%) both lost ground.
Charts courtesy www.stockcharts.com
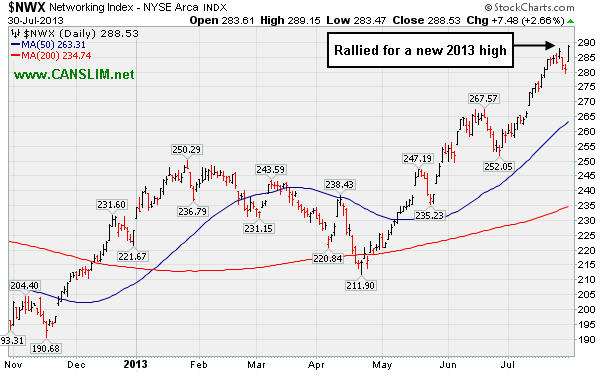
PICTURED: The Networking Index ($NWX +2.66%) powered to a new 2013 high with a standout gain leading the tech sector higher.
| Oil Services |
$OSX |
260.53 |
+0.32 |
+0.12% |
+18.34% |
| Healthcare |
$HMO |
3,351.42 |
-30.26 |
-0.89% |
+33.30% |
| Integrated Oil |
$XOI |
1,385.96 |
-7.17 |
-0.51% |
+11.61% |
| Semiconductor |
$SOX |
475.59 |
+5.62 |
+1.20% |
+23.83% |
| Networking |
$NWX |
288.53 |
+7.48 |
+2.66% |
+27.36% |
| Internet |
$IIX |
404.84 |
+2.69 |
+0.67% |
+23.81% |
| Broker/Dealer |
$XBD |
132.53 |
-0.17 |
-0.13% |
+40.49% |
| Retail |
$RLX |
834.00 |
+0.84 |
+0.10% |
+27.71% |
| Gold & Silver |
$XAU |
99.18 |
-0.84 |
-0.84% |
-40.11% |
| Bank |
$BKX |
65.44 |
+0.05 |
+0.08% |
+27.61% |
| Biotech |
$BTK |
2,139.28 |
+25.51 |
+1.21% |
+38.28% |
|
|
|
 |
Gapped Up Following Strong Earnings News
Kenneth J. Gruneisen - Passed the CAN SLIM® Master's Exam
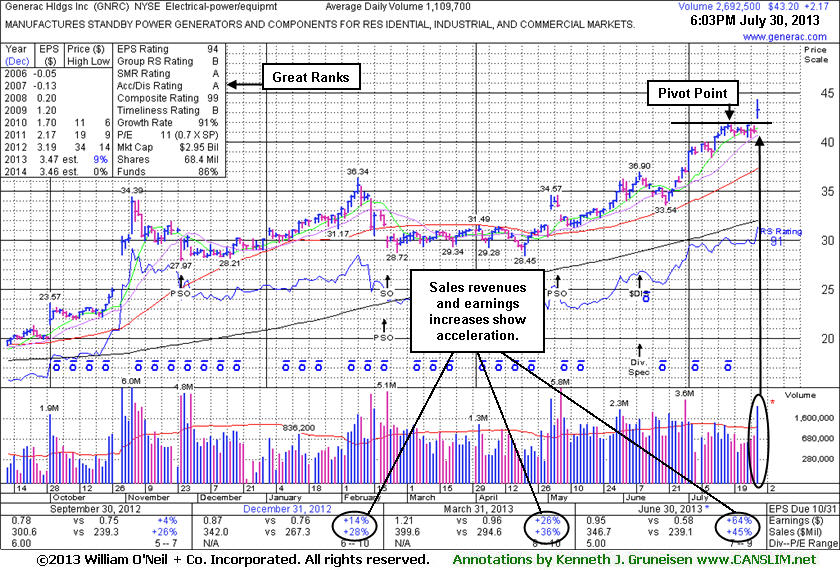
Generac Hldgs Inc (GNRC +$2.17 or +5.29% to $43.20) was highlighted in yellow with pivot point based on its 7/17/13 high plus 10 cents with an annotated weekly graph in the earlier mid-day report (read here). The daily graph annotated below shows how the high-ranked Electrical - Power/Equipment firm gapped up today and hit a new 52-week high with a considerable gain backed by more than 2 times average volume, triggering a technical buy signal while rallying from an advanced "3-weeks tight" base. It just reported earnings +64% on +45% sales for the June '13 quarter versus the year ago period. Recent quarterly comparisons show impressive sequential acceleration in its sales revenues and earnings growth, making it a better match with the C criteria of the fact-based system. Previously noted consensus estimates calling for FY '13 earnings growth of +9% and FY '14 at 0%, and its currently low P/E valuation (0.7 X SP) suggest a timid outlook for future growth, which is cause for some concern.
The number of top-rated funds owning its shares rose from 201 in Dec '12 to 346 in Jun '13, an encouraging sign concerning the I criteria. Its current Up/Down Volume Ratio of 1.7 is also an unbiased indication that it shares have been under accumulation over the past 50 days. Disciplined investors avoid chasing stocks if they get extended more than +5% above their pivot point, and they always limit losses by selling if any stock falls more than -7% from their purchase price.
|
|
|
Color Codes Explained :
Y - Better candidates highlighted by our
staff of experts.
G - Previously featured
in past reports as yellow but may no longer be buyable under the
guidelines.
***Last / Change / Volume data in this table is the closing quote data***
Symbol/Exchange
Company Name
Industry Group |
PRICE |
CHANGE
(%Change) |
Day High |
Volume
(% DAV)
(% 50 day avg vol) |
52 Wk Hi
% From Hi |
Featured
Date |
Price
Featured |
Pivot Featured |
|
Max Buy |
AMBA
-
NASDAQ
Ambarella Inc
ELECTRONICS - Semiconductor - Specialized
|
$16.14
|
-1.38
-7.88% |
$17.53
|
2,271,884
188.66% of 50 DAV
50 DAV is 1,204,200
|
$19.44
-16.97%
|
7/15/2013
|
$17.87
|
PP = $18.68
|
|
MB = $19.61
|
 Most Recent Note - 7/30/2013 6:30:51 PM
G - Violated its 50 DMA line triggering a technical sell signal with a damaging loss backed by above average volume. Color code is changed to green as weakness raised concerns. Only a prompt rebound above that important short-term average would help its outlook improve.
>>> The latest Featured Stock Update with an annotated graph appeared on 7/17/2013. Click here.
View all notes |
Alert me of new notes |
CANSLIM.net Company Profile |
SEC |
Zacks Reports |
StockTalk |
News |
Chart |
Request a new note
C
A N
S L
I M


|
CELG
-
NASDAQ
Celgene Corp
DRUGS - Drug Manufacturers - Major
|
$145.37
|
+2.71
1.90% |
$146.22
|
2,863,116
98.13% of 50 DAV
50 DAV is 2,917,700
|
$144.15
0.85%
|
7/11/2013
|
$133.25
|
PP = $131.92
|
|
MB = $138.52
|
Most Recent Note - 7/29/2013 6:00:46 PM
G - Extended from its prior base after last week's volume-driven gains, it is now consolidating above prior highs defining initial support in the $131 area. See the latest FSU analysis for more details and a new annotated graph.
>>> The latest Featured Stock Update with an annotated graph appeared on 7/29/2013. Click here.
View all notes |
Alert me of new notes |
CANSLIM.net Company Profile |
SEC |
Zacks Reports |
StockTalk |
News |
Chart |
Request a new note
C
A N
S L
I M
|
FLT
-
NYSE
Fleetcor Technologies
DIVERSIFIED SERVICES - Business/Management Services
|
$89.57
|
+0.45
0.50% |
$90.04
|
360,033
50.93% of 50 DAV
50 DAV is 706,900
|
$90.92
-1.48%
|
5/29/2013
|
$86.02
|
PP = $85.66
|
|
MB = $89.94
|
Most Recent Note - 7/26/2013 5:04:34 PM
G- Rallied for a new all-time high today with a gain lacking great volume conviction. Found support near its 50 DMA during its latest consolidation.
>>> The latest Featured Stock Update with an annotated graph appeared on 7/18/2013. Click here.
View all notes |
Alert me of new notes |
CANSLIM.net Company Profile |
SEC |
Zacks Reports |
StockTalk |
News |
Chart |
Request a new note
C
A N
S L
I M
|
GNRC
-
NYSE
Generac Hldgs Inc
CONSUMER DURABLES - Electronic Equipment
|
$43.20
|
+2.17
5.29% |
$44.30
|
2,692,538
242.64% of 50 DAV
50 DAV is 1,109,700
|
$42.00
2.86%
|
7/30/2013
|
$42.60
|
PP = $42.10
|
|
MB = $44.21
|
Most Recent Note - 7/30/2013 6:27:17 PM
Y - Triggered a technical buy signal with a gap up today for a new 52-week high with its considerable gain backed more than 2 times average volume. It was highlighted in yellow with a pivot point based on its 7/17/13 high plus 10 cents while rallying from an advanced "3-weeks tight" base. Reported earnings +64% on +45% sales for the June '13 quarter. Recent quarterly comparisons show impressive sequential acceleration in sales revenues and earnings growth, making it a better match with the C criteria of the fact-based system. See the latest FSU analysis for more details and a new annotated graph.
>>> The latest Featured Stock Update with an annotated graph appeared on 7/30/2013. Click here.
View all notes |
Alert me of new notes |
CANSLIM.net Company Profile |
SEC |
Zacks Reports |
StockTalk |
News |
Chart |
Request a new note
C
A N
S L
I M
|
LOPE
-
NASDAQ
Grand Canyon Education
DIVERSIFIED SERVICES - Education and; Training Services
|
$35.25
|
-0.24
-0.68% |
$35.90
|
544,055
131.32% of 50 DAV
50 DAV is 414,300
|
$36.45
-3.29%
|
6/19/2013
|
$31.47
|
PP = $34.17
|
|
MB = $35.88
|
Most Recent Note - 7/30/2013 6:37:23 PM
Y - Reported its second quarter results following today's market close after enduring mild distributional pressure near its 52-week high. Finished still perched above its pivot point and below its "max buy" level. Prior highs in the $34 area define support along with its 50 DMA line.
>>> The latest Featured Stock Update with an annotated graph appeared on 7/19/2013. Click here.
View all notes |
Alert me of new notes |
CANSLIM.net Company Profile |
SEC |
Zacks Reports |
StockTalk |
News |
Chart |
Request a new note
C
A N
S L
I M
|
Symbol/Exchange
Company Name
Industry Group |
PRICE |
CHANGE
(%Change) |
Day High |
Volume
(% DAV)
(% 50 day avg vol) |
52 Wk Hi
% From Hi |
Featured
Date |
Price
Featured |
Pivot Featured |
|
Max Buy |
PCLN
-
NASDAQ
Priceline.Com Inc
INTERNET - Internet Software and Services
|
$886.86
|
-1.25
-0.14% |
$898.73
|
484,049
69.64% of 50 DAV
50 DAV is 695,100
|
$926.40
-4.27%
|
7/8/2013
|
$878.28
|
PP = $847.43
|
|
MB = $889.80
|
Most Recent Note - 7/29/2013 1:52:10 PM
G - Due to report earnings August 8th. Extended from its prior base, enduring distributional pressure while consolidating in a tight range near its high. Prior highs in the $847 area define support to watch on pullbacks.
>>> The latest Featured Stock Update with an annotated graph appeared on 7/25/2013. Click here.
View all notes |
Alert me of new notes |
CANSLIM.net Company Profile |
SEC |
Zacks Reports |
StockTalk |
News |
Chart |
Request a new note
C
A N
S L
I M
|
PRLB
-
NYSE
Proto Labs Inc
MANUFACTURING - Small Tools and Accessories
|
$65.91
|
+0.95
1.46% |
$67.00
|
418,058
101.45% of 50 DAV
50 DAV is 412,100
|
$67.40
-2.21%
|
7/29/2013
|
$64.86
|
PP = $67.50
|
|
MB = $70.88
|
Most Recent Note - 7/29/2013 1:59:10 PM
Y - Color code is changed to yellow and a new pivot point is cited based on its 6/28/13 high plus 10 cents. Due to report financial results for the second quarter of 2013 before the opening of the market on Thursday, Aug. 1, 2013. A volume-driven gain above its pivot point may trigger a new (or add-on) technical buy signal. Holding its ground in a tight rage with volume totals cooling while consolidating in an orderly fashion above prior highs and its 50 DMA line defining important support.
>>> The latest Featured Stock Update with an annotated graph appeared on 7/15/2013. Click here.
View all notes |
Alert me of new notes |
CANSLIM.net Company Profile |
SEC |
Zacks Reports |
StockTalk |
News |
Chart |
Request a new note
C
A N
S L
I M
|
RRTS
-
NYSE
Roadrunner Trans Systems
TRANSPORTATION - Air Delivery and Freight Service
|
$30.36
|
+0.15
0.50% |
$30.42
|
66,391
44.71% of 50 DAV
50 DAV is 148,500
|
$30.50
-0.46%
|
4/3/2013
|
$22.77
|
PP = $23.75
|
|
MB = $24.94
|
Most Recent Note - 7/29/2013 1:34:59 PM
G - Still perched near its 52-week high with volume totals cooling while consolidating in a tight trading range for the past few weeks. Reports results for the Jun '13 quarter on Wednesday, July 31, 2013 after market close.
>>> The latest Featured Stock Update with an annotated graph appeared on 7/22/2013. Click here.
View all notes |
Alert me of new notes |
CANSLIM.net Company Profile |
SEC |
Zacks Reports |
StockTalk |
News |
Chart |
Request a new note
C
A N
S L
I M
|
SFUN
-
NYSE
Soufun Hldgs Ltd Ads A
INTERNET - Internet Information Providers
|
$33.66
|
-0.52
-1.52% |
$34.57
|
305,031
91.52% of 50 DAV
50 DAV is 333,300
|
$36.43
-7.60%
|
7/16/2013
|
$29.54
|
PP = $27.90
|
|
MB = $29.30
|
Most Recent Note - 7/29/2013 1:09:36 PM
G - Abruptly retreating from its all-time high today with above average volume behind its loss after getting extended from its latest base with a spurt of volume-driven gains last week. Prior highs in the $28-29 area define initial support to watch.
>>> The latest Featured Stock Update with an annotated graph appeared on 7/16/2013. Click here.
View all notes |
Alert me of new notes |
CANSLIM.net Company Profile |
SEC |
Zacks Reports |
StockTalk |
News |
Chart |
Request a new note
C
A N
S L
I M
|
SSNC
-
NASDAQ
S S & C Technologies
COMPUTER SOFTWARE and SERVICES - Application Software
|
$35.77
|
+0.13
0.36% |
$36.00
|
188,489
48.43% of 50 DAV
50 DAV is 389,200
|
$38.47
-7.02%
|
7/11/2013
|
$35.80
|
PP = $34.54
|
|
MB = $36.27
|
Most Recent Note - 7/26/2013 6:07:04 PM
Y - Loss today with above average volume was a sign of distributional pressure. Color code is changed to yellow after slumping below its "max buy" level. Prior highs in the $34 area define initial support to watch above its 50 DMA line.
>>> The latest Featured Stock Update with an annotated graph appeared on 7/12/2013. Click here.
View all notes |
Alert me of new notes |
CANSLIM.net Company Profile |
SEC |
Zacks Reports |
StockTalk |
News |
Chart |
Request a new note
C
A N
S L
I M
|
Symbol/Exchange
Company Name
Industry Group |
PRICE |
CHANGE
(%Change) |
Day High |
Volume
(% DAV)
(% 50 day avg vol) |
52 Wk Hi
% From Hi |
Featured
Date |
Price
Featured |
Pivot Featured |
|
Max Buy |
SSYS
-
NASDAQ
Stratasys Ltd
COMPUTER HARDWARE - Computer Peripherals
|
$87.45
|
-4.87
-5.28% |
$92.96
|
1,254,828
170.42% of 50 DAV
50 DAV is 736,300
|
$96.44
-9.32%
|
7/8/2013
|
$91.44
|
PP = $95.00
|
|
MB = $99.75
|
Most Recent Note - 7/30/2013 6:33:40 PM
Y - Encountered more distributional pressure and suffered a loss on higher volume while slumping near its 50 DMA line again. More damaging losses could raise greater concerns and trigger worrisome technical sell signals.
>>> The latest Featured Stock Update with an annotated graph appeared on 7/24/2013. Click here.
View all notes |
Alert me of new notes |
CANSLIM.net Company Profile |
SEC |
Zacks Reports |
StockTalk |
News |
Chart |
Request a new note
C
A N
S L
I M
|
VRX
-
NYSE
Valeant Pharmaceuticals
DRUGS - Drug Manufacturers - Other
|
$91.00
|
-0.70
-0.76% |
$92.73
|
999,174
49.71% of 50 DAV
50 DAV is 2,010,200
|
$96.25
-5.45%
|
4/30/2013
|
$60.24
|
PP = $76.66
|
|
MB = $80.49
|
Most Recent Note - 7/29/2013 1:37:46 PM
Y- Volume totals have still been cooling while consolidating near its 52-week high after completing a new Public Offering on 6/18/13 following recent M&A news. Formed a cup-with-handle base over the past 9 weeks, however no new pivot point has been cited while members were repeatedly cautioned - "Concerns were raised by its Mar '13 earnings report with only a +14% earnings increase, below the +25% minimum guideline (C criteria) for buy candidates."
>>> The latest Featured Stock Update with an annotated graph appeared on 7/23/2013. Click here.
View all notes |
Alert me of new notes |
CANSLIM.net Company Profile |
SEC |
Zacks Reports |
StockTalk |
News |
Chart |
Request a new note
C
A N
S L
I M
|
YNDX
-
NASDAQ
Yandex N V Class A
INTERNET - Internet Information Providers
|
$32.48
|
+0.49
1.53% |
$32.67
|
3,917,124
156.27% of 50 DAV
50 DAV is 2,506,700
|
$33.66
-3.51%
|
7/10/2013
|
$29.29
|
PP = $29.59
|
|
MB = $31.07
|
Most Recent Note - 7/29/2013 1:45:38 PM
G - Retreating form its 52-week high today after getting extended following 2 consecutive volume-driven gains into new high territory. Prior highs in the $28-29 area define near-term support to watch.
>>> The latest Featured Stock Update with an annotated graph appeared on 7/26/2013. Click here.
View all notes |
Alert me of new notes |
CANSLIM.net Company Profile |
SEC |
Zacks Reports |
StockTalk |
News |
Chart |
Request a new note
C
A N
S L
I M
|
|
|
|
THESE ARE NOT BUY RECOMMENDATIONS!
Comments contained in the body of this report are technical
opinions only. The material herein has been obtained
from sources believed to be reliable and accurate, however,
its accuracy and completeness cannot be guaranteed.
This site is not an investment advisor, hence it does
not endorse or recommend any securities or other investments.
Any recommendation contained in this report may not
be suitable for all investors and it is not to be deemed
an offer or solicitation on our part with respect to
the purchase or sale of any securities. All trademarks,
service marks and trade names appearing in this report
are the property of their respective owners, and are
likewise used for identification purposes only.
This report is a service available
only to active Paid Premium Members.
You may opt-out of receiving report notifications
at any time. Questions or comments may be submitted
by writing to Premium Membership Services 665 S.E. 10 Street, Suite 201 Deerfield Beach, FL 33441-5634 or by calling 1-800-965-8307
or 954-785-1121.
|
|
|

