You are not logged in.
This means you
CAN ONLY VIEW reports that were published prior to Monday, April 14, 2025.
You
MUST UPGRADE YOUR MEMBERSHIP if you want to see any current reports.
AFTER MARKET UPDATE - FRIDAY, JULY 30TH, 2010
Previous After Market Report Next After Market Report >>>
|
|
|
|
DOW |
-1.22 |
10,465.94 |
-0.01% |
|
Volume |
1,176,416,650 |
-0% |
|
Volume |
2,138,616,152 |
-7% |
|
NASDAQ |
+3.01 |
2,254.70 |
+0.13% |
|
Advancers |
1,799 |
57% |
|
Advancers |
1,465 |
53% |
|
S&P 500 |
+0.07 |
1,101.60 |
+0.01% |
|
Decliners |
1,259 |
40% |
|
Decliners |
1,192 |
43% |
|
Russell 2000 |
+0.46 |
650.89 |
+0.07% |
|
52 Wk Highs |
152 |
|
|
52 Wk Highs |
43 |
|
|
S&P 600 |
-0.44 |
348.50 |
-0.13% |
|
52 Wk Lows |
19 |
|
|
52 Wk Lows |
33 |
|
|
 |
Mixed End To Mixed Week For Major Averages
Adam Sarhan, Contributing Writer,
On Friday, and for the week, the major averages ended mixed to slightly lower as investors digested a slew of economic and earnings data. Friday's volume totals were slightly lower than Thursday's totals on both major exchanges. Advancers led decliners on the NYSE by a 3-to-2 ratio while on the Nasdaq exchange they led by a narrower a 7-to-6 ratio. New 52-week highs outnumbered new 52-week lows on the NYSE and the Nasdaq exchange. There were 19 high-ranked companies from the CANSLIM.net Leaders List that made a new 52-week high and appeared on the CANSLIM.net BreakOuts Page, lower than the 21 issues that appeared on the prior session.
Stocks opened higher on Monday after FedEx Corp (FDX +0.58%) reported solid results and raised its 2010 outlook. Before Monday's open, FedEx raised their 2010 outlook and said earnings soared +108% while sales grew by +20% last quarter. The second largest package-delivery company's shares gapped up on monstrous trade as investors welcomed the positive news. Normally, transportation stocks are a good proxy for general economic activity. Elsewhere, the Commerce Department said new home sales topped estimates and rose in June, following an unprecedented decline in the previous month. New home sales rose by +24% from May to an annual pace of 330,000. Stocks ended mixed to slightly lower on Tuesday after the S&P Case-Shiller home-price index showed home prices across the US rose in May due to "seasonal factors and the residual impact of the now-expired first-time home buyers’ tax credit."
The major averages ended lower on Wednesday after encountering resistance near their recent chart highs. The Commerce Department said durable goods unexpectedly fell last month. At 2:00PM EST, the Fed published its Beige Book which summarizes economic conditions at 12 districts around the country. The report showed that the economic recovery slowed in some districts while other districts held steady.
The major averages negatively reversed on Thursday after encountering resistance near their prior chart highs following a near 50% recovery from their lows following their April 2010 highs. Technology and financial shares fell after the latest of earnings reports were released and New York Attorney General Andrew Cuomo began a fraud probe into the life insurance industry and subpoenaed several well-known firms.
Elsewhere, the Labor Department said jobless claims fell last week and confidence improved about Europe's economy. Stocks turned tail after James Bullard, President of the Federal Reserve Bank of St. Louis, said the central bank should resume purchases of Treasury securities if the economy slows and deflation sets in. On Friday, stocks ended mixed to slightly higher after GDP slowed in the second quarter and the latest read on consumer confidence topped estimates.
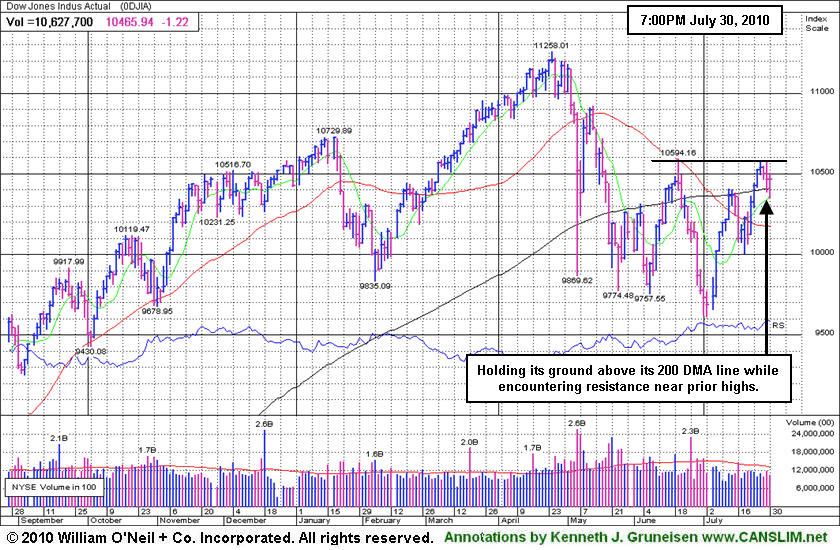
The major averages are still above their respective 2-month downward trendlines which is a healthy sign. However, the Nasdaq Composite, NYSE Composite, and the benchmark S&P 500 indexes collectively closed below their respective 200-day moving average (DMA) lines which is not ideal. In order for a new leg higher to begin, the major averages will have to ratchet above their longer term averages and close above their recent chart highs which currently serve as the next levels of resistance to watch. The window remains open for for high-ranked stocks to be accumulated when they trigger fresh technical buy signals. Trade accordingly.
PICTURED: The Dow Jones Industrial Average is holding its ground above its 200-day moving average (DMA) line while encountering resistance near prior chart highs.
|
|
|
 |
Healthcare Group Was A Standout Gainer
Kenneth J. Gruneisen - Passed the CAN SLIM® Master's Exam
While the Retail Index ($RLX +1.03%) posted a decent gain on Friday the financial sector traded with a slightly negative bias and the Broker/Dealer Index ($XBD -0.37%) and Bank Index ($BKX -0.23%) edged lower. The Healthcare Index ($HMO +3.21%) was a standout gainer on Friday, and the Gold & Silver Index ($XAU +1.30%) was another defensive group on the rise. Energy-related shares were mostly quiet as the Oil Services Index ($OSX -0.35%) and Integrated Oil Index ($XOI +0.09%) ended mixed. Tech shares were also mixed as the Semiconductor Index ($SOX -1.05%) fell, yet the Internet Index ($IIX +0.76%), Networking Index ($NWX +0.85%), and Biotechnology Index ($BTK +0.94%) posted gains.
Charts courtesy www.stockcharts.com
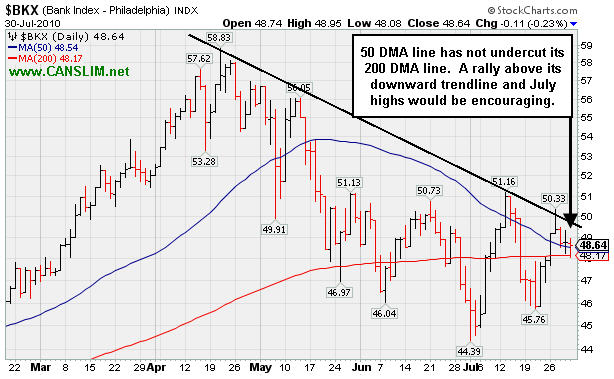
PICTURED: The Bank Index's ($BKX -0.23%) 50-day moving average (DMA) line has not undercut its 200 DMA line. A rally above the downward trendline and above its July highs would be encouraging.
| Oil Services |
$OSX |
181.57 |
-0.64 |
-0.35% |
-6.85% |
| Healthcare |
$HMO |
1,457.77 |
+45.36 |
+3.21% |
-1.03% |
| Integrated Oil |
$XOI |
978.64 |
+0.86 |
+0.09% |
-8.38% |
| Semiconductor |
$SOX |
348.81 |
-3.71 |
-1.05% |
-3.08% |
| Networking |
$NWX |
239.07 |
+2.02 |
+0.85% |
+3.47% |
| Internet |
$IIX |
243.53 |
+1.83 |
+0.76% |
+4.14% |
| Broker/Dealer |
$XBD |
106.72 |
-0.39 |
-0.37% |
-7.24% |
| Retail |
$RLX |
405.05 |
+4.14 |
+1.03% |
-1.48% |
| Gold & Silver |
$XAU |
169.72 |
+2.17 |
+1.30% |
+0.87% |
| Bank |
$BKX |
48.64 |
-0.11 |
-0.23% |
+13.88% |
| Biotech |
$BTK |
1,059.63 |
+9.88 |
+0.94% |
+12.47% |
|
|
|
 |
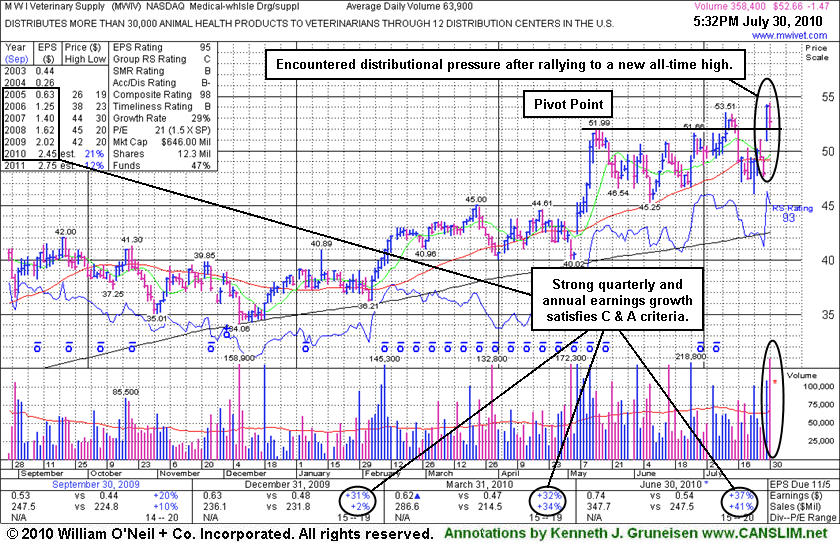
Recent Breakout Encountering Some Distributional Pressure
Kenneth J. Gruneisen - Passed the CAN SLIM® Master's Exam
M W I Veterinary Supply (MWIV -$1.47 or -2.72% to $52.66) gapped down today then rebounded and touched new high territory. However, it ultimately finished the session near its pivot point with a loss on heavy volume, encountering distributional pressure. It was featured in the 7/29/10 mid-day report (read here). No overhead supply remains to act as resistance after hitting a new 52-week high with its strong close above the pivot point cited (based on its 5/17/10 high plus ten cents) backed by +72% above average volume triggering a buy signal. Its weekly chart has bullish characteristics and little signs of distribution throughout the past year. It has a good annual earnings (A criteria) history, and the latest quarter ended June 30, 2010 showed more impressive sales and earnings acceleration after prior earnings comparisons showed improvement above the guidelines of the fact-based investment system. Its small supply (S criteria) of only 12.3 million shares outstanding could contribute to greater volatility in the event of institutional buying or selling. An earlier breakout attempt in July failed after its gains above its May highs lacked great volume conviction. Although it briefly slumped under its 50-day moving average line, it found impressive support near prior chart lows in the $45-46 area.
 |
|
|
Color Codes Explained :
Y - Better candidates highlighted by our
staff of experts.
G - Previously featured
in past reports as yellow but may no longer be buyable under the
guidelines.
***Last / Change / Volume data in this table is the closing quote data***
Symbol/Exchange
Company Name
Industry Group |
PRICE |
CHANGE
(%Change) |
Day High |
Volume
(% DAV)
(% 50 day avg vol) |
52 Wk Hi
% From Hi |
Featured
Date |
Price
Featured |
Pivot Featured |
|
Max Buy |
AAPL
-
NASDAQ
Apple Inc
COMPUTER HARDWARE - Personal Computers
|
$257.25
|
-0.86
-0.33% |
$259.67
|
16,006,041
56.13% of 50 DAV
50 DAV is 28,518,000
|
$279.01
-7.80%
|
6/17/2010
|
$270.95
|
PP = $272.56
|
|
MB = $286.19
|
 Most Recent Note - 7/30/2010 2:52:40 PM
Y - Quietly consolidating near its 50 DMA line, it has been 6 weeks since its negative reversal on 6/21/10 at its all-time high. Recent chart low ($239) defines an important support level.
>>> The latest Featured Stock Update with an annotated graph appeared on 7/12/2010. Click here.
View all notes |
Alert me of new notes |
CANSLIM.net Company Profile |
SEC |
Zacks Reports |
StockTalk |
News |
Chart |
Request a new note
C
A N
S L
I M


|
ABV
-
NYSE
Comp De Bebidas Adr
FOOD and BEVERAGE - Beverages - Brewers
|
$109.22
|
+0.02
0.02% |
$110.31
|
490,436
67.13% of 50 DAV
50 DAV is 730,600
|
$110.68
-1.32%
|
6/29/2010
|
$104.74
|
PP = $109.33
|
|
MB = $114.80
|
Most Recent Note - 7/30/2010 2:56:40 PM
Y - This Brazil-based beverage firm is stubbornly holding its ground after reaching a new 52-week high this week, but due to light volume totals its recent gains have not triggered a proper technical buy signal. It found support near its 50 DMA line since featured in the 6/29/10 mid-day report.
>>> The latest Featured Stock Update with an annotated graph appeared on 7/20/2010. Click here.
View all notes |
Alert me of new notes |
CANSLIM.net Company Profile |
SEC |
Zacks Reports |
StockTalk |
News |
Chart |
Request a new note
C
A N
S L
I M
|
BIDU
-
NASDAQ
Baidu Inc Ads
INTERNET - Internet Information Providers
|
$81.41
|
+2.21
2.79% |
$81.54
|
12,314,814
98.74% of 50 DAV
50 DAV is 12,471,400
|
$82.29
-1.07%
|
7/14/2010
|
$75.03
|
PP = $78.59
|
|
MB = $82.52
|
Most Recent Note - 7/30/2010 3:00:46 PM
Y - Perched near all-time highs, it has stalled after recent gains above prior highs in the $78 area lacked great volume conviction. No overhead supply remains to act as resistance.
>>> The latest Featured Stock Update with an annotated graph appeared on 7/14/2010. Click here.
View all notes |
Alert me of new notes |
CANSLIM.net Company Profile |
SEC |
Zacks Reports |
StockTalk |
News |
Chart |
Request a new note
C
A N
S L
I M
|
CACC
-
NASDAQ
Credit Acceptance Corp
FINANCIAL SERVICES - Credit Services
|
$55.98
|
+3.33
6.32% |
$56.00
|
109,898
230.88% of 50 DAV
50 DAV is 47,600
|
$54.45
2.82%
|
7/29/2010
|
$52.04
|
PP = $54.07
|
|
MB = $56.77
|
Most Recent Note - 7/30/2010 3:06:33 PM
Y - Today's gain helped it trade above its pivot point and hit a new all-time high. Due to report earning on Tuesday, August 3rd after the close, CACC was featured in the 7/29/10 mid-day report (read here) after quietly reaching new high territory. The pivot point cited is based on its 2/01/10 high plus ten cents. Its quarterly and annual earnings track record is a good match with the fact-based investment system's fundamental guidelines, as opposed to its peer in the Finance - Consumer Loans group, Americredit Corp (ACF), which recently bankrupted GM bid to acquire the day after President Obama signed into law the Dodd-Frank Wall Street Reform and Consumer Protection Act. Based on weak action CACC was dropped from the Featured Stocks list on 3/16/10. It has steadily risen since subsequently finding support above the $38 area cited as a support level to watch.
>>> The latest Featured Stock Update with an annotated graph appeared on 3/2/2010. Click here.
View all notes |
Alert me of new notes |
CANSLIM.net Company Profile |
SEC |
Zacks Reports |
StockTalk |
News |
Chart |
Request a new note
C
A N
S L
I M
|
CRM
-
NYSE
Salesforce.Com Inc
INTERNET - Internet Software and Services
|
$98.95
|
+1.16
1.19% |
$99.42
|
1,372,285
48.35% of 50 DAV
50 DAV is 2,838,100
|
$101.49
-2.50%
|
6/2/2010
|
$88.44
|
PP = $89.60
|
|
MB = $94.08
|
Most Recent Note - 7/30/2010 3:09:27 PM
G - Stubbornly holding its ground less than -3% from its 52-week high, consolidating above prior highs near $97 after recently rising from a choppy 7-week base with gains backed by average volume.
>>> The latest Featured Stock Update with an annotated graph appeared on 7/15/2010. Click here.
View all notes |
Alert me of new notes |
CANSLIM.net Company Profile |
SEC |
Zacks Reports |
StockTalk |
News |
Chart |
Request a new note
C
A N
S L
I M
|
Symbol/Exchange
Company Name
Industry Group |
PRICE |
CHANGE
(%Change) |
Day High |
Volume
(% DAV)
(% 50 day avg vol) |
52 Wk Hi
% From Hi |
Featured
Date |
Price
Featured |
Pivot Featured |
|
Max Buy |
DTSI
-
NASDAQ
D T S Inc
CONSUMER DURABLES - Electronic Equipment
|
$35.72
|
-0.54
-1.49% |
$36.08
|
104,974
100.17% of 50 DAV
50 DAV is 104,800
|
$37.50
-4.75%
|
7/27/2010
|
$37.00
|
PP = $36.28
|
|
MB = $38.09
|
Most Recent Note - 7/30/2010 3:35:19 PM
Y - It gapped down today and has pulled back under its pivot point. Volume totals have been light while consolidating above prior highs in the $35-36 area after its 7/23/10 gain with above average volume triggered a technical buy signal and it was featured in yellow in the 7/27/10 mid-day report (read here). It will report earnings after the close on Monday, August 9th, and Street estimates calling for lower FY '10 earnings have been noted as a concern.
>>> The latest Featured Stock Update with an annotated graph appeared on 7/27/2010. Click here.
View all notes |
Alert me of new notes |
CANSLIM.net Company Profile |
SEC |
Zacks Reports |
StockTalk |
News |
Chart |
Request a new note
C
A N
S L
I M
|
FFIV
-
NASDAQ
F 5 Networks Inc
INTERNET - Internet Software and Services
|
$87.83
|
+1.30
1.50% |
$88.34
|
2,213,146
122.90% of 50 DAV
50 DAV is 1,800,700
|
$87.97
-0.16%
|
6/16/2010
|
$74.50
|
PP = $74.10
|
|
MB = $77.81
|
Most Recent Note - 7/30/2010 3:40:04 PM
G - Stubbornly holding its ground and it touched another new 52-week high today, extended from any sound base after recent volume-driven gains. It could go on to produce more climactic gains, and disciplined investors may watch for a secondary buy point to develop.
>>> The latest Featured Stock Update with an annotated graph appeared on 7/7/2010. Click here.
View all notes |
Alert me of new notes |
CANSLIM.net Company Profile |
SEC |
Zacks Reports |
StockTalk |
News |
Chart |
Request a new note
C
A N
S L
I M
|
MELI
-
NASDAQ
Mercadolibre Inc
INTERNET - Internet Software and; Services
|
$60.50
|
-0.10
-0.17% |
$61.24
|
1,169,414
122.41% of 50 DAV
50 DAV is 955,300
|
$65.99
-8.32%
|
5/13/2010
|
$54.21
|
PP = $55.85
|
|
MB = $58.64
|
Most Recent Note - 7/30/2010 5:22:17 PM
G - Today marked its 4th consecutive loss, yet it closed in the upper half of its intra-day range. It has slumped back under prior chart highs in the $62 area after clearing a choppy 6-week consolidation with a gap up gain on 7/26/10.
>>> The latest Featured Stock Update with an annotated graph appeared on 7/23/2010. Click here.
View all notes |
Alert me of new notes |
CANSLIM.net Company Profile |
SEC |
Zacks Reports |
StockTalk |
News |
Chart |
Request a new note
C
A N
S L
I M
|
MWIV
-
NASDAQ
M W I Veterinary Supply
HEALTH SERVICES - Medical Instruments and; Supplies
|
$52.66
|
-1.47
-2.72% |
$54.27
|
364,836
577.27% of 50 DAV
50 DAV is 63,200
|
$54.21
-2.86%
|
7/29/2010
|
$52.05
|
PP = $52.09
|
|
MB = $54.69
|
Most Recent Note - 7/30/2010 4:16:04 PM
Y - Gapped down today then rebounded and touched new high territory, but finished near its pivot point with a loss on heavy volume. It was featured in the 7/29/10 mid-day report (read here). No overhead supply remains to act as resistance after hitting a new 52-week high with its strong close above the pivot point cited (based on its 5/17/10 high plus ten cents) backed by +72% above average volume triggering a buy signal. It has a good annual earnings (A criteria) history, and the latest quarter ended June 30, 2010 showed more impressive sales and earnings acceleration after prior earnings comparisons showed improvement above the guidelines of the fact-based investment system. Its small supply (S criteria) of only 12.3 million shares outstanding could contribute to greater volatility in the event of institutional buying or selling.
There are no Featured Stock Updates™ available for this stock at this time. You may request one by clicking the Request a New Note link below
View all notes |
Alert me of new notes |
CANSLIM.net Company Profile |
SEC |
Zacks Reports |
StockTalk |
News |
Chart |
Request a new note
C
A N
S L
I M
|
NEM
-
NYSE
Newmont Mining Corp
METALS and MINING - Gold
|
$55.90
|
+0.18
0.32% |
$56.25
|
5,176,729
56.75% of 50 DAV
50 DAV is 9,122,400
|
$63.38
-11.80%
|
6/22/2010
|
$59.60
|
PP = $59.67
|
|
MB = $62.65
|
Most Recent Note - 7/30/2010 4:19:13 PM
G - Gains on light volume have followed damaging distributional losses including its gap down on 7/27/10. Technically, a rebound above its 50 DMA line would help its outlook improve.
>>> The latest Featured Stock Update with an annotated graph appeared on 7/9/2010. Click here.
View all notes |
Alert me of new notes |
CANSLIM.net Company Profile |
SEC |
Zacks Reports |
StockTalk |
News |
Chart |
Request a new note
C
A N
S L
I M
|
Symbol/Exchange
Company Name
Industry Group |
PRICE |
CHANGE
(%Change) |
Day High |
Volume
(% DAV)
(% 50 day avg vol) |
52 Wk Hi
% From Hi |
Featured
Date |
Price
Featured |
Pivot Featured |
|
Max Buy |
NEOG
-
NASDAQ
Neogen Corp
DRUGS - Diagnostic Substances
|
$29.86
|
+0.99
3.43% |
$30.25
|
175,050
189.24% of 50 DAV
50 DAV is 92,500
|
$29.91
-0.15%
|
7/22/2010
|
$27.19
|
PP = $27.87
|
|
MB = $29.26
|
Most Recent Note - 7/30/2010 4:28:23 PM
G - Today's gain actually had nearly 2 times average volume as it rallied for a new 52-week high above "max buy" level. It was featured in the 7/22/10 mid-day report (read here).
>>> The latest Featured Stock Update with an annotated graph appeared on 7/22/2010. Click here.
View all notes |
Alert me of new notes |
CANSLIM.net Company Profile |
SEC |
Zacks Reports |
StockTalk |
News |
Chart |
Request a new note
C
A N
S L
I M
|
NETL
-
NASDAQ
Netlogic Microsystems
ELECTRONICS - Semiconductor - Memory Chips
|
$29.56
|
+0.00
0.00% |
$30.20
|
2,509,000
191.64% of 50 DAV
50 DAV is 1,309,200
|
$35.00
-15.54%
|
7/28/2010
|
$33.44
|
PP = $35.10
|
|
MB = $36.86
|
Most Recent Note - 7/30/2010 3:48:23 PM
G - It has positively reversed after a gap down today and early trading below its 50 DMA line following a damaging loss on the prior session. Ahead of its latest earnings report it was featured in the 7/28/10 mid-day report in yellow (read here). Gains above resistance in the $35 area would turn its outlook bullish.
>>> The latest Featured Stock Update with an annotated graph appeared on 7/28/2010. Click here.
View all notes |
Alert me of new notes |
CANSLIM.net Company Profile |
SEC |
Zacks Reports |
StockTalk |
News |
Chart |
Request a new note
C
A N
S L
I M
|
ROVI
-
NASDAQ
Rovi Corp
COMPUTER SOFTWARE andamp; SERVICES - Security Software andamp; Services
|
$44.50
|
+2.44
5.80% |
$44.90
|
3,016,956
237.63% of 50 DAV
50 DAV is 1,269,600
|
$44.85
-0.78%
|
6/3/2010
|
$38.70
|
PP = $40.16
|
|
MB = $42.17
|
Most Recent Note - 7/30/2010 5:31:29 PM
G - Gapped up today and rallied to a new 52-week high with a gain backed by more than 2 times average volume after its latest earnings report. It is extended from a sound base, and support is defined by prior resistance in the $40 area and its 50 DMA line.
>>> The latest Featured Stock Update with an annotated graph appeared on 7/21/2010. Click here.
View all notes |
Alert me of new notes |
CANSLIM.net Company Profile |
SEC |
Zacks Reports |
StockTalk |
News |
Chart |
Request a new note
C
A N
S L
I M
|
THOR
-
NASDAQ
Thoratec Corp
HEALTH SERVICES - Medical Instruments and Supplies
|
$36.78
|
-5.76
-13.54% |
$40.00
|
6,577,481
672.82% of 50 DAV
50 DAV is 977,600
|
$47.93
-23.26%
|
6/3/2010
|
$44.38
|
PP = $45.35
|
|
MB = $47.62
|
Most Recent Note - 7/30/2010 5:27:59 PM
G - Gapped down today following its latest earnings news, triggering technical sell signals with a damaging loss with more than 6 times average volume. While undercutting recent lows in the $41 area, it dove toward its 200 DMA line to its lowest level since its big 4/30/10 gap up.
>>> The latest Featured Stock Update with an annotated graph appeared on 7/16/2010. Click here.
View all notes |
Alert me of new notes |
CANSLIM.net Company Profile |
SEC |
Zacks Reports |
StockTalk |
News |
Chart |
Request a new note
C
A N
S L
I M
|
ULTA
-
NASDAQ
Ulta Salon Cosm & Frag
SPECIALTY RETAIL - Specialty Retail, Other
|
$25.26
|
-0.18
-0.71% |
$25.53
|
528,176
74.15% of 50 DAV
50 DAV is 712,300
|
$26.75
-5.57%
|
5/28/2010
|
$25.58
|
PP = $25.86
|
|
MB = $27.15
|
Most Recent Note - 7/30/2010 5:24:40 PM
G - Held its ground today after a gap up for a solid gain with better than average volume on 7/29/10. Prior lows in the $22 area define the next support level just above its 200 DMA line.
>>> The latest Featured Stock Update with an annotated graph appeared on 7/19/2010. Click here.
View all notes |
Alert me of new notes |
CANSLIM.net Company Profile |
SEC |
Zacks Reports |
StockTalk |
News |
Chart |
Request a new note
C
A N
S L
I M
|
Symbol/Exchange
Company Name
Industry Group |
PRICE |
CHANGE
(%Change) |
Day High |
Volume
(% DAV)
(% 50 day avg vol) |
52 Wk Hi
% From Hi |
Featured
Date |
Price
Featured |
Pivot Featured |
|
Max Buy |
VIT
-
NYSE
Vanceinfo Tech Inc Ads
COMPUTER SOFTWARE and SERVICES - Business Software and Services
|
$25.39
|
+0.49
1.97% |
$25.48
|
203,641
34.67% of 50 DAV
50 DAV is 587,300
|
$27.59
-7.97%
|
7/8/2010
|
$25.20
|
PP = $26.58
|
|
MB = $27.91
|
Most Recent Note - 7/30/2010 3:56:09 PM
G - Quietly holding its ground near its June high, it slumped below the pivot point cited in prior reports this week and it is now -8.5% off its 52 week high. Color code is changed to green based on its recent technical deterioration. Its 7/19/10 low ($23.78) defines near-term support above its 50 DMA line.
>>> The latest Featured Stock Update with an annotated graph appeared on 7/26/2010. Click here.
View all notes |
Alert me of new notes |
CANSLIM.net Company Profile |
SEC |
Zacks Reports |
StockTalk |
News |
Chart |
Request a new note
C
A N
S L
I M
|
|
|
|
THESE ARE NOT BUY RECOMMENDATIONS!
Comments contained in the body of this report are technical
opinions only. The material herein has been obtained
from sources believed to be reliable and accurate, however,
its accuracy and completeness cannot be guaranteed.
This site is not an investment advisor, hence it does
not endorse or recommend any securities or other investments.
Any recommendation contained in this report may not
be suitable for all investors and it is not to be deemed
an offer or solicitation on our part with respect to
the purchase or sale of any securities. All trademarks,
service marks and trade names appearing in this report
are the property of their respective owners, and are
likewise used for identification purposes only.
This report is a service available
only to active Paid Premium Members.
You may opt-out of receiving report notifications
at any time. Questions or comments may be submitted
by writing to Premium Membership Services 665 S.E. 10 Street, Suite 201 Deerfield Beach, FL 33441-5634 or by calling 1-800-965-8307
or 954-785-1121.
|
|
|


