You are not logged in.
This means you
CAN ONLY VIEW reports that were published prior to Monday, April 14, 2025.
You
MUST UPGRADE YOUR MEMBERSHIP if you want to see any current reports.
AFTER MARKET UPDATE - THURSDAY, JULY 30TH, 2009
Previous After Market Report Next After Market Report >>>
|
|
|
|
DOW |
+83.74 |
9,154.46 |
+0.92% |
|
Volume |
1,358,105,930 |
+8% |
|
Volume |
2,600,323,450 |
+22% |
|
NASDAQ |
+16.54 |
1,984.30 |
+0.84% |
|
Advancers |
2,412 |
77% |
|
Advancers |
1,857 |
66% |
|
S&P 500 |
+11.60 |
986.75 |
+1.19% |
|
Decliners |
643 |
21% |
|
Decliners |
848 |
30% |
|
Russell 2000 |
+9.42 |
557.80 |
+1.72% |
|
52 Wk Highs |
127 |
|
|
52 Wk Highs |
115 |
|
|
S&P 600 |
+5.23 |
295.74 |
+1.80% |
|
52 Wk Lows |
7 |
|
|
52 Wk Lows |
5 |
|
|
 |
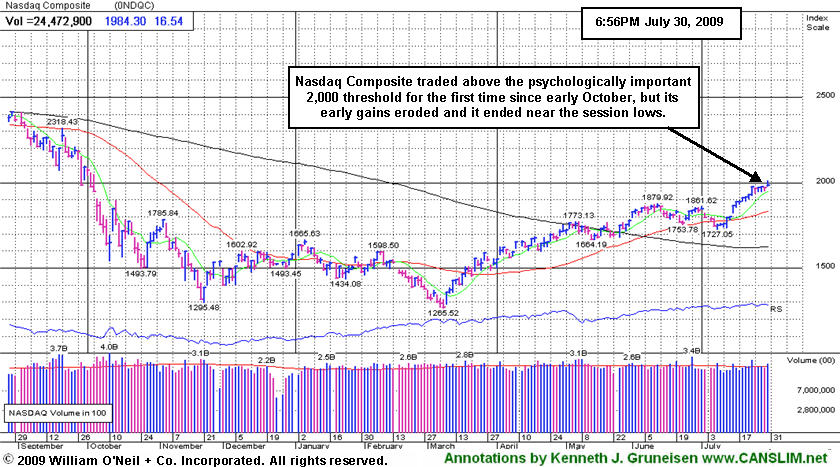
Major Averages Hit New 2009 Highs; Breadth Positive As Volume Increased
Kenneth J. Gruneisen - Passed the CAN SLIM® Master's Exam
The major averages unanimously rallied to new 2009 highs with gains backed by higher volume indicative of institutional buying demand. Gains from 25 out of 30 components boosted the the Dow Jones Industrial Average. The volume totals on the NYSE and on the Nasdaq exchange were was reported higher than the prior session totals. Advancing issues led decliners on the NYSE by a 3-to-1 ratio and on the Nasdaq exchange by a better than 2-to-1 ratio. There were 42 high-ranked companies from the CANSLIM.net Leaders List that made a new 52-week high and appeared on the CANSLIM.net BreakOuts Page, more than double the 20 issues that appeared on the prior session. On both exchanges new 52-week highs were in the triple digits while new 52-week lows were in the single digits.
Visa (V +0.64%) and MasterCard (MA +2.95%) both reported upside earnings that provided support to the financial sector, however both firms' sales revenues increases have shown a distinct deceleration which is worrisome. Meanwhile, positive earnings surprises from Noble (NBL +35.89%) and Apache (APA +5.61%) and a +5.8% rebound in oil prices to $67.00 per barrel gave the energy sector a lift. That followed a big -6% drop in crude prices on the previous session. The CRB Commodity Index posted a +3.9% gain, its best single-session percentage gain since March. Better-than-expected earnings and a lack of negative headlines helped provoke more broad-based buying efforts. As sidelined cash was put to work, the latest gains could also be attributed to short covering.
The financial sector helped underpin the major averages' gains after insurance firms including Aflac (AFL +6.66%), Hartford (HIG +13.57%), Lincoln National (LNC +12.41%) reported quarterly results. None of the above mentioned companies in this commentary have the strong underlying fundamentals necessary for consideration under the investment system's guidelines, however.
The market's positive bias was bolstered by news that the four-week moving average for initial jobless claims fell to its lowest level in months, although weekly claims climbed more than expected. Continuing claims declined more than expected for another straight week. Continuing claims now stand at levels not seen since April, but many economists caution that the labor market remains far from good.
The advance second quarter GDP announcement is due Friday morning at 8:30AM ET and may serve as a catalyst for more decisive action to close out the week. The current estimates are calling for an annualized decline of -1.5% following the -5.5% annualized decline registered in the first quarter.
PICTURED: The Nasdaq Composite traded above the psychologically important 2,000 threshold for the first time since early October, but its early gains eroded and it ended near the session lows.
|
 Kenneth J. Gruneisen started out as a licensed stockbroker in August 1987, a couple of months prior to the historic stock market crash that took the Dow Jones Industrial Average down -22.6% in a single day. He has published daily fact-based fundamental and technical analysis on high-ranked stocks online for two decades. Through FACTBASEDINVESTING.COM, Kenneth provides educational articles, news, market commentary, and other information regarding proven investment systems that work in good times and bad.
Comments contained in the body of this report are technical opinions only and are not necessarily those of Gruneisen Growth Corp. The material herein has been obtained from sources believed to be reliable and accurate, however, its accuracy and completeness cannot be guaranteed. Our firm, employees, and customers may effect transactions, including transactions contrary to any recommendation herein, or have positions in the securities mentioned herein or options with respect thereto. Any recommendation contained in this report may not be suitable for all investors and it is not to be deemed an offer or solicitation on our part with respect to the purchase or sale of any securities. |
|
 |
Financial And Commodity-Linked Groups Lead Gainers
Kenneth J. Gruneisen - Passed the CAN SLIM® Master's Exam
Commodity-linked areas and financial shares helped create a positive bias in the market on Thursday as the Gold & Silver Index ($XAU +2.88%), Integrated Oil Index ($XOI +1.22%), and Oil Services Index ($OSX +2.65%) posted solid gains. The Bank Index ($BKX +3.41%) and Broker/Dealer Index ($XBD +2.05%) had an important positive influence, and so did the Retail Index ($RLX +1.35%) and the Healthcare Index ($HMO +0.92%). The tech sector had a mixed session, with a modest loss for the Biotechnology Index ($BTK -0.65%), minor gains for the Semiconductor Index ($SOX +0.13%) and Internet Index ($IIX +0.18%), and a better gain for the Networking Index ($NWX +0.74%).
Charts courtesy www.stockcharts.com

PICTURED: The Bank Index ($BKX +3.41%) posted a 7th consecutive gain and rallied above its recent highs and its 200-day moving average (DMA) line, heading toward its May high. A bullish crossover of its 50 & 200 DMA lines may be close at hand, and that would be a bullish indication.
| Oil Services |
$OSX |
168.97 |
+4.37 |
+2.65% |
+39.20% |
| Healthcare |
$HMO |
1,190.38 |
+10.85 |
+0.92% |
+23.97% |
| Integrated Oil |
$XOI |
954.34 |
+11.48 |
+1.22% |
-2.59% |
| Semiconductor |
$SOX |
301.05 |
+0.40 |
+0.13% |
+41.89% |
| Networking |
$NWX |
197.04 |
+1.45 |
+0.74% |
+36.94% |
| Internet |
$IIX |
201.32 |
+0.37 |
+0.18% |
+50.50% |
| Broker/Dealer |
$XBD |
108.45 |
+2.18 |
+2.05% |
+39.99% |
| Retail |
$RLX |
354.10 |
+4.72 |
+1.35% |
+26.80% |
| Gold & Silver |
$XAU |
142.97 |
+4.00 |
+2.88% |
+15.44% |
| Bank |
$BKX |
39.99 |
+1.32 |
+3.41% |
-9.77% |
| Biotech |
$BTK |
878.18 |
-5.79 |
-0.65% |
+35.70% |
|
|
|
 |
Strong Leader Keeps On Leading
Kenneth J. Gruneisen - Passed the CAN SLIM® Master's Exam
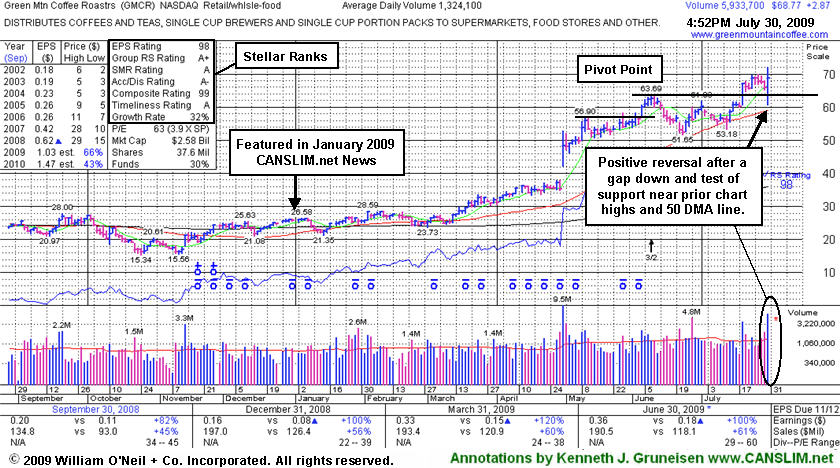
Green Mountain Coffee Roasters (GMCR +$2.87 or +4.36% to $68.77) positively reversed today and rallied to new highs after initially gapping down following another strong financial report for the latest quarter ended June 30, 2009. It had held its ground stubbornly since July 20th, when its rally above its latest pivot point to a new all-time high with three times average volume triggered a technical buy signal. Using the "view all notes" link, one can see that from July 17-22 it was color coded yellow (Y- at the front of the notes) after the latest pivot point was identified. Its color code was changed to green after it rose more than +5% above its pivot point, indicating that it was getting extended from an ideal entry point within the investment system's guidelines. Greater than usual volume and volatility are common around earnings news, and today's shakeout offered a brief window of opportunity to buy shares without chasing the stock.
If you have "force fed" your winners over time, accumulating at multiple buy points, always be disciplined about limiting losses by selling any higher priced shares you may have bought if the stock falls more than -7% from the price you paid for them. You might decide to hold shares owned at a lower cost basis, but be prompt to lock in profits whenever clear technical sell signals occur. Strong leaders tend to keep on leading, however any subsequent deterioration under prior highs in the $62-63 area would negate its latest breakout. Prior highs are initial chart support to watch above its 50-day moving average (DMA) line. Do not be confused by the 3:2 stock split effective 6/09/09. GMCR has traded as much as +176.28% since appearing with an annotated graph under the headline "It May Soon Be Time To Go Green" when featured in the January 2009 CANSLIM.net News (read here).
|
|
|
Color Codes Explained :
Y - Better candidates highlighted by our
staff of experts.
G - Previously featured
in past reports as yellow but may no longer be buyable under the
guidelines.
***Last / Change / Volume quote data in this table corresponds with the timestamp on the note***
Symbol/Exchange
Company Name
Industry Group |
Last |
Chg. |
Vol
% DAV |
Date Featured |
Price Featured |
Latest Pivot Point
Featured |
Status |
| Latest Max Buy Price |
CPLA
- NASDAQ
Capella Education Co
DIVERSIFIED SERVICES - Education and Training Services
|
$64.71
|
+2.12
|
167,856
75% DAV
224,364
|
7/9/2009
(Date
Featured) |
$59.69
(Price
Featured) |
PP = $62.06 |
Y |
| MB = $65.16 |
Most Recent Note - 7/30/2009 4:29:25 PM
Y - Gain today with lighter volume near its average daily total. On 7/28/09 it reported solid results for the quarter ended June 30, 2009, with a +21% increase in sales revenues (accelerating) and +51% earnings per share, and it technically gapped up and traded more than the +50% above average volume guideline as it rose above its pivot point. Featured in yellow in the 7/09/09 Mid-Day BreakOuts Report (read here). The group has shown some leadership, yet currently has a D- and 13 for Relative Strength Rating/Ranks. CPLA is a high-ranked leader in the Commercial Services-Schools Group. Its small supply of only 13.9 million shares in the float could contribute to greater price volatility in the event of institutional accumulation or distribution. The number of top-rated funds owning an interest rose from 91 in Sept '08, to 135 as of March '09, which is reassuring with respect to the I criteria. It has a very good earnings history that satisfies the C & A criteria, while recent quarters showed steady sales revenues increases in the +17-18% range.
>>> The latest Featured Stock Update with an annotated graph appeared on 7/20/2009. click here.
|
|
C
A
S
I |
News |
Chart |
SEC
View all notes Alert
me of new notes
Company
Profile
|
GMCR
- NASDAQ
Green Mtn Coffee Roastrs
FOOD & BEVERAGE - Processed & Packaged Goods
|
$71.52
|
+5.62
|
4,894,793
342% DAV
1,429,351
|
7/17/2009
(Date
Featured) |
$60.15
(Price
Featured) |
PP = $63.79 |
G |
| MB = $66.98 |
Most Recent Note - 7/30/2009 2:53:52 PM
G - Positively reversed today and rallied to new highs after initially gapping down following another strong quarterly financial report. Prior highs in the $62-63 area are initial chart support to watch above its 50 DMA line. Do not be confused by the 3:2 stock split effective 6/09/09. GMCR traded up more than +168% since appearing with an annotated graph under the headline "It May Soon Be Time To Go Green" when featured in the January 2009 CANSLIM.net News (read here).
>>> The latest Featured Stock Update with an annotated graph appeared on 7/30/2009. click here.
|
|
C
A
S
I |
News |
Chart |
SEC
View all notes Alert
me of new notes
Company
Profile
|
HMSY
- NASDAQ
H M S Holdings Corp
COMPUTER SOFTWARE & SERVICES - Healthcare Information Service
|
$41.02
|
+0.36
|
432,418
135% DAV
319,649
|
2/20/2009
(Date
Featured) |
$34.08
(Price
Featured) |
PP = $38.38 |
G |
| MB = $40.30 |
Most Recent Note - 7/30/2009 4:34:04 PM
G - Small gain today on above average volume. Its positive reversal on 7/24/09 marked a brief pullback below its "max buy" level. This high-ranked Commercial Services - Healthcare firm's prior highs in the $38 area are an important support level also coinciding with its 50 DMA line. A gap up gain on 6/16/09 with heavy volume triggered a technical buy signal.
>>> The latest Featured Stock Update with an annotated graph appeared on 7/24/2009. click here.
|
|
C
A
S
I |
News |
Chart |
SEC
View all notes Alert
me of new notes
Company
Profile
|
NTES
- NASDAQ
Netease Inc Adr
INTERNET - Internet Information Providers
|
$42.83
|
+0.99
|
1,855,167
73% DAV
2,552,731
|
7/17/2009
(Date
Featured) |
$39.29
(Price
Featured) |
PP = $38.74 |
G |
| MB = $40.68 |
Most Recent Note - 7/30/2009 4:35:22 PM
G - Quietly consolidating well above prior chart highs in the $38 area, an important support level to watch. A recent series of 10 consecutive gains was capped off with a considerable gain on 7/22/09 with very heavy volume that lifted it well above its max buy level. It got extended from its latest base. On 7/17/09 it broke out from a 5-week flat base with +44% above average volume behind its gain. First featured at $26.75 in the 3/31/09 CANSLIM.net Mid-Day Breakouts Report (read here). This high-ranked Chinese Internet - Content firm was also summarized in greater detail including an annotated graph in the April 2009 issue of CANSLIM.net News (read here).
>>> The latest Featured Stock Update with an annotated graph appeared on 7/23/2009. click here.
|
|
C
A
S
I |
News |
Chart |
SEC
View all notes Alert
me of new notes
Company
Profile
|
NVEC
- NASDAQ
N V E Corp
ELECTRONICS - Semiconductor - Specialized
|
$53.54
|
-1.49
|
90,212
95% DAV
94,882
|
3/13/2009
(Date
Featured) |
$33.85
(Price
Featured) |
PP = $49.60 |
G |
| MB = $52.08 |
Most Recent Note - 7/30/2009 4:39:20 PM
G - Negatively reversed today. Patience may allow for shares to be accumulated on pullbacks, and prior highs are now an important support level. Featured in the 7/23/09 Mid-Day BreakOuts Report (read here) after it gapped up for a considerable gain on heavy volume following news of stronger sales revenues (+41%) and solid earnings increases for the quarter ended June 30, 2009. The technical action was described as a "breakaway gap" from a valid ascending base. A prior breakout from what was also called an ascending base pattern failed as a wave of distribution smacked it down to support at its 50 DMA line. Quarterly sales revenues in the 6 million dollar range are still rather minuscule, leaving concerns.
>>> The latest Featured Stock Update with an annotated graph appeared on 7/17/2009. click here.
|
|
C
A
S
I |
News |
Chart |
SEC
View all notes Alert
me of new notes
Company
Profile
|
PEGA
- NASDAQ
Pegasystems Inc
COMPUTER SOFTWARE & SERVICES - Business Software & Services
|
$29.06
|
+0.56
|
476,141
184% DAV
259,037
|
7/29/2009
(Date
Featured) |
$27.53
(Price
Featured) |
PP = $27.49 |
G |
| MB = $28.86 |
Most Recent Note - 7/30/2009 4:41:28 PM
G - Gapped up today, rising beyond its max buy level. Color code was changed to green. Featured in yellow in the 7/29/09 mid-day report (read here) during the course of its considerable gain on heavy volume 3 times its average for a new 52-week high. There were no news headlines to be found as this software firm triggered a technical buy signal by breaking out from a third stage, 8-week "double bottom" type base. The previously noted downturn in annual earnings (the A criteria) from 2003 to 2006 has been followed by a solid turn around and big earnings increases in '07 and '08, and Street expectations for '09 are calling for well above +25% growth.
>>> The latest Featured Stock Update with an annotated graph appeared on 7/29/2009. click here.
|
|
C
A
S
I |
News |
Chart |
SEC
View all notes Alert
me of new notes
Company
Profile
|
SYNA
- NASDAQ
Synaptics Inc
COMPUTER SOFTWARE & SERVICES - Information Technology Service
|
$35.85
|
-0.23
|
2,463,951
168% DAV
1,463,139
|
5/18/2009
(Date
Featured) |
$32.58
(Price
Featured) |
PP = $34.52 |
G |
| MB = $36.25 |
Most Recent Note - 7/30/2009 4:44:07 PM
G - Negatively reversed today after a small gap up, closing below its 50 DMA line. Consolidating for nearly 7 weeks from its 52-week high. First featured in yellow in the May 18, 2009 mid-day report (read here). The number of top-rated funds owning its shares rose from 123 in June '08 to 210 in June '09, which is good news concerning the I criteria. Its annual earnings (the A criteria) history showed a dowturn in 2006, leaving concerns, but it followed that up with strong growth the next 2 years. Its small supply of shares (the S criteria) outstanding could contribute to especially great volatility in the event of institutional accumulation or distribution.
>>> The latest Featured Stock Update with an annotated graph appeared on 7/22/2009. click here.
|
|
C
A
S
I |
News |
Chart |
SEC
View all notes Alert
me of new notes
Company
Profile
|
TNDM
- NASDAQ
Tandem Diabetes Care Inc
TELECOMMUNICATIONS - Wireless Communications
|
$30.40
|
+0.96
|
280,762
31% DAV
907,195
|
3/2/2009
(Date
Featured) |
$18.89
(Price
Featured) |
PP = $29.85 |
G |
| MB = $31.34 |
Most Recent Note - 7/30/2009 4:46:48 PM
G - Quietly consolidating above its 50 DMA line, less than -7% off its all-time high, building on a choppy base since its June 2nd high of $32.57 was reached. Subsequent deterioration below its 50 DMA average and recent lows would raise concerns and trigger sell signals. It traded up as much as +72.42% since first featured at $18.89 in the 3/02/09 Mid-Day BreakOuts Report (read here).
>>> The latest Featured Stock Update with an annotated graph appeared on 7/21/2009. click here.
|
|
C
A
S
I |
News |
Chart |
SEC
View all notes Alert
me of new notes
Company
Profile
|
UTA
-
|
$13.44
|
+0.02
|
1,139,641
308% DAV
370,341
|
7/28/2009
(Date
Featured) |
$12.87
(Price
Featured) |
PP = $12.70 |
G |
| MB = $13.34 |
Most Recent Note - 7/30/2009 4:51:10 PM
G - Gapped up today, yet ended nearly flat, which was its second consecutive session marked by heavy volume and a lack of progress -a worrisome sign of "churning" distributional action. Its color code was changed to green after rising above its "max buy" level. Strong action prompted it to be featured in yellow with pivot point and max buy levels noted in the 7/28/09 mid-day breakouts report (read here), with additional analysis included in the after market update (read here). This Chinese provider of airline tickets and travel related services gapped up on 7/28/09, rising from a choppy 6-week base with a considerable gain on very heavy volume.
>>> The latest Featured Stock Update with an annotated graph appeared on 7/28/2009. click here.
|
|
C
A
S
I |
News |
Chart |
SEC
View all notes Alert
me of new notes
Company
Profile
|
|
|
|
THESE ARE NOT BUY RECOMMENDATIONS!
Comments contained in the body of this report are technical
opinions only. The material herein has been obtained
from sources believed to be reliable and accurate, however,
its accuracy and completeness cannot be guaranteed.
This site is not an investment advisor, hence it does
not endorse or recommend any securities or other investments.
Any recommendation contained in this report may not
be suitable for all investors and it is not to be deemed
an offer or solicitation on our part with respect to
the purchase or sale of any securities. All trademarks,
service marks and trade names appearing in this report
are the property of their respective owners, and are
likewise used for identification purposes only.
This report is a service available
only to active Paid Premium Members.
You may opt-out of receiving report notifications
at any time. Questions or comments may be submitted
by writing to Premium Membership Services 665 S.E. 10 Street, Suite 201 Deerfield Beach, FL 33441-5634 or by calling 1-800-965-8307
or 954-785-1121.
|
|
|

