You are not logged in.
This means you
CAN ONLY VIEW reports that were published prior to Monday, April 14, 2025.
You
MUST UPGRADE YOUR MEMBERSHIP if you want to see any current reports.
AFTER MARKET UPDATE - MONDAY, JULY 29TH, 2013
Previous After Market Report Next After Market Report >>>
|
|
|
|
DOW |
-36.86 |
15,521.97 |
-0.24% |
|
Volume |
579,164,110 |
-3% |
|
Volume |
1,428,900,980 |
-14% |
|
NASDAQ |
-13.31 |
3,599.85 |
-0.37% |
|
Advancers |
906 |
29% |
|
Advancers |
798 |
31% |
|
S&P 500 |
-6.32 |
1,685.33 |
-0.37% |
|
Decliners |
2,104 |
68% |
|
Decliners |
1,702 |
66% |
|
Russell 2000 |
-7.85 |
1,040.66 |
-0.75% |
|
52 Wk Highs |
90 |
|
|
52 Wk Highs |
97 |
|
|
S&P 600 |
-3.78 |
584.89 |
-0.64% |
|
52 Wk Lows |
38 |
|
|
52 Wk Lows |
17 |
|
|
 |
Breadth Negative as Major Averages Fall on Lighter Volume Totals
Kenneth J. Gruneisen - Passed the CAN SLIM® Master's Exam
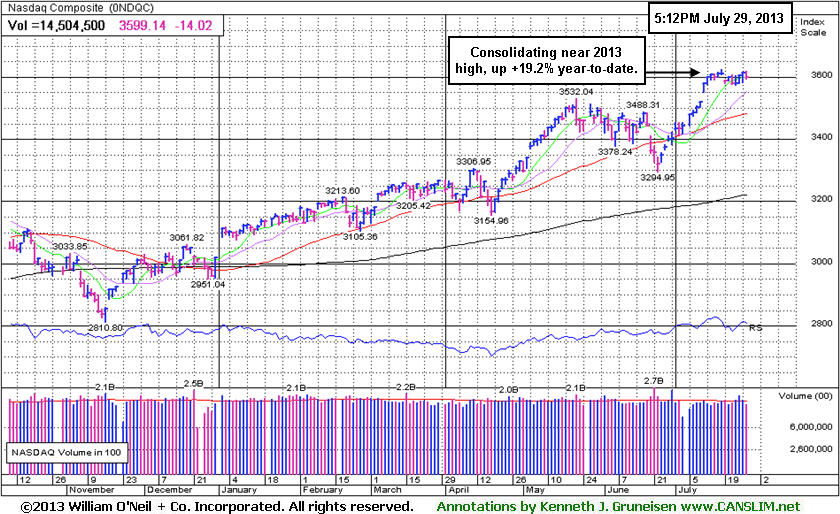
The major averages rebounded from early lows but slumped again in the final hour and finished with small losses on Monday. Volume totals were reported lighter than the prior session totals on the NYSE and on the Nasdaq exchange, suggesting that institutional selling was not to blame for the market's weakness. Decliners led advancers by more than a 2-1 margin on the Nasdaq exchange and on the NYSE. There were 34 high-ranked companies from the CANSLIM.net Leaders List made new 52-week highs and appeared on the CANSLIM.net BreakOuts Page, down from the prior session total of 54 stocks. The list of stocks hitting new 52-week highs outnumbered new 52-week lows on both the NYSE and the Nasdaq exchange. There were gains for only 3 of the 12 high-ranked companies currently included on the Featured Stocks Page.
Stocks spent the session in negative territory after a report showed pending home sales declined -0.4% in June. Market action also was lower as investors awaited the start to the Fed's two-day policy meeting starting Tuesday and Friday's employment report. It is also a busy week for earnings with more than 130 companies in the S&P 500 due to release second quarter results.
Wynn Resorts Ltd (WYNN +0.22%) eked out a small gain after quarterly results fell short of projections. Energy shares including Exxon Mobil Corp (XOM -0.80%) edged lower after it reduced rates at the 238,000-barrel-a-day Joliet, Illinois, refinery, the fifth-largest plant in the U.S. Midwest. Weyerhaeuser Co (WY -2.81%) fell after beating earnings estimates but forecasting tighter profits. The telecom sector outperformed with AT&T Inc (T +0.79%). Saks Inc (SKS +4.18%) rose after the high-end retailer agreed to be acquired by Canada's Hudson's Bay for $2.9 billion. Shares of Herbalife Ltd (HLF +3.63%) rose ahead of its profit release after the closing bell.
The market (M criteria) has flashed substantial strength and leadership. Now in a confirmed rally, odds are considered favorable for investors' success with new buying efforts. Investors should be disciplined and selective while looking to be proactive and focused exclusively on the individual leaders best matching the winning models of the fact-based investment system. Study the companies on the CANSLIM.net Featured Stocks Page - a page showing the most action-worthy candidates' latest notes and links to additional resources including detailed analysis with data-packed graphs which are annotated by a Certified expert. The Premium Member Homepage - includes "dynamic archives" to all prior pay reports published. Watch for an announcement via email concerning the next WEBCAST.
PICTURED: The Nasdaq Composite Index is consolidating in a tight range near its 2013 high with a +19.2% year-to-date gain.
|
 Kenneth J. Gruneisen started out as a licensed stockbroker in August 1987, a couple of months prior to the historic stock market crash that took the Dow Jones Industrial Average down -22.6% in a single day. He has published daily fact-based fundamental and technical analysis on high-ranked stocks online for two decades. Through FACTBASEDINVESTING.COM, Kenneth provides educational articles, news, market commentary, and other information regarding proven investment systems that work in good times and bad.
Comments contained in the body of this report are technical opinions only and are not necessarily those of Gruneisen Growth Corp. The material herein has been obtained from sources believed to be reliable and accurate, however, its accuracy and completeness cannot be guaranteed. Our firm, employees, and customers may effect transactions, including transactions contrary to any recommendation herein, or have positions in the securities mentioned herein or options with respect thereto. Any recommendation contained in this report may not be suitable for all investors and it is not to be deemed an offer or solicitation on our part with respect to the purchase or sale of any securities. |
|
 |
Financial, Tech, Retail, Healthcare and Commodity-Linked Groups Fell
Kenneth J. Gruneisen - Passed the CAN SLIM® Master's Exam
Financial shares pulled back and created a drag on the major averages on Monday as the Broker/Dealer Index ($XBD -0.93%) and the Bank Index ($BKX -0.89%) lost ground. The tech sector saw unanimous losses from the Biotechnology Index ($BTK -1.49%), Semiconductor Index ($SOX -0.67%), Internet Index ($IIX -0.63%), and the Networking Index ($NWX -0.42%). The Retail Index ($RLX -0.51%) and the Healthcare Index ($HMO -0.43%) also suffered modest losses. Commodity-linked groups rounded out a solidly negative session as the Oil Services Index ($OSX -0.98%), Integrated Oil Index ($XOI -0.78%), and the Gold & Silver Index ($XAU -0.86%) collectively lost ground.
Charts courtesy www.stockcharts.com
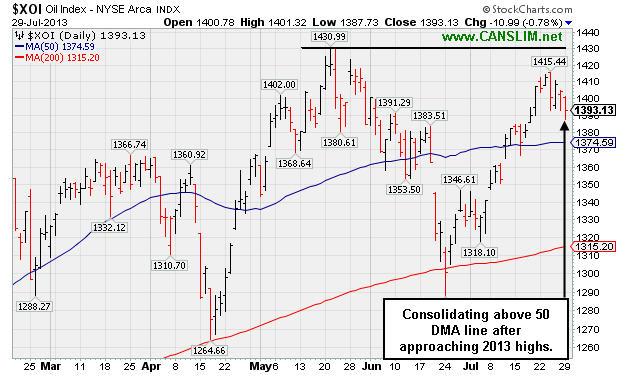
PICTURED: The Integrated Oil Index ($XOI -0.78%) is consolidating above its 50-day moving average (DMA) line after recently approaching its 2013 highs.
| Oil Services |
$OSX |
260.21 |
-2.58 |
-0.98% |
+18.19% |
| Healthcare |
$HMO |
3,381.68 |
-14.75 |
-0.43% |
+34.50% |
| Integrated Oil |
$XOI |
1,393.13 |
-10.99 |
-0.78% |
+12.18% |
| Semiconductor |
$SOX |
469.97 |
-3.15 |
-0.67% |
+22.37% |
| Networking |
$NWX |
281.05 |
-1.18 |
-0.42% |
+24.06% |
| Internet |
$IIX |
402.15 |
-2.56 |
-0.63% |
+22.98% |
| Broker/Dealer |
$XBD |
132.70 |
-1.24 |
-0.93% |
+40.67% |
| Retail |
$RLX |
833.16 |
-4.23 |
-0.51% |
+27.58% |
| Gold & Silver |
$XAU |
100.01 |
-0.87 |
-0.86% |
-39.61% |
| Bank |
$BKX |
65.39 |
-0.59 |
-0.89% |
+27.52% |
| Biotech |
$BTK |
2,112.18 |
-31.87 |
-1.49% |
+36.53% |
|
|
|
 |
Extended from Prior Base Following Volume-Driven Gains
Kenneth J. Gruneisen - Passed the CAN SLIM® Master's Exam
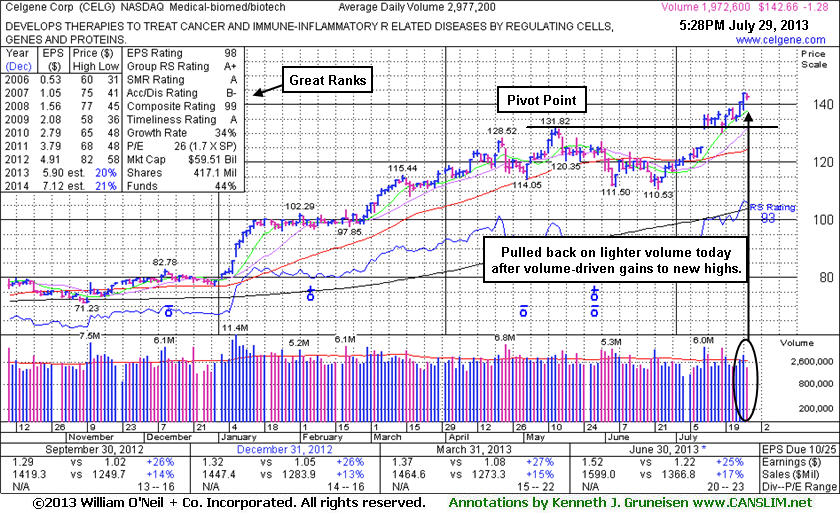
Celgene Corp (CELG -$1.28 or -0.89% to $142.66) ended with a small loss on light volume today following solid gains and a best-ever close with above average volume last week. Prior highs define initial support to watch in the $131 area. It has tallied 5 consecutive weekly gains and it found support when consolidating above prior highs following its "breakaway gap" when last shown in this FSU section on 7/11/13 with an annotated graph under the headline, "Finished Strong After Breakaway Gap to a New 52-Week High". Members were reminded - "Today's technical buy signal was coupled with strong action in the broader market (M criteria) which encourages investors to increase their buying efforts in worthy looking candidates." It had convincingly cleared the pivot point based on its 5/14/13 high plus 10 cents which was cited in the 7/11/13 mid-day report (read here) after it gapped up. A technical buy signal was triggered by its considerable gain backed by twice its average daily trading volume.
CELG reported earnings +25% on +17% sales revenues for the Jun '13 quarter versus the year ago period, maintaining its strong earnings history (C and A criteria). The stock's Accumulation/ Distribution Rating has been improving and it has earned high ranks. The number of top-rated funds owning its shares rose from 1,623 in Dec '11 to 1,903 in Jun '13, a reassuring trend concerning the I criteria. However, the company is already well-known by the institutional crowd, and that means that very few are likely to just be discovering it. Disciplined investors avoid chasing extended stocks and they always limit losses by selling is any stock falls more than -7% from their purchase price.
|
|
|
Color Codes Explained :
Y - Better candidates highlighted by our
staff of experts.
G - Previously featured
in past reports as yellow but may no longer be buyable under the
guidelines.
***Last / Change / Volume data in this table is the closing quote data***
Symbol/Exchange
Company Name
Industry Group |
PRICE |
CHANGE
(%Change) |
Day High |
Volume
(% DAV)
(% 50 day avg vol) |
52 Wk Hi
% From Hi |
Featured
Date |
Price
Featured |
Pivot Featured |
|
Max Buy |
AMBA
-
NASDAQ
Ambarella Inc
ELECTRONICS - Semiconductor - Specialized
|
$17.52
|
-0.84
-4.58% |
$18.35
|
1,330,411
110.69% of 50 DAV
50 DAV is 1,201,900
|
$19.44
-9.87%
|
7/15/2013
|
$17.87
|
PP = $18.68
|
|
MB = $19.61
|
 Most Recent Note - 7/29/2013 1:41:59 PM
Y - Slumping further below its pivot point and into the prior base, near its 50 DMA line with higher volume behind today's loss indicating distributional pressure. Any damaging violation of its 50 DMA line may raise concerns and trigger a technical sell signal.
>>> The latest Featured Stock Update with an annotated graph appeared on 7/17/2013. Click here.
View all notes |
Alert me of new notes |
CANSLIM.net Company Profile |
SEC |
Zacks Reports |
StockTalk |
News |
Chart |
Request a new note
C
A N
S L
I M


|
CELG
-
NASDAQ
Celgene Corp
DRUGS - Drug Manufacturers - Major
|
$142.66
|
-1.28
-0.89% |
$143.79
|
1,974,804
67.00% of 50 DAV
50 DAV is 2,947,600
|
$144.15
-1.03%
|
7/11/2013
|
$133.25
|
PP = $131.92
|
|
MB = $138.52
|
Most Recent Note - 7/29/2013 6:00:46 PM
G - Extended from its prior base after last week's volume-driven gains, it is now consolidating above prior highs defining initial support in the $131 area. See the latest FSU analysis for more details and a new annotated graph.
>>> The latest Featured Stock Update with an annotated graph appeared on 7/29/2013. Click here.
View all notes |
Alert me of new notes |
CANSLIM.net Company Profile |
SEC |
Zacks Reports |
StockTalk |
News |
Chart |
Request a new note
C
A N
S L
I M
|
FLT
-
NYSE
Fleetcor Technologies
DIVERSIFIED SERVICES - Business/Management Services
|
$89.12
|
-1.34
-1.48% |
$90.43
|
378,743
50.05% of 50 DAV
50 DAV is 756,700
|
$90.92
-1.98%
|
5/29/2013
|
$86.02
|
PP = $85.66
|
|
MB = $89.94
|
Most Recent Note - 7/26/2013 5:04:34 PM
G- Rallied for a new all-time high today with a gain lacking great volume conviction. Found support near its 50 DMA during its latest consolidation.
>>> The latest Featured Stock Update with an annotated graph appeared on 7/18/2013. Click here.
View all notes |
Alert me of new notes |
CANSLIM.net Company Profile |
SEC |
Zacks Reports |
StockTalk |
News |
Chart |
Request a new note
C
A N
S L
I M
|
LOPE
-
NASDAQ
Grand Canyon Education
DIVERSIFIED SERVICES - Education and; Training Services
|
$35.49
|
-0.25
-0.70% |
$36.05
|
237,299
56.01% of 50 DAV
50 DAV is 423,700
|
$36.45
-2.63%
|
6/19/2013
|
$31.47
|
PP = $34.17
|
|
MB = $35.88
|
Most Recent Note - 7/24/2013 6:28:19 PM
Y - Reversed into the red for a loss with above average volume, ending just below its "max buy" level . Prior highs in the $34 area define initial support above its 50 DMA line. Reports its second quarter results after market close on Tuesday, July 30, 2013.
>>> The latest Featured Stock Update with an annotated graph appeared on 7/19/2013. Click here.
View all notes |
Alert me of new notes |
CANSLIM.net Company Profile |
SEC |
Zacks Reports |
StockTalk |
News |
Chart |
Request a new note
C
A N
S L
I M
|
PCLN
-
NASDAQ
Priceline.Com Inc
INTERNET - Internet Software and Services
|
$888.11
|
-11.97
-1.33% |
$904.69
|
444,805
63.33% of 50 DAV
50 DAV is 702,400
|
$926.40
-4.13%
|
7/8/2013
|
$878.28
|
PP = $847.43
|
|
MB = $889.80
|
Most Recent Note - 7/29/2013 1:52:10 PM
G - Due to report earnings August 8th. Extended from its prior base, enduring distributional pressure while consolidating in a tight range near its high. Prior highs in the $847 area define support to watch on pullbacks.
>>> The latest Featured Stock Update with an annotated graph appeared on 7/25/2013. Click here.
View all notes |
Alert me of new notes |
CANSLIM.net Company Profile |
SEC |
Zacks Reports |
StockTalk |
News |
Chart |
Request a new note
C
A N
S L
I M
|
Symbol/Exchange
Company Name
Industry Group |
PRICE |
CHANGE
(%Change) |
Day High |
Volume
(% DAV)
(% 50 day avg vol) |
52 Wk Hi
% From Hi |
Featured
Date |
Price
Featured |
Pivot Featured |
|
Max Buy |
PRLB
-
NYSE
Proto Labs Inc
MANUFACTURING - Small Tools and Accessories
|
$64.96
|
+0.93
1.45% |
$66.34
|
407,805
94.73% of 50 DAV
50 DAV is 430,500
|
$67.40
-3.62%
|
7/29/2013
|
$64.86
|
PP = $67.50
|
|
MB = $70.88
|
Most Recent Note - 7/29/2013 1:59:10 PM
Y - Color code is changed to yellow and a new pivot point is cited based on its 6/28/13 high plus 10 cents. Due to report financial results for the second quarter of 2013 before the opening of the market on Thursday, Aug. 1, 2013. A volume-driven gain above its pivot point may trigger a new (or add-on) technical buy signal. Holding its ground in a tight rage with volume totals cooling while consolidating in an orderly fashion above prior highs and its 50 DMA line defining important support.
>>> The latest Featured Stock Update with an annotated graph appeared on 7/15/2013. Click here.
View all notes |
Alert me of new notes |
CANSLIM.net Company Profile |
SEC |
Zacks Reports |
StockTalk |
News |
Chart |
Request a new note
C
A N
S L
I M
|
RRTS
-
NYSE
Roadrunner Trans Systems
TRANSPORTATION - Air Delivery and Freight Service
|
$30.21
|
-0.17
-0.56% |
$30.48
|
60,322
39.43% of 50 DAV
50 DAV is 153,000
|
$30.50
-0.95%
|
4/3/2013
|
$22.77
|
PP = $23.75
|
|
MB = $24.94
|
Most Recent Note - 7/29/2013 1:34:59 PM
G - Still perched near its 52-week high with volume totals cooling while consolidating in a tight trading range for the past few weeks. Reports results for the Jun '13 quarter on Wednesday, July 31, 2013 after market close.
>>> The latest Featured Stock Update with an annotated graph appeared on 7/22/2013. Click here.
View all notes |
Alert me of new notes |
CANSLIM.net Company Profile |
SEC |
Zacks Reports |
StockTalk |
News |
Chart |
Request a new note
C
A N
S L
I M
|
SFUN
-
NYSE
Soufun Hldgs Ltd Ads A
INTERNET - Internet Information Providers
|
$34.18
|
-2.11
-5.81% |
$36.28
|
928,322
306.78% of 50 DAV
50 DAV is 302,600
|
$36.43
-6.18%
|
7/16/2013
|
$29.54
|
PP = $27.90
|
|
MB = $29.30
|
Most Recent Note - 7/29/2013 1:09:36 PM
G - Abruptly retreating from its all-time high today with above average volume behind its loss after getting extended from its latest base with a spurt of volume-driven gains last week. Prior highs in the $28-29 area define initial support to watch.
>>> The latest Featured Stock Update with an annotated graph appeared on 7/16/2013. Click here.
View all notes |
Alert me of new notes |
CANSLIM.net Company Profile |
SEC |
Zacks Reports |
StockTalk |
News |
Chart |
Request a new note
C
A N
S L
I M
|
SSNC
-
NASDAQ
S S & C Technologies
COMPUTER SOFTWARE and SERVICES - Application Software
|
$35.64
|
+0.05
0.14% |
$35.87
|
325,573
83.50% of 50 DAV
50 DAV is 389,900
|
$38.47
-7.36%
|
7/11/2013
|
$35.80
|
PP = $34.54
|
|
MB = $36.27
|
Most Recent Note - 7/26/2013 6:07:04 PM
Y - Loss today with above average volume was a sign of distributional pressure. Color code is changed to yellow after slumping below its "max buy" level. Prior highs in the $34 area define initial support to watch above its 50 DMA line.
>>> The latest Featured Stock Update with an annotated graph appeared on 7/12/2013. Click here.
View all notes |
Alert me of new notes |
CANSLIM.net Company Profile |
SEC |
Zacks Reports |
StockTalk |
News |
Chart |
Request a new note
C
A N
S L
I M
|
SSYS
-
NASDAQ
Stratasys Ltd
COMPUTER HARDWARE - Computer Peripherals
|
$92.32
|
+4.17
4.73% |
$93.45
|
1,006,262
134.46% of 50 DAV
50 DAV is 748,400
|
$96.44
-4.27%
|
7/8/2013
|
$91.44
|
PP = $95.00
|
|
MB = $99.75
|
Most Recent Note - 7/29/2013 1:44:05 PM
Y - Rallying up from support at its 50 DMA line today with a solid gain backed by higher volume. Relative Strength Rating has slumped to 71 while consolidating, below the 80+ minimum guideline for buy candidates.
>>> The latest Featured Stock Update with an annotated graph appeared on 7/24/2013. Click here.
View all notes |
Alert me of new notes |
CANSLIM.net Company Profile |
SEC |
Zacks Reports |
StockTalk |
News |
Chart |
Request a new note
C
A N
S L
I M
|
Symbol/Exchange
Company Name
Industry Group |
PRICE |
CHANGE
(%Change) |
Day High |
Volume
(% DAV)
(% 50 day avg vol) |
52 Wk Hi
% From Hi |
Featured
Date |
Price
Featured |
Pivot Featured |
|
Max Buy |
VRX
-
NYSE
Valeant Pharmaceuticals
DRUGS - Drug Manufacturers - Other
|
$91.70
|
-0.26
-0.28% |
$92.24
|
666,411
33.00% of 50 DAV
50 DAV is 2,019,300
|
$96.25
-4.73%
|
4/30/2013
|
$60.24
|
PP = $76.66
|
|
MB = $80.49
|
Most Recent Note - 7/29/2013 1:37:46 PM
Y- Volume totals have still been cooling while consolidating near its 52-week high after completing a new Public Offering on 6/18/13 following recent M&A news. Formed a cup-with-handle base over the past 9 weeks, however no new pivot point has been cited while members were repeatedly cautioned - "Concerns were raised by its Mar '13 earnings report with only a +14% earnings increase, below the +25% minimum guideline (C criteria) for buy candidates."
>>> The latest Featured Stock Update with an annotated graph appeared on 7/23/2013. Click here.
View all notes |
Alert me of new notes |
CANSLIM.net Company Profile |
SEC |
Zacks Reports |
StockTalk |
News |
Chart |
Request a new note
C
A N
S L
I M
|
YNDX
-
NASDAQ
Yandex N V Class A
INTERNET - Internet Information Providers
|
$31.99
|
-1.43
-4.28% |
$33.31
|
2,477,597
98.63% of 50 DAV
50 DAV is 2,512,100
|
$33.66
-4.96%
|
7/10/2013
|
$29.29
|
PP = $29.59
|
|
MB = $31.07
|
Most Recent Note - 7/29/2013 1:45:38 PM
G - Retreating form its 52-week high today after getting extended following 2 consecutive volume-driven gains into new high territory. Prior highs in the $28-29 area define near-term support to watch.
>>> The latest Featured Stock Update with an annotated graph appeared on 7/26/2013. Click here.
View all notes |
Alert me of new notes |
CANSLIM.net Company Profile |
SEC |
Zacks Reports |
StockTalk |
News |
Chart |
Request a new note
C
A N
S L
I M
|
|
|
|
THESE ARE NOT BUY RECOMMENDATIONS!
Comments contained in the body of this report are technical
opinions only. The material herein has been obtained
from sources believed to be reliable and accurate, however,
its accuracy and completeness cannot be guaranteed.
This site is not an investment advisor, hence it does
not endorse or recommend any securities or other investments.
Any recommendation contained in this report may not
be suitable for all investors and it is not to be deemed
an offer or solicitation on our part with respect to
the purchase or sale of any securities. All trademarks,
service marks and trade names appearing in this report
are the property of their respective owners, and are
likewise used for identification purposes only.
This report is a service available
only to active Paid Premium Members.
You may opt-out of receiving report notifications
at any time. Questions or comments may be submitted
by writing to Premium Membership Services 665 S.E. 10 Street, Suite 201 Deerfield Beach, FL 33441-5634 or by calling 1-800-965-8307
or 954-785-1121.
|
|
|

