You are not logged in.
This means you
CAN ONLY VIEW reports that were published prior to Monday, April 14, 2025.
You
MUST UPGRADE YOUR MEMBERSHIP if you want to see any current reports.
AFTER MARKET UPDATE - THURSDAY, JULY 29TH, 2010
Previous After Market Report Next After Market Report >>>
|
|
|
|
DOW |
-30.72 |
10,467.16 |
-0.29% |
|
Volume |
1,179,991,620 |
+17% |
|
Volume |
2,292,181,930 |
+26% |
|
NASDAQ |
-12.87 |
2,251.69 |
-0.57% |
|
Advancers |
1,584 |
50% |
|
Advancers |
1,260 |
46% |
|
S&P 500 |
-4.60 |
1,101.53 |
-0.42% |
|
Decliners |
1,450 |
46% |
|
Decliners |
1,364 |
50% |
|
Russell 2000 |
-0.33 |
650.43 |
-0.05% |
|
52 Wk Highs |
155 |
|
|
52 Wk Highs |
43 |
|
|
S&P 600 |
-0.27 |
348.94 |
-0.08% |
|
52 Wk Lows |
18 |
|
|
52 Wk Lows |
36 |
|
|
 |
New Highs Increase Despite Mild Distributional Pressure
Adam Sarhan, Contributing Writer,
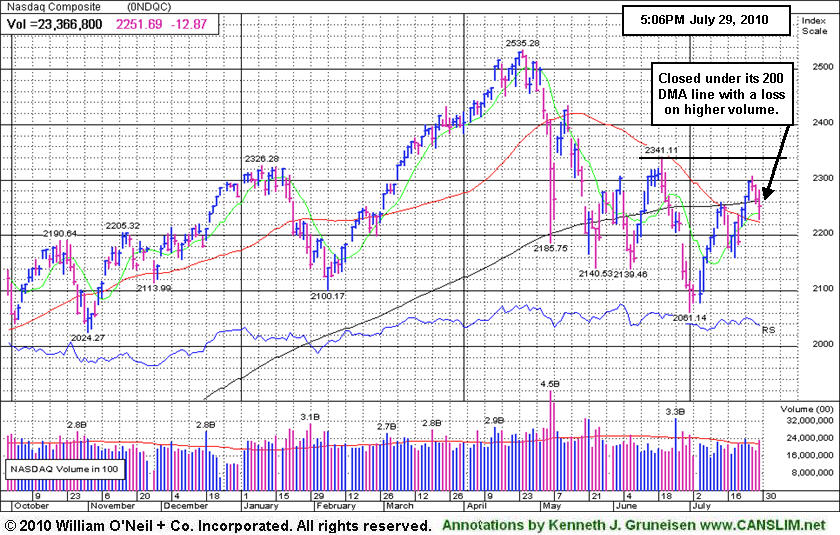
The major averages negatively reversed on Thursday after encountering resistance near their prior chart highs. Volume, an important indicator of institutional sponsorship, was higher than Wednesday's session which marked a distribution day for the NYSE and the Nasdaq exchange. Advancers and decliners were evenly matched on the NYSE and on the Nasdaq exchange, but the NYSE had a slightly positive bias while the Nasdaq had a slightly negative bias. New 52-week highs outnumbered new 52-week lows on the NYSE and the Nasdaq exchange. There were 21 high-ranked companies from the CANSLIM.net Leaders List that made a new 52-week high and appeared on the CANSLIM.net BreakOuts Page, higher than the 14 issues that appeared on the prior session. Despite the distributional action in the major indices, the expansion in the number of high-ranked leaders reaching new highs was a nice reassurance.
Several high profile technology stocks got smacked after Akamai Technologies Inc. (AKAM -12.90%), Nvidia (NVDA -9.87%), and Symantec Corp. (SYMC -11.18%) released weak Q2 results. Financial shares fared reasonably well for the most part after New York Attorney General Andrew Cuomo began a fraud probe into the life insurance industry and subpoenaed several well-known firms.
Elsewhere, the Labor Department said jobless claims fell last week and confidence improved about Europe's economy. Stocks turned tail after James Bullard, President of the Federal Reserve Bank of St. Louis, said the central bank should resume purchases of Treasury securities if the economy slows and deflation sets in. On Friday, the US government is slated to release Q2 GDP figures which will give investors the latest read on the economy.
The major averages are still above their respective 2-month downward trendlines which is a healthy sign. However, the Nasdaq Composite, NYSE Composite, and the benchmark S&P 500 indexes collectively closed below their respective 200-day moving average (DMA) lines which is not ideal. In order for a new leg higher to begin, the major averages will have to ratchet above their longer term averages and close above their recent chart highs which currently serve as the next levels of resistance to watch. The window remains open for for high-ranked stocks to be accumulated when they trigger fresh technical buy signals. Trade accordingly.
PICTURED: The Nasdaq Composite Index fell on higher volume and closed below its 200 DMA line.
|
|
|
 |
Tech Sector Weakness Caused Nasdaq Composite To Lag
Kenneth J. Gruneisen - Passed the CAN SLIM® Master's Exam
The tech sector clearly lagged on Thursday as the Networking Index ($NWX -3.01%), Semiconductor Index ($SOX -1.93%), Internet Index ($IIX -1.06%), and Biotechnology Index ($BTK -0.81%) ended unanimously lower on Thursday. The Retail Index ($RLX -0.68%) also ended modestly lower. Meanwhile the Broker/Dealer Index ($XBD +1.49%) posted a decent gain while the Bank Index ($BKX +0.02%) held its ground. Generally defensive groups edged higher as the Healthcare Index ($HMO +0.44%) and Gold & Silver Index ($XAU +0.46%) posted small gains and strength in the energy group gave the Integrated Oil Index ($XOI +0.52%) and Oil Services Index ($OSX +1.40%) a boost.
Charts courtesy www.stockcharts.com
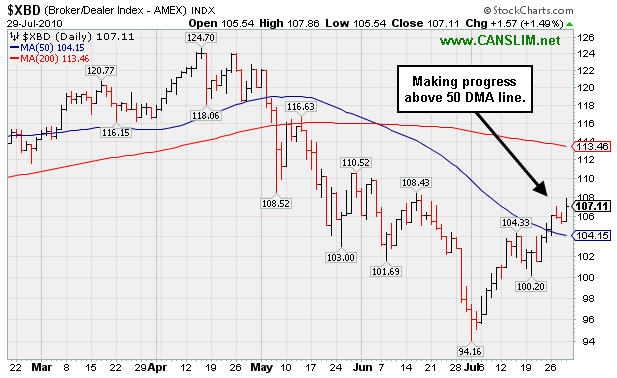
PICTURED: The Broker/Dealer Index ($XBD +1.49%) is currently making progress above its 50 DMA line.
| Oil Services |
$OSX |
182.21 |
+2.51 |
+1.40% |
-6.52% |
| Healthcare |
$HMO |
1,412.41 |
+6.13 |
+0.44% |
-4.11% |
| Integrated Oil |
$XOI |
977.78 |
+5.03 |
+0.52% |
-8.47% |
| Semiconductor |
$SOX |
352.52 |
-6.95 |
-1.93% |
-2.05% |
| Networking |
$NWX |
237.04 |
-7.36 |
-3.01% |
+2.59% |
| Internet |
$IIX |
241.70 |
-2.58 |
-1.06% |
+3.35% |
| Broker/Dealer |
$XBD |
107.11 |
+1.57 |
+1.49% |
-6.90% |
| Retail |
$RLX |
400.91 |
-2.74 |
-0.68% |
-2.48% |
| Gold & Silver |
$XAU |
167.55 |
+0.77 |
+0.46% |
-0.42% |
| Bank |
$BKX |
48.75 |
+0.01 |
+0.02% |
+14.14% |
| Biotech |
$BTK |
1,049.75 |
-8.62 |
-0.81% |
+11.42% |
|
|
|
 |
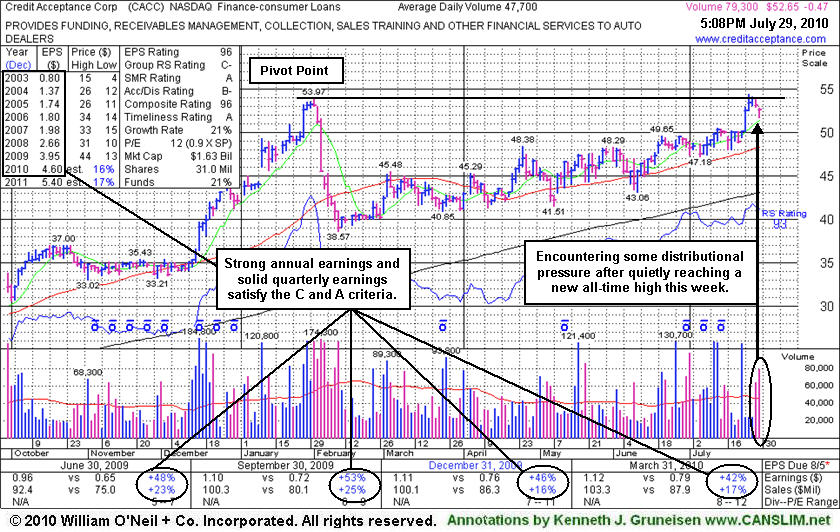
Matches Key Criteria While Firm GM Plans To Buy Does Not
Kenneth J. Gruneisen - Passed the CAN SLIM® Master's Exam
Credit Acceptance Corp (CACC -$0.47 or -0.88% to $52.65) has steadily risen since finding support above the $38 area cited as a support level to watch when it was last shown in this FSU section on 3/02/10 under the headline, "Gain Above 50 DMA Line Helps, But More Time And Constructive Action Needed." It is consolidating near all-time highs after quietly reaching new high territory this week. It was featured in the mid-day report today (read here) in yellow with a new pivot point cited is based on its 2/01/10 high plus ten cents. A powerful breakout should occur before new buying efforts would be justifiable under the investment system's strict technical buying discipline. Its small supply (S criteria) of only 5.89 million shares in the public float could contribute to greater volatility in the event of any new institutional posturing.
Its strong quarterly and annual earnings track record satisfies the C and A criteria of the investment system. It is a good match with the fact-based investment system's fundamental guidelines, as opposed to its peer in the Finance - Consumer Loans group, Americredit Corp (ACF), which recently bankrupted GM bid to acquire the day after President Obama signed into law the Dodd-Frank Wall Street Reform and Consumer Protection Act.
Based on weak action CACC was dropped from the Featured Stocks list on 3/16/10. An earlier FSU section appearance on 2/09/10 included an annotated graph under the headline "Damaging Losses Prompted Profit Taking". It produced gains of as much as +61.2% since it was first featured in yellow at $33.48 in the 9/29/09 mid-day report (read here).
|
|
|
Color Codes Explained :
Y - Better candidates highlighted by our
staff of experts.
G - Previously featured
in past reports as yellow but may no longer be buyable under the
guidelines.
***Last / Change / Volume data in this table is the closing quote data***
Symbol/Exchange
Company Name
Industry Group |
PRICE |
CHANGE
(%Change) |
Day High |
Volume
(% DAV)
(% 50 day avg vol) |
52 Wk Hi
% From Hi |
Featured
Date |
Price
Featured |
Pivot Featured |
|
Max Buy |
AAPL
-
NASDAQ
Apple Inc
COMPUTER HARDWARE - Personal Computers
|
$258.11
|
-2.85
-1.09% |
$262.65
|
22,979,835
80.58% of 50 DAV
50 DAV is 28,518,000
|
$279.01
-7.49%
|
6/17/2010
|
$270.95
|
PP = $272.56
|
|
MB = $286.19
|
Most Recent Note - 7/27/2010 4:07:04 PM
Y - Gain today with light volume continues its recent rebound above its 50 DMA line. Consolidating for the 6th week since its negative reversal on 6/21/10 at its all-time high, its color code is changed to yellow with new pivot point cited.
>>> The latest Featured Stock Update with an annotated graph appeared on 7/12/2010. Click here.
View all notes |
Alert me of new notes |
CANSLIM.net Company Profile |
SEC |
Zacks Reports |
StockTalk |
News |
Chart |
Request a new note
C
A N
S L
I M


|
ABV
-
NYSE
Comp De Bebidas Adr
FOOD and BEVERAGE - Beverages - Brewers
|
$109.20
|
+0.38
0.35% |
$110.68
|
481,316
65.88% of 50 DAV
50 DAV is 730,600
|
$109.78
-0.53%
|
6/29/2010
|
$104.74
|
PP = $109.33
|
|
MB = $114.80
|
Most Recent Note - 7/27/2010 4:10:30 PM
Y - This Brazil-based beverage firm is quietly holding its ground after reaching a new 52-week high, but it has not triggered a recent technical buy signal. It found support near its 50 DMA line since featured in the 6/29/10 mid-day report.
>>> The latest Featured Stock Update with an annotated graph appeared on 7/20/2010. Click here.
View all notes |
Alert me of new notes |
CANSLIM.net Company Profile |
SEC |
Zacks Reports |
StockTalk |
News |
Chart |
Request a new note
C
A N
S L
I M
|
BIDU
-
NASDAQ
Baidu Inc Ads
INTERNET - Internet Information Providers
|
$79.20
|
-0.20
-0.25% |
$80.46
|
9,144,457
73.32% of 50 DAV
50 DAV is 12,471,400
|
$82.29
-3.76%
|
7/14/2010
|
$75.03
|
PP = $78.59
|
|
MB = $82.52
|
Most Recent Note - 7/28/2010 4:34:37 PM
Y - Pulled back on lighter volume today after 4consecutive gains helped it rise to within 30 cents of its all-time high. Latest quarter ended June 30, 2010 showed sales revenues growth still accelerating and earnings increasing by triple digit percentages for the 2nd consecutive comparison.
>>> The latest Featured Stock Update with an annotated graph appeared on 7/14/2010. Click here.
View all notes |
Alert me of new notes |
CANSLIM.net Company Profile |
SEC |
Zacks Reports |
StockTalk |
News |
Chart |
Request a new note
C
A N
S L
I M
|
CACC
-
NASDAQ
Credit Acceptance Corp
FINANCIAL SERVICES - Credit Services
|
$52.65
|
-0.47
-0.88% |
$52.79
|
80,088
168.25% of 50 DAV
50 DAV is 47,600
|
$54.45
-3.30%
|
7/29/2010
|
$52.04
|
PP = $54.07
|
|
MB = $56.77
|
 Most Recent Note - 7/29/2010 12:39:35 PM
Y - Consolidating near all-time highs after quietly reaching new high territory this week. Color code is changed to yellow and new pivot point cited is based on its 2/01/10 high plus ten cents. Its quarterly and annual earnings track record is a good match with the fact-based investment system's fundamental guidelines, as opposed to its peer in the Finance - Consumer Loans group, Americredit Corp (ACF), which recently bankrupted GM bid to acquire the day after President Obama signed into law the Dodd-Frank Wall Street Reform and Consumer Protection Act. Based on weak action CACC was dropped from the Featured Stocks list on 3/16/10. It has steadily risen since subsequently finding support above the $38 area cited as a support level to watch.
>>> The latest Featured Stock Update with an annotated graph appeared on 3/2/2010. Click here.
View all notes |
Alert me of new notes |
CANSLIM.net Company Profile |
SEC |
Zacks Reports |
StockTalk |
News |
Chart |
Request a new note
C
A N
S L
I M
|
CRM
-
NYSE
Salesforce.Com Inc
INTERNET - Internet Software and Services
|
$97.79
|
-0.32
-0.33% |
$99.98
|
1,612,330
56.81% of 50 DAV
50 DAV is 2,838,100
|
$101.49
-3.65%
|
6/2/2010
|
$88.44
|
PP = $89.60
|
|
MB = $94.08
|
Most Recent Note - 7/27/2010 4:17:44 PM
G - Pulled back on lighter volume today after rising to a new 52-week highs on the 2 prior sessions with higher volume near average. On 7/23/10 it rose from a choppy 7-week base.
>>> The latest Featured Stock Update with an annotated graph appeared on 7/15/2010. Click here.
View all notes |
Alert me of new notes |
CANSLIM.net Company Profile |
SEC |
Zacks Reports |
StockTalk |
News |
Chart |
Request a new note
C
A N
S L
I M
|
Symbol/Exchange
Company Name
Industry Group |
PRICE |
CHANGE
(%Change) |
Day High |
Volume
(% DAV)
(% 50 day avg vol) |
52 Wk Hi
% From Hi |
Featured
Date |
Price
Featured |
Pivot Featured |
|
Max Buy |
DTSI
-
NASDAQ
D T S Inc
CONSUMER DURABLES - Electronic Equipment
|
$36.26
|
-0.34
-0.93% |
$36.79
|
85,952
82.02% of 50 DAV
50 DAV is 104,800
|
$37.50
-3.31%
|
7/27/2010
|
$37.00
|
PP = $36.28
|
|
MB = $38.09
|
Most Recent Note - 7/27/2010 4:20:02 PM
Y - Holding its ground above prior multi-year highs in the $35-36 area after its 7/23/10 gain with above average volume triggered a technical buy signal. It was featured in yellow in the 7/27/10 mid-day report (read here). Due to report earnings after the close on Monday, August 9th. Street estimates that are calling for lower FY '10 earnings are of some concern.
>>> The latest Featured Stock Update with an annotated graph appeared on 7/27/2010. Click here.
View all notes |
Alert me of new notes |
CANSLIM.net Company Profile |
SEC |
Zacks Reports |
StockTalk |
News |
Chart |
Request a new note
C
A N
S L
I M
|
FFIV
-
NASDAQ
F 5 Networks Inc
INTERNET - Internet Software and Services
|
$86.53
|
+0.75
0.87% |
$87.70
|
1,313,020
72.92% of 50 DAV
50 DAV is 1,800,700
|
$87.97
-1.64%
|
6/16/2010
|
$74.50
|
PP = $74.10
|
|
MB = $77.81
|
Most Recent Note - 7/27/2010 4:27:57 PM
G - Reversed into the red and closed with a small loss on lighter volume today after touching another new 52-week high. It is extended from a sound base, yet could go on to produce more climactic gains
>>> The latest Featured Stock Update with an annotated graph appeared on 7/7/2010. Click here.
View all notes |
Alert me of new notes |
CANSLIM.net Company Profile |
SEC |
Zacks Reports |
StockTalk |
News |
Chart |
Request a new note
C
A N
S L
I M
|
MELI
-
NASDAQ
Mercadolibre Inc
INTERNET - Internet Software and; Services
|
$60.60
|
-1.81
-2.90% |
$63.66
|
705,722
73.87% of 50 DAV
50 DAV is 955,300
|
$65.99
-8.17%
|
5/13/2010
|
$54.21
|
PP = $55.85
|
|
MB = $58.64
|
Most Recent Note - 7/29/2010 4:27:41 PM
G - Down for a 3rd consecutive session today with below average volume, slumping under prior chart highs in the $62 area after clearing a choppy 6-week consolidation with a gap up gain on 7/26/10.
>>> The latest Featured Stock Update with an annotated graph appeared on 7/23/2010. Click here.
View all notes |
Alert me of new notes |
CANSLIM.net Company Profile |
SEC |
Zacks Reports |
StockTalk |
News |
Chart |
Request a new note
C
A N
S L
I M
|
MWIV
-
NASDAQ
M W I Veterinary Supply
HEALTH SERVICES - Medical Instruments and; Supplies
|
$54.13
|
+6.25
13.05% |
$54.21
|
109,032
172.52% of 50 DAV
50 DAV is 63,200
|
$53.51
1.16%
|
7/29/2010
|
$52.05
|
PP = $52.09
|
|
MB = $54.69
|
Most Recent Note - 7/29/2010 4:35:48 PM
Y - Gapped up today after reporting strong earnings and raising guidance, repairing the recent 50 DMA line violation, and it was featured in the mid-day report (read here). No overhead supply remains to act as resistance after hitting a new 52-week high with a strong close above the pivot point cited (based on its 5/17/10 high plus ten cents) backed by +72% above average volume triggering a buy signal. It has a good annual earnings (A criteria) history, and the latest quarter ended June 30, 2010 showed more impressive sales and earnings acceleration after prior earnings comparisons showed improvement above the guidelines of the fact-based investment system. Its small supply (S criteria) of only 12.3 million shares outstanding could contribute to greater volatility in the event of institutional buying or selling.
There are no Featured Stock Updates™ available for this stock at this time. You may request one by clicking the Request a New Note link below
View all notes |
Alert me of new notes |
CANSLIM.net Company Profile |
SEC |
Zacks Reports |
StockTalk |
News |
Chart |
Request a new note
C
A N
S L
I M
|
NEM
-
NYSE
Newmont Mining Corp
METALS and MINING - Gold
|
$55.72
|
+0.32
0.58% |
$56.07
|
6,113,679
67.02% of 50 DAV
50 DAV is 9,122,400
|
$63.38
-12.09%
|
6/22/2010
|
$59.60
|
PP = $59.67
|
|
MB = $62.65
|
Most Recent Note - 7/28/2010 4:18:14 PM
G - Ended lower today after its latest strong earnings news. It faces some near-term resistance due to overhead supply after trading higher in the past month or more. A prompt rebound back above its 50 DMA would be an encouraging sign, but after its damaging gap down on 7/27/10, the recent action looks distributional.
>>> The latest Featured Stock Update with an annotated graph appeared on 7/9/2010. Click here.
View all notes |
Alert me of new notes |
CANSLIM.net Company Profile |
SEC |
Zacks Reports |
StockTalk |
News |
Chart |
Request a new note
C
A N
S L
I M
|
Symbol/Exchange
Company Name
Industry Group |
PRICE |
CHANGE
(%Change) |
Day High |
Volume
(% DAV)
(% 50 day avg vol) |
52 Wk Hi
% From Hi |
Featured
Date |
Price
Featured |
Pivot Featured |
|
Max Buy |
NEOG
-
NASDAQ
Neogen Corp
DRUGS - Diagnostic Substances
|
$28.87
|
-0.35
-1.20% |
$29.50
|
55,608
60.12% of 50 DAV
50 DAV is 92,500
|
$29.91
-3.46%
|
7/22/2010
|
$27.19
|
PP = $27.87
|
|
MB = $29.26
|
Most Recent Note - 7/29/2010 4:47:13 PM
Y - Down today on lighter volume while consolidating under its "max buy" level, its color code is changed to yellow again. Recent action has been bullish, as indicated by its current Up/Down Volume Ratio of 1.5, which is an unbiased indication of recent accumulation. Technically, the actual gains that lifted it above the pivot point cited lacked the volume conviction required after it was featured in the 7/22/10 mid-day report (read here).
>>> The latest Featured Stock Update with an annotated graph appeared on 7/22/2010. Click here.
View all notes |
Alert me of new notes |
CANSLIM.net Company Profile |
SEC |
Zacks Reports |
StockTalk |
News |
Chart |
Request a new note
C
A N
S L
I M
|
NETL
-
NASDAQ
Netlogic Microsystems
ELECTRONICS - Semiconductor - Memory Chips
|
$29.56
|
-3.24
-9.88% |
$31.24
|
4,156,922
317.52% of 50 DAV
50 DAV is 1,309,200
|
$35.00
-15.54%
|
7/28/2010
|
$33.44
|
PP = $35.10
|
|
MB = $36.86
|
Most Recent Note - 7/29/2010 1:59:48 PM
G - Gapped down today after its strong sales and earnings increases for the quarter ended June 30, 2010 disappointed analysts with higher expectations. It was featured in the 7/28/10 mid day report in yellow (read here) while setting up on the right side of a 12-week cup shaped pattern. Color code is changed to green based on its technical weakness. Noted in recent mid-day reports - "Based on weak technical action it was dropped from the Featured Stocks list on 7/11/08, and it subsequently fell from $31.73 to as low as $7.21 before rebounding impressively."
>>> The latest Featured Stock Update with an annotated graph appeared on 7/28/2010. Click here.
View all notes |
Alert me of new notes |
CANSLIM.net Company Profile |
SEC |
Zacks Reports |
StockTalk |
News |
Chart |
Request a new note
C
A N
S L
I M
|
ROVI
-
NASDAQ
Rovi Corp
COMPUTER SOFTWARE andamp; SERVICES - Security Software andamp; Services
|
$42.06
|
-0.19
-0.45% |
$43.00
|
1,347,598
106.14% of 50 DAV
50 DAV is 1,269,600
|
$44.85
-6.22%
|
6/3/2010
|
$38.70
|
PP = $40.16
|
|
MB = $42.17
|
Most Recent Note - 7/29/2010 4:40:20 PM
G - Raised its guidance along with its latest earnings news after the close today. Support is defined by prior resistance in the $40 area and its 50 DMA line.
>>> The latest Featured Stock Update with an annotated graph appeared on 7/21/2010. Click here.
View all notes |
Alert me of new notes |
CANSLIM.net Company Profile |
SEC |
Zacks Reports |
StockTalk |
News |
Chart |
Request a new note
C
A N
S L
I M
|
THOR
-
NASDAQ
Thoratec Corp
HEALTH SERVICES - Medical Instruments and Supplies
|
$42.54
|
-0.30
-0.70% |
$43.41
|
1,748,393
178.85% of 50 DAV
50 DAV is 977,600
|
$47.93
-11.25%
|
6/3/2010
|
$44.38
|
PP = $45.35
|
|
MB = $47.62
|
Most Recent Note - 7/29/2010 4:43:59 PM
G - This high-ranked Medical Products firm slumped further below its 50 DMA line today with a loss on higher volume. After the close it reported earnings and raised its guidance.
>>> The latest Featured Stock Update with an annotated graph appeared on 7/16/2010. Click here.
View all notes |
Alert me of new notes |
CANSLIM.net Company Profile |
SEC |
Zacks Reports |
StockTalk |
News |
Chart |
Request a new note
C
A N
S L
I M
|
ULTA
-
NASDAQ
Ulta Salon Cosm & Frag
SPECIALTY RETAIL - Specialty Retail, Other
|
$25.44
|
+0.83
3.37% |
$25.67
|
815,285
114.46% of 50 DAV
50 DAV is 712,300
|
$26.75
-4.90%
|
5/28/2010
|
$25.58
|
PP = $25.86
|
|
MB = $27.15
|
Most Recent Note - 7/29/2010 4:24:31 PM
G - Gapped up today and posted a solid gain better than average volume. It has not formed a sound new base since its June breakout attempt failed. Prior lows in the $22 area define the next support level just above its 200 DMA line.
>>> The latest Featured Stock Update with an annotated graph appeared on 7/19/2010. Click here.
View all notes |
Alert me of new notes |
CANSLIM.net Company Profile |
SEC |
Zacks Reports |
StockTalk |
News |
Chart |
Request a new note
C
A N
S L
I M
|
Symbol/Exchange
Company Name
Industry Group |
PRICE |
CHANGE
(%Change) |
Day High |
Volume
(% DAV)
(% 50 day avg vol) |
52 Wk Hi
% From Hi |
Featured
Date |
Price
Featured |
Pivot Featured |
|
Max Buy |
VIT
-
NYSE
Vanceinfo Tech Inc Ads
COMPUTER SOFTWARE and SERVICES - Business Software and Services
|
$24.90
|
-0.13
-0.52% |
$25.76
|
549,805
93.62% of 50 DAV
50 DAV is 587,300
|
$27.59
-9.75%
|
7/8/2010
|
$25.20
|
PP = $26.58
|
|
MB = $27.91
|
Most Recent Note - 7/28/2010 4:48:04 PM
Y - Today's 3rd consecutive loss has it pulling back to test support near its June high and an upward trendline, but slumping further below the pivot point cited in prior reports. It briefly matched its all-time high when it was featured in the 7/08/10 mid-day report (read here).
>>> The latest Featured Stock Update with an annotated graph appeared on 7/26/2010. Click here.
View all notes |
Alert me of new notes |
CANSLIM.net Company Profile |
SEC |
Zacks Reports |
StockTalk |
News |
Chart |
Request a new note
C
A N
S L
I M
|
|
|
|
THESE ARE NOT BUY RECOMMENDATIONS!
Comments contained in the body of this report are technical
opinions only. The material herein has been obtained
from sources believed to be reliable and accurate, however,
its accuracy and completeness cannot be guaranteed.
This site is not an investment advisor, hence it does
not endorse or recommend any securities or other investments.
Any recommendation contained in this report may not
be suitable for all investors and it is not to be deemed
an offer or solicitation on our part with respect to
the purchase or sale of any securities. All trademarks,
service marks and trade names appearing in this report
are the property of their respective owners, and are
likewise used for identification purposes only.
This report is a service available
only to active Paid Premium Members.
You may opt-out of receiving report notifications
at any time. Questions or comments may be submitted
by writing to Premium Membership Services 665 S.E. 10 Street, Suite 201 Deerfield Beach, FL 33441-5634 or by calling 1-800-965-8307
or 954-785-1121.
|
|
|


