You are not logged in.
This means you
CAN ONLY VIEW reports that were published prior to Monday, April 14, 2025.
You
MUST UPGRADE YOUR MEMBERSHIP if you want to see any current reports.
AFTER MARKET UPDATE - WEDNESDAY, JULY 29TH, 2009
Previous After Market Report Next After Market Report >>>
|
|
|
|
DOW |
-26.00 |
9,070.72 |
-0.29% |
|
Volume |
1,252,345,060 |
+1% |
|
Volume |
2,123,180,380 |
-5% |
|
NASDAQ |
-7.75 |
1,967.76 |
-0.39% |
|
Advancers |
1,181 |
38% |
|
Advancers |
1,027 |
37% |
|
S&P 500 |
-4.47 |
975.15 |
-0.46% |
|
Decliners |
1,833 |
59% |
|
Decliners |
1,644 |
58% |
|
Russell 2000 |
-3.57 |
548.38 |
-0.65% |
|
52 Wk Highs |
83 |
|
|
52 Wk Highs |
50 |
|
|
S&P 600 |
-1.83 |
290.51 |
-0.63% |
|
52 Wk Lows |
2 |
|
|
52 Wk Lows |
5 |
|
|
 |
Major Averages Edge Lower on a Wave of Earnings and Economic Data
Kenneth J. Gruneisen - Passed the CAN SLIM® Master's Exam
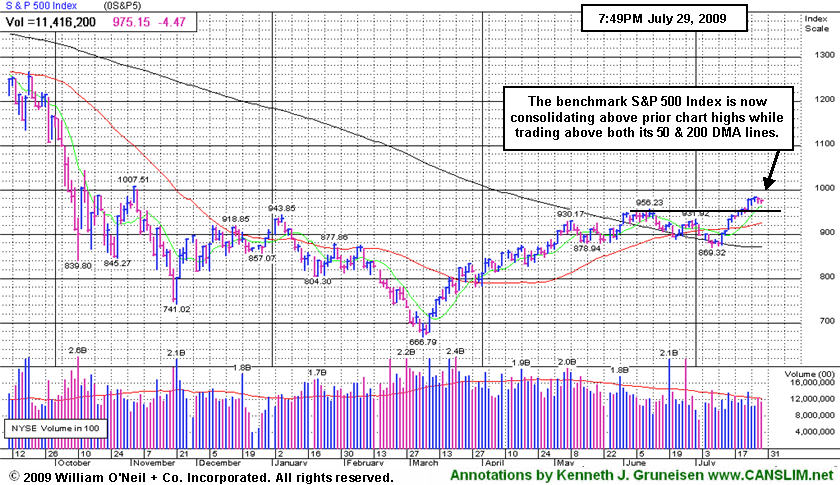
The major indices ended with slight losses across the board on Wednesday. The volume total on the NYSE was reported a bit higher than the prior session total while volume was lower on the Nasdaq exchange. Decliners outnumbered advancing issues on the NYSE and on the Nasdaq exchange by about a 3-to-2 ratio. There were 20 high-ranked companies from the CANSLIM.net Leaders List that made a new 52-week high and appeared on the CANSLIM.net BreakOuts Page, down from the 26 issues that appeared on the prior session. On both exchanges new 52-week highs outpaced new 52-week lows, while new lows remained in the single digits.
The Fed released its latest Beige Book which showed a moderated economic decline, leading pundits to suggest that the market is getting ahead of itself with its recovery hopes. Durable goods orders for June made their worst drop since January by falling -2.5%, which was worse than expected. However, orders less autos made a surprisingly strong increase of +1.1% which was better than expected and the first back-to-back increase since March and April of 2008. The US dollar reportedly made its best move in more than one month, gaining +0.9% against a basket of major foreign currencies, however that put pressure on commodity-linked areas.
Earnings news included better-than-expected results and an increased outlook from McKesson (MCK +8.93%) which helped the medical group, but that was largely offset by a disappointing report from WellPoint (WLP -5.70%). Meanwhile, ConocoPhillips (COP -3.53%) and Hess Corp (HES -3.45%) fell despite better-than-expected results from those energy-related firms.
PICTURED: The benchmark S&P 500 Index is now consolidating above prior 2009 chart highs while trading above both its 50-day and 200-day moving average lines.
|
 Kenneth J. Gruneisen started out as a licensed stockbroker in August 1987, a couple of months prior to the historic stock market crash that took the Dow Jones Industrial Average down -22.6% in a single day. He has published daily fact-based fundamental and technical analysis on high-ranked stocks online for two decades. Through FACTBASEDINVESTING.COM, Kenneth provides educational articles, news, market commentary, and other information regarding proven investment systems that work in good times and bad.
Comments contained in the body of this report are technical opinions only and are not necessarily those of Gruneisen Growth Corp. The material herein has been obtained from sources believed to be reliable and accurate, however, its accuracy and completeness cannot be guaranteed. Our firm, employees, and customers may effect transactions, including transactions contrary to any recommendation herein, or have positions in the securities mentioned herein or options with respect thereto. Any recommendation contained in this report may not be suitable for all investors and it is not to be deemed an offer or solicitation on our part with respect to the purchase or sale of any securities. |
|
 |
Commodity-Linked Groups Lead Mostly Broader Losses
Kenneth J. Gruneisen - Passed the CAN SLIM® Master's Exam
The Oil Services Index ($OSX -3.31%) and Integrated Oil Index ($XOI -2.03%) were among Wednesday's worst decliners as crude prices were adversely impacted by an unexpected inventory build and a stronger dollar. The greenback's weakness also pressured the Gold & Silver Index ($XAU -2.76%). The Internet Index ($IIX -1.17%) was the weakest of the tech sector indices as investors sold off Yahoo! (YHOO -12.08%) shares in frustration after it announced a 10-year deal to pair parts of its Internet search service with Microsoft (MSFT +1.41%). The Semiconductor Index ($SOX -0.86%) also slumped, while the Biotechnology Index ($BTK +0.53%) posted a small gain and the Networking Index ($NWX +0.07%) ended virtually flat. The Healthcare Index ($HMO -0.27%) and Retail Index ($RLX -0.12%) edged lower. Modest gains from the Bank Index ($BKX +0.39%) and Broker/Dealer Index ($XBD +0.70%) could not offset the market's broader losses.
Charts courtesy www.stockcharts.com
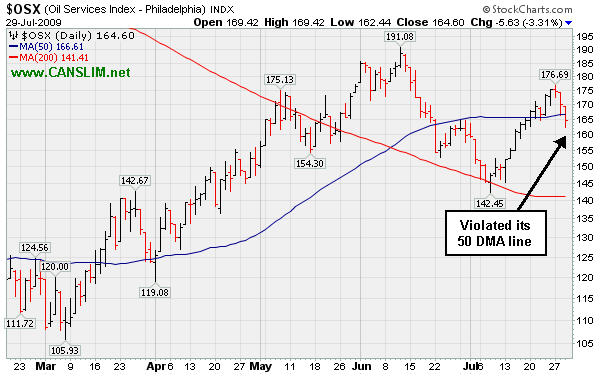
PICTURED: The Oil Services Index ($OSX -3.31%) violated its 50-day moving average (DMA) line on Wednesday as crude prices were adversely impacted by an unexpected inventory build and a stronger dollar.
| Oil Services |
$OSX |
164.60 |
-5.63 |
-3.31% |
+35.60% |
| Healthcare |
$HMO |
1,179.53 |
-3.20 |
-0.27% |
+22.84% |
| Integrated Oil |
$XOI |
942.86 |
-19.54 |
-2.03% |
-3.76% |
| Semiconductor |
$SOX |
300.65 |
-2.60 |
-0.86% |
+41.70% |
| Networking |
$NWX |
195.59 |
+0.13 |
+0.07% |
+35.93% |
| Internet |
$IIX |
200.95 |
-2.38 |
-1.17% |
+50.22% |
| Broker/Dealer |
$XBD |
106.27 |
+0.74 |
+0.70% |
+37.18% |
| Retail |
$RLX |
349.38 |
-0.42 |
-0.12% |
+25.11% |
| Gold & Silver |
$XAU |
138.97 |
-3.95 |
-2.76% |
+12.21% |
| Bank |
$BKX |
38.67 |
+0.15 |
+0.39% |
-12.75% |
| Biotech |
$BTK |
883.97 |
+4.67 |
+0.53% |
+36.59% |
|
|
|
 |
Software Firm Pegs New Highs With Big Gain on Triple Average Volume
Kenneth J. Gruneisen - Passed the CAN SLIM® Master's Exam
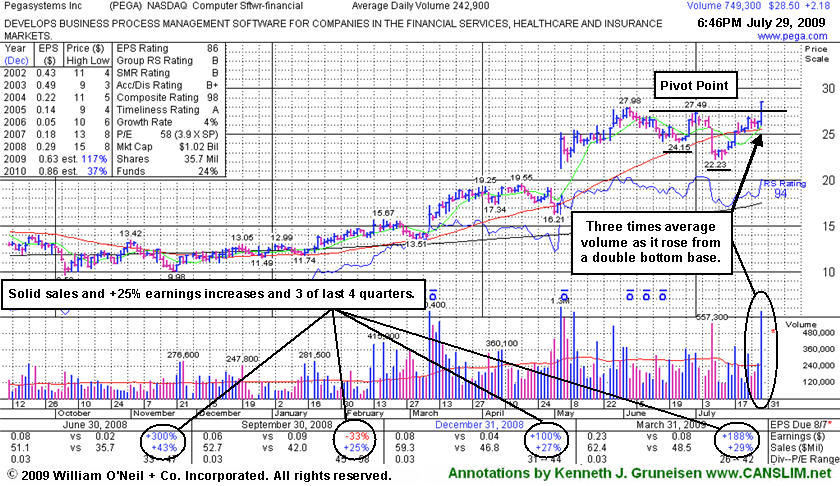
Pegasystems Inc (PEGA +$2.18 or +8.28% to $28.50) was featured in yellow in today's mid-day report (read here) during the course of its considerable gain on heavy volume 3 times its average for a new 52-week high. There were no news headlines to be found as this software firm triggered a technical buy signal by breaking out from a third stage, 8-week "double bottom" type base. The second low was a "lower low" which provided a necessary "shakeout" which is an important characteristic of a proper double bottom pattern. The heavy volume behind its breakout easily met the minimum +50% above average volume guideline of the investment system for a proper breakout. The high-ranked Computer Software - Financial firm has shown solid sales revenues increases and +25% earnings increases and 3 of last 4 quarterly comparisons versus the year ago period. The previously noted downturn in annual earnings (the A criteria) from 2003 to 2006 has been followed by a solid turn around and big earnings increases in '07 and '08, and Street expectations for '09 are calling for well above +25% growth. As always, disciplined investors avoid chasing stocks extended more than +5% above their pivot point, and once any new buys are made, those stocks are quickly sold if they fall more than -7% from the buy price. Being ultra-careful in regard to entries and exits provides no guarantee that investors will reap huge profits, however, undisciplined buying and selling decisions will obviously hurt your chances of great success.
|
|
|
Color Codes Explained :
Y - Better candidates highlighted by our
staff of experts.
G - Previously featured
in past reports as yellow but may no longer be buyable under the
guidelines.
***Last / Change / Volume quote data in this table corresponds with the timestamp on the note***
Symbol/Exchange
Company Name
Industry Group |
Last |
Chg. |
Vol
% DAV |
Date Featured |
Price Featured |
Latest Pivot Point
Featured |
Status |
| Latest Max Buy Price |
CPLA
- NASDAQ
Capella Education Co
DIVERSIFIED SERVICES - Education and Training Services
|
$62.59
|
+0.49
|
336,794
151% DAV
223,511
|
7/9/2009
(Date
Featured) |
$59.69
(Price
Featured) |
PP = $62.06 |
Y |
| MB = $65.16 |
Most Recent Note - 7/29/2009 6:35:44 PM
Y - Gain today with above average volume for a new high close. Gapped up on 7/28/09 after reporting solid results for the quarter ended June 30, 2009, with a +21% increase in sales revenues (accelerating) and +51% earnings per share. Technically, it traded more than the +50% above average volume guideline as it rose above its pivot point, triggering a buy signal, yet it closed in the middle of its intra-day trading range after encountering some profit-taking pressure. Featured in yellow in the 7/09/09 Mid-Day BreakOuts Report (read here). The group has shown some leadership, yet currently has a E and 9 for Relative Strength Rating/Ranks. CPLA is a high-ranked leader in the Commercial Services-Schools Group. Its small supply of only 13.9 million shares in the float could contribute to greater price volatility in the event of institutional accumulation or distribution. The number of top-rated funds owning an interest rose from 91 in Sept '08, to 135 as of March '09, which is reassuring with respect to the I criteria. It has a very good earnings history that satisfies the C & A criteria, while recent quarters showed steady sales revenues increases in the +17-18% range.
>>> The latest Featured Stock Update with an annotated graph appeared on 7/20/2009. click here.
|
|
C
A
S
I |
News |
Chart |
SEC
View all notes Alert
me of new notes
Company
Profile
|
GMCR
- NASDAQ
Green Mtn Coffee Roastrs
FOOD & BEVERAGE - Processed & Packaged Goods
|
$65.90
|
-1.60
|
2,120,323
160% DAV
1,322,090
|
7/17/2009
(Date
Featured) |
$60.15
(Price
Featured) |
PP = $63.79 |
G |
| MB = $66.98 |
Most Recent Note - 7/29/2009 6:37:13 PM
G - Consolidating in a tight range for the past week and a half, stubbornly hovering near all-time highs. Prior highs in the $62-63 area are initial chart support to watch above its 50 DMA line. Do not be confused by the 3:2 stock split effective 6/09/09. GMCR traded up more than +168% since appearing with an annotated graph under the headline "It May Soon Be Time To Go Green" when featured in the January 2009 CANSLIM.net News (read here).
>>> The latest Featured Stock Update with an annotated graph appeared on 7/16/2009. click here.
|
|
C
A
S
I |
News |
Chart |
SEC
View all notes Alert
me of new notes
Company
Profile
|
HMSY
- NASDAQ
H M S Holdings Corp
COMPUTER SOFTWARE & SERVICES - Healthcare Information Service
|
$40.66
|
-0.59
|
231,955
73% DAV
317,370
|
2/20/2009
(Date
Featured) |
$34.08
(Price
Featured) |
PP = $38.38 |
G |
| MB = $40.30 |
Most Recent Note - 7/29/2009 6:40:54 PM
G - Small loss today on light volume. Its positive reversal on 7/24/09 marked a brief pullback below its "max buy" level. This high-ranked Commercial Services - Healthcare firm's prior highs in the $38 area are an important support level also coinciding with its 50 DMA line. A gap up gain on 6/16/09 with heavy volume triggered a technical buy signal.
>>> The latest Featured Stock Update with an annotated graph appeared on 7/24/2009. click here.
|
|
C
A
S
I |
News |
Chart |
SEC
View all notes Alert
me of new notes
Company
Profile
|
NTES
- NASDAQ
Netease Inc Adr
INTERNET - Internet Information Providers
|
$41.84
|
+0.14
|
1,502,093
59% DAV
2,540,121
|
7/17/2009
(Date
Featured) |
$39.29
(Price
Featured) |
PP = $38.74 |
G |
| MB = $40.68 |
Most Recent Note - 7/29/2009 6:41:53 PM
G - Consolidating well above prior chart highs in the $38 area, an important support level to watch. A recent series of 10 consecutive gains was capped off with a considerable gain on 7/22/09 with very heavy volume that lifted it well above its max buy level. It got extended from its latest base. On 7/17/09 it broke out from a 5-week flat base with +44% above average volume behind its gain. First featured at $26.75 in the 3/31/09 CANSLIM.net Mid-Day Breakouts Report (read here). This high-ranked Chinese Internet - Content firm was also summarized in greater detail including an annotated graph in the April 2009 issue of CANSLIM.net News (read here).
>>> The latest Featured Stock Update with an annotated graph appeared on 7/23/2009. click here.
|
|
C
A
S
I |
News |
Chart |
SEC
View all notes Alert
me of new notes
Company
Profile
|
NVEC
- NASDAQ
N V E Corp
ELECTRONICS - Semiconductor - Specialized
|
$55.03
|
+0.98
|
74,062
79% DAV
94,056
|
3/13/2009
(Date
Featured) |
$33.85
(Price
Featured) |
PP = $49.60 |
G |
| MB = $52.08 |
Most Recent Note - 7/29/2009 6:44:10 PM
G - Gain today on lighter volume. Patience may allow for shares to be accumulated on pullbacks, and prior highs are now an important support level. Featured in the 7/23/09 Mid-Day BreakOuts Report (read here) after it gapped up for a considerable gain on heavy volume following news of stronger sales revenues (+41%) and solid earnings increases for the quarter ended June 30, 2009. The technical action was described as a "breakaway gap" from a valid ascending base. A prior breakout from what was also called an ascending base pattern failed as a wave of distribution smacked it down to support at its 50 DMA line. Quarterly sales revenues in the 6 million dollar range are still rather minuscule, leaving concerns.
>>> The latest Featured Stock Update with an annotated graph appeared on 7/17/2009. click here.
|
|
C
A
S
I |
News |
Chart |
SEC
View all notes Alert
me of new notes
Company
Profile
|
PEGA
- NASDAQ
Pegasystems Inc
COMPUTER SOFTWARE & SERVICES - Business Software & Services
|
$28.50
|
+2.18
|
752,604
295% DAV
254,797
|
7/29/2009
(Date
Featured) |
$27.53
(Price
Featured) |
PP = $27.49 |
Y |
| MB = $28.86 |
Most Recent Note - 7/29/2009 6:56:44 PM
Y - It was featured in yellow in today's mid-day report (read here) during the course of its considerable gain on heavy volume 3 times its average for a new 52-week high. There were no news headlines to be found as this software firm triggered a technical buy signal by breaking out from a third stage, 8-week "double bottom" type base. The previously noted downturn in annual earnings (the A criteria) from 2003 to 2006 has been followed by a solid turn around and big earnings increases in '07 and '08, and Street expectations for '09 are calling for well above +25% growth.
>>> The latest Featured Stock Update with an annotated graph appeared on 7/29/2009. click here.
|
|
C
A
S
I |
News |
Chart |
SEC
View all notes Alert
me of new notes
Company
Profile
|
SYNA
- NASDAQ
Synaptics Inc
COMPUTER SOFTWARE & SERVICES - Information Technology Service
|
$36.08
|
-0.16
|
1,361,994
87% DAV
1,568,234
|
5/18/2009
(Date
Featured) |
$32.58
(Price
Featured) |
PP = $34.52 |
G |
| MB = $36.25 |
Most Recent Note - 7/29/2009 7:05:03 PM
G - Hovering near its 50 DMA line, consolidating for the past 6 weeks from its 52-week high. First featured in yellow in the May 18, 2009 mid-day report (read here). The number of top-rated funds owning its shares rose from 123 in June '08 to 210 in June '09, which is good news concerning the I criteria. Its annual earnings (the A criteria) history showed a dowturn in 2006, leaving concerns, but it followed that up with strong growth the next 2 years. Its small supply of shares (the S criteria) outstanding could contribute to especially great volatility in the event of institutional accumulation or distribution.
>>> The latest Featured Stock Update with an annotated graph appeared on 7/22/2009. click here.
|
|
C
A
S
I |
News |
Chart |
SEC
View all notes Alert
me of new notes
Company
Profile
|
TNDM
- NASDAQ
Tandem Diabetes Care Inc
TELECOMMUNICATIONS - Wireless Communications
|
$29.44
|
-0.67
|
365,849
40% DAV
913,329
|
3/2/2009
(Date
Featured) |
$18.89
(Price
Featured) |
PP = $29.85 |
G |
| MB = $31.34 |
Most Recent Note - 7/29/2009 7:07:18 PM
G - Quietly consolidating above its 50 DMA line, less than -10% off its all-time high, building on a choppy base since its June 2nd high of $32.57 was reached. Subsequent deterioration below that short-term average and recent lows would raise concerns and trigger sell signals. It traded up as much as +72.42% since first featured at $18.89 in the 3/02/09 Mid-Day BreakOuts Report (read here).
>>> The latest Featured Stock Update with an annotated graph appeared on 7/21/2009. click here.
|
|
C
A
S
I |
News |
Chart |
SEC
View all notes Alert
me of new notes
Company
Profile
|
UTA
-
|
$13.42
|
-0.05
|
836,530
240% DAV
348,193
|
7/28/2009
(Date
Featured) |
$12.87
(Price
Featured) |
PP = $12.70 |
Y |
| MB = $13.34 |
Most Recent Note - 7/29/2009 7:09:17 PM
Y - Volume was more than 2 times average today with no further price progress. Strong action prompted it to be featured in yellow with pivot point and max buy levels noted in the 7/28/09 mid-day breakouts report (read here), with additional analysis included in the after market update (read here). This Chinese provider of airline tickets and travel related services gapped up on 7/28/09, rising from a choppy 6-week base with a considerable gain on very heavy volume.
>>> The latest Featured Stock Update with an annotated graph appeared on 7/28/2009. click here.
|
|
C
A
S
I |
News |
Chart |
SEC
View all notes Alert
me of new notes
Company
Profile
|
|
|
|
THESE ARE NOT BUY RECOMMENDATIONS!
Comments contained in the body of this report are technical
opinions only. The material herein has been obtained
from sources believed to be reliable and accurate, however,
its accuracy and completeness cannot be guaranteed.
This site is not an investment advisor, hence it does
not endorse or recommend any securities or other investments.
Any recommendation contained in this report may not
be suitable for all investors and it is not to be deemed
an offer or solicitation on our part with respect to
the purchase or sale of any securities. All trademarks,
service marks and trade names appearing in this report
are the property of their respective owners, and are
likewise used for identification purposes only.
This report is a service available
only to active Paid Premium Members.
You may opt-out of receiving report notifications
at any time. Questions or comments may be submitted
by writing to Premium Membership Services 665 S.E. 10 Street, Suite 201 Deerfield Beach, FL 33441-5634 or by calling 1-800-965-8307
or 954-785-1121.
|
|
|

