You are not logged in.
This means you
CAN ONLY VIEW reports that were published prior to Monday, April 14, 2025.
You
MUST UPGRADE YOUR MEMBERSHIP if you want to see any current reports.
AFTER MARKET UPDATE - WEDNESDAY, JULY 28TH, 2010
Previous After Market Report Next After Market Report >>>
|
|
|
|
DOW |
-39.81 |
10,497.88 |
-0.38% |
|
Volume |
1,005,649,090 |
-10% |
|
Volume |
1,819,925,830 |
-10% |
|
NASDAQ |
-23.69 |
2,264.56 |
-1.04% |
|
Advancers |
951 |
30% |
|
Advancers |
771 |
28% |
|
S&P 500 |
-7.72 |
1,106.12 |
-0.69% |
|
Decliners |
2,085 |
66% |
|
Decliners |
1,860 |
68% |
|
Russell 2000 |
-11.41 |
650.76 |
-1.72% |
|
52 Wk Highs |
98 |
|
|
52 Wk Highs |
32 |
|
|
S&P 600 |
-6.01 |
349.21 |
-1.69% |
|
52 Wk Lows |
10 |
|
|
52 Wk Lows |
32 |
|
|
 |
Leadership Wanes As Data Shows Economic Recovery Slowing
Adam Sarhan, Contributing Writer,
The major averages fell on Wednesday after durable goods fell and the Fed Beige Book showed the economic recovery has slowed. However, it was encouraging to see volume totals, an important indicator of institutional sponsorship, decline on the NYSE and the Nasdaq exchange compared to Tuesday's levels. Decliners led advancers by over a 2-to-1 ratio on the NYSE and on the Nasdaq exchange. New 52-week highs outnumbered new 52-week lows on the NYSE while on the Nasdaq exchange new highs were matched by new lows. There were only 14 high-ranked companies from the CANSLIM.net Leaders List that made a new 52-week high and appeared on the CANSLIM.net BreakOuts Page. That marked a considerable contraction from the 59 issues that appeared on the prior session and the higher new highs totals that were a recent signs of expanding leadership.
The major averages ended lower after the Commerce Department said durable goods unexpectedly fell last month. Goods that are built to last at least three years fell -1% compared to the Street's estimate of a +1% increase. At 2:00PM EST, the Fed published its Beige Book which summarizes economic conditions at 12 districts around the country. The report showed that the economic recovery slowed in some districts while other districts held steady. Growth held steady in Cleveland and Kansas City, but slowed in Chicago and Atlanta. Other areas showed modest economic conditions. The primary culprit for the lackluster reading was high unemployment which adversely affects consumer spending, a primary driver of the US economy.
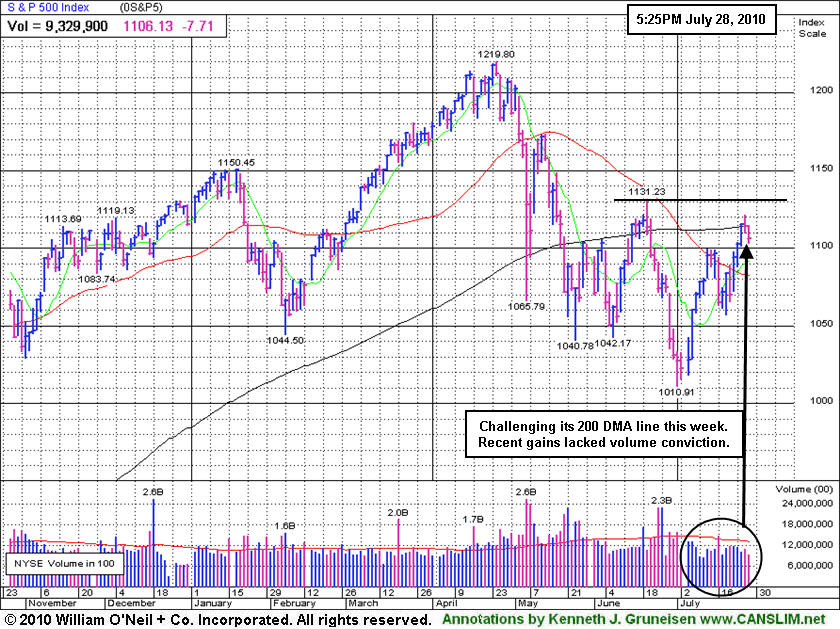
It is encouraging to see the major averages hold on to their gains after breaking above their respective 2-month downward trendlines and rising above their respective 50-day and 200-day moving average (DMA) lines in recent sessions. It is also healthy to see a new batch of high-ranked stocks breakout of fresh bases as the present rally gets stronger. The window remains open for for high-ranked stocks to be accumulated when they trigger fresh technical buy signals. Trade accordingly.
PICTURED: The benchmark S&P 500 Index is challenging its 200 DMA line and finding some resistance there after recent gains that have lacked volume conviction. It would be most encouraging to see volume increase to above average totals with subsequent gains above the long-term average and its June high. An expansion in leadership (new highs) would also be a reassuring sign that the rally is strong and sustainable.
|
|
|
 |
Healthcare Group Remains Weak
Kenneth J. Gruneisen - Passed the CAN SLIM® Master's Exam
The tech sector had a negative bias on Wednesday as the Semiconductor Index ($SOX -1.81%), Biotechnology Index ($BTK -1.65%), Networking Index ($NWX -1.47%), and Internet Index ($IIX -0.82%) ended unanimously lower. Weakness in the Broker/Dealer Index ($XBD -0.34%), Bank Index ($BKX -1.32%), and the Retail Index ($RLX -1.00%) also had a negative influence on the major averages. Energy-related shares fell as the Integrated Oil Index ($XOI -0.85%) and Oil Services Index ($OSX -0.64%) suffered small losses, meanwhile the Gold & Silver Index ($XAU +0.32%) edged higher.
Charts courtesy www.stockcharts.com
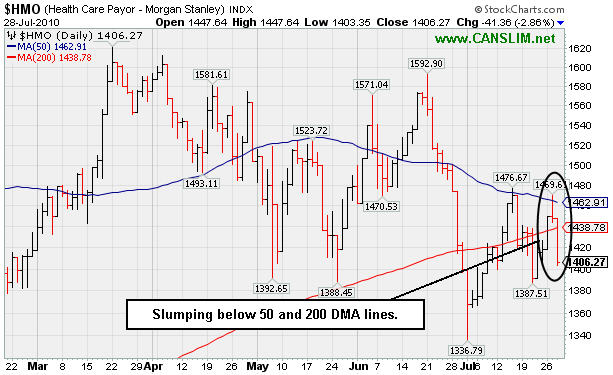
PICTURED: The Healthcare Index ($HMO -2.86%) is slumping back below its 50 and 200 DMA lines.
| Oil Services |
$OSX |
179.70 |
-1.16 |
-0.64% |
-7.81% |
| Healthcare |
$HMO |
1,406.27 |
-41.36 |
-2.86% |
-4.53% |
| Integrated Oil |
$XOI |
972.75 |
-8.32 |
-0.85% |
-8.94% |
| Semiconductor |
$SOX |
359.47 |
-6.61 |
-1.81% |
-0.12% |
| Networking |
$NWX |
244.40 |
-3.64 |
-1.47% |
+5.78% |
| Internet |
$IIX |
244.29 |
-2.02 |
-0.82% |
+4.46% |
| Broker/Dealer |
$XBD |
105.54 |
-0.36 |
-0.34% |
-8.27% |
| Retail |
$RLX |
403.65 |
-4.07 |
-1.00% |
-1.82% |
| Gold & Silver |
$XAU |
166.78 |
+0.53 |
+0.32% |
-0.87% |
| Bank |
$BKX |
48.74 |
-0.65 |
-1.32% |
+14.12% |
| Biotech |
$BTK |
1,058.53 |
-17.72 |
-1.65% |
+12.35% |
|
|
|
 |
Latest Comparison Marks 3rd Consecutive Quarter of Big Sales Revenues and Earnings Growth
Kenneth J. Gruneisen - Passed the CAN SLIM® Master's Exam
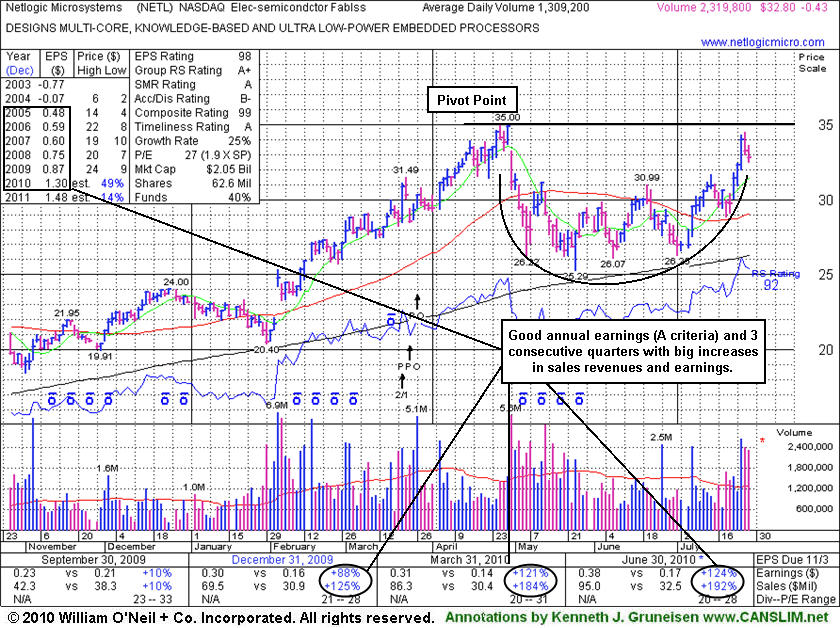
Netlogic MicroSystems Inc. (NETL -$0.43 or -1.29% to $32.80) was featured in yellow in today's mid-day report (read here) while trading within close striking distance of less than -5% from its 52 week high, working on the right side of a 12-week cup shaped pattern without yet forming a proper handle. It faces no remaining resistance due to overhead supply. Volume and volatility often increase near earnings news and it was noted in recent mid-day reports - "Earnings news is expected on Wednesday."
Following the close today it reported very strong results for the quarter ended June 30, 2010, marking its 3rd consecutive quarter of sales and earnings increases solidly above the +25% minimum guideline. It has also maintained a good annual earnings growth history, so today the C and A criteria are both solidly satisfied, despite its negative comparisons in the Dec '08, and Mar, Jun '09 quarters versus the year ago periods. The number of top-rated funds owning its shares increased from 115 in Sept '09 to 142 in Jun '10, which is a very reassuring sign concerning the I criteria.
The stock is acting healthy and should remain on an active watch list until the stock triggers a fresh technical buy signal which requires gains above its pivot point backed by at least +50% above average volume. Remember to always limit losses per the 7-8% sell rule, and never hold a stock if it falls more than that from your purchase price. Based on weak technical action NETL was dropped from the Featured Stocks list on 7/11/08, and it subsequently fell from $31.73 to as low as $7.21 before rebounding impressively.
|
|
|
Color Codes Explained :
Y - Better candidates highlighted by our
staff of experts.
G - Previously featured
in past reports as yellow but may no longer be buyable under the
guidelines.
***Last / Change / Volume data in this table is the closing quote data***
Symbol/Exchange
Company Name
Industry Group |
PRICE |
CHANGE
(%Change) |
Day High |
Volume
(% DAV)
(% 50 day avg vol) |
52 Wk Hi
% From Hi |
Featured
Date |
Price
Featured |
Pivot Featured |
|
Max Buy |
AAPL
-
NASDAQ
Apple Inc
COMPUTER HARDWARE - Personal Computers
|
$260.96
|
-3.12
-1.18% |
$265.97
|
18,526,339
64.96% of 50 DAV
50 DAV is 28,518,000
|
$279.01
-6.47%
|
6/17/2010
|
$270.95
|
PP = $272.56
|
|
MB = $286.19
|
Most Recent Note - 7/27/2010 4:07:04 PM
Y - Gain today with light volume continues its recent rebound above its 50 DMA line. Consolidating for the 6th week since its negative reversal on 6/21/10 at its all-time high, its color code is changed to yellow with new pivot point cited.
>>> The latest Featured Stock Update with an annotated graph appeared on 7/12/2010. Click here.
View all notes |
Alert me of new notes |
CANSLIM.net Company Profile |
SEC |
Zacks Reports |
StockTalk |
News |
Chart |
Request a new note
C
A N
S L
I M


|
ABV
-
NYSE
Comp De Bebidas Adr
FOOD and BEVERAGE - Beverages - Brewers
|
$108.82
|
+0.97
0.90% |
$109.37
|
389,813
53.36% of 50 DAV
50 DAV is 730,600
|
$109.78
-0.87%
|
6/29/2010
|
$104.74
|
PP = $109.33
|
|
MB = $114.80
|
Most Recent Note - 7/27/2010 4:10:30 PM
Y - This Brazil-based beverage firm is quietly holding its ground after reaching a new 52-week high, but it has not triggered a recent technical buy signal. It found support near its 50 DMA line since featured in the 6/29/10 mid-day report.
>>> The latest Featured Stock Update with an annotated graph appeared on 7/20/2010. Click here.
View all notes |
Alert me of new notes |
CANSLIM.net Company Profile |
SEC |
Zacks Reports |
StockTalk |
News |
Chart |
Request a new note
C
A N
S L
I M
|
BIDU
-
NASDAQ
Baidu Inc Ads
INTERNET - Internet Information Providers
|
$79.40
|
-1.67
-2.06% |
$81.15
|
7,744,818
62.10% of 50 DAV
50 DAV is 12,471,400
|
$82.29
-3.51%
|
7/14/2010
|
$75.03
|
PP = $78.59
|
|
MB = $82.52
|
 Most Recent Note - 7/28/2010 4:34:37 PM
Y - Pulled back on lighter volume today after 4consecutive gains helped it rise to within 30 cents of its all-time high. Latest quarter ended June 30, 2010 showed sales revenues growth still accelerating and earnings increasing by triple digit percentages for the 2nd consecutive comparison.
>>> The latest Featured Stock Update with an annotated graph appeared on 7/14/2010. Click here.
View all notes |
Alert me of new notes |
CANSLIM.net Company Profile |
SEC |
Zacks Reports |
StockTalk |
News |
Chart |
Request a new note
C
A N
S L
I M
|
CRM
-
NYSE
Salesforce.Com Inc
INTERNET - Internet Software and Services
|
$98.11
|
-0.69
-0.70% |
$99.71
|
1,164,688
41.04% of 50 DAV
50 DAV is 2,838,100
|
$101.49
-3.33%
|
6/2/2010
|
$88.44
|
PP = $89.60
|
|
MB = $94.08
|
Most Recent Note - 7/27/2010 4:17:44 PM
G - Pulled back on lighter volume today after rising to a new 52-week highs on the 2 prior sessions with higher volume near average. On 7/23/10 it rose from a choppy 7-week base.
>>> The latest Featured Stock Update with an annotated graph appeared on 7/15/2010. Click here.
View all notes |
Alert me of new notes |
CANSLIM.net Company Profile |
SEC |
Zacks Reports |
StockTalk |
News |
Chart |
Request a new note
C
A N
S L
I M
|
DTSI
-
NASDAQ
D T S Inc
CONSUMER DURABLES - Electronic Equipment
|
$36.60
|
-0.34
-0.92% |
$36.90
|
58,382
55.71% of 50 DAV
50 DAV is 104,800
|
$37.50
-2.40%
|
7/27/2010
|
$37.00
|
PP = $36.28
|
|
MB = $38.09
|
Most Recent Note - 7/27/2010 4:20:02 PM
Y - Holding its ground above prior multi-year highs in the $35-36 area after its 7/23/10 gain with above average volume triggered a technical buy signal. It was featured in yellow in the 7/27/10 mid-day report (read here). Due to report earnings after the close on Monday, August 9th. Street estimates that are calling for lower FY '10 earnings are of some concern.
>>> The latest Featured Stock Update with an annotated graph appeared on 7/27/2010. Click here.
View all notes |
Alert me of new notes |
CANSLIM.net Company Profile |
SEC |
Zacks Reports |
StockTalk |
News |
Chart |
Request a new note
C
A N
S L
I M
|
Symbol/Exchange
Company Name
Industry Group |
PRICE |
CHANGE
(%Change) |
Day High |
Volume
(% DAV)
(% 50 day avg vol) |
52 Wk Hi
% From Hi |
Featured
Date |
Price
Featured |
Pivot Featured |
|
Max Buy |
FFIV
-
NASDAQ
F 5 Networks Inc
INTERNET - Internet Software and Services
|
$85.78
|
-0.31
-0.36% |
$87.21
|
978,323
54.33% of 50 DAV
50 DAV is 1,800,700
|
$87.97
-2.49%
|
6/16/2010
|
$74.50
|
PP = $74.10
|
|
MB = $77.81
|
Most Recent Note - 7/27/2010 4:27:57 PM
G - Reversed into the red and closed with a small loss on lighter volume today after touching another new 52-week high. It is extended from a sound base, yet could go on to produce more climactic gains
>>> The latest Featured Stock Update with an annotated graph appeared on 7/7/2010. Click here.
View all notes |
Alert me of new notes |
CANSLIM.net Company Profile |
SEC |
Zacks Reports |
StockTalk |
News |
Chart |
Request a new note
C
A N
S L
I M
|
MELI
-
NASDAQ
Mercadolibre Inc
INTERNET - Internet Software and; Services
|
$62.41
|
-1.59
-2.48% |
$63.94
|
508,090
53.19% of 50 DAV
50 DAV is 955,300
|
$65.99
-5.43%
|
5/13/2010
|
$54.21
|
PP = $55.85
|
|
MB = $58.64
|
Most Recent Note - 7/28/2010 4:13:40 PM
G - Loss today with lighter volume, sinking back near prior chart highs in the $62 area after clearing a choppy 6-week consolidation with a gap up gain on 7/26/10.
>>> The latest Featured Stock Update with an annotated graph appeared on 7/23/2010. Click here.
View all notes |
Alert me of new notes |
CANSLIM.net Company Profile |
SEC |
Zacks Reports |
StockTalk |
News |
Chart |
Request a new note
C
A N
S L
I M
|
NEM
-
NYSE
Newmont Mining Corp
METALS and MINING - Gold
|
$55.40
|
-0.38
-0.68% |
$55.79
|
10,923,973
119.75% of 50 DAV
50 DAV is 9,122,400
|
$63.38
-12.59%
|
6/22/2010
|
$59.60
|
PP = $59.67
|
|
MB = $62.65
|
Most Recent Note - 7/28/2010 4:18:14 PM
G - Ended lower today after its latest strong earnings news. It faces some near-term resistance due to overhead supply after trading higher in the past month or more. A prompt rebound back above its 50 DMA would be an encouraging sign, but after its damaging gap down on 7/27/10, the recent action looks distributional.
>>> The latest Featured Stock Update with an annotated graph appeared on 7/9/2010. Click here.
View all notes |
Alert me of new notes |
CANSLIM.net Company Profile |
SEC |
Zacks Reports |
StockTalk |
News |
Chart |
Request a new note
C
A N
S L
I M
|
NEOG
-
NASDAQ
Neogen Corp
DRUGS - Diagnostic Substances
|
$29.22
|
-0.08
-0.27% |
$29.41
|
83,179
89.92% of 50 DAV
50 DAV is 92,500
|
$29.91
-2.29%
|
7/22/2010
|
$27.19
|
PP = $27.87
|
|
MB = $29.26
|
Most Recent Note - 7/27/2010 4:39:25 PM
G - Closed in the lower third of its intra-day trading range near its "max buy" level after early gains today near the $30 level. Color code is changed to green. Recent action has been bullish, as indicated by its current Up/Down Volume Ratio of 1.5, which is an unbiased indication of recent accumulation. Technically, the actual gains that lifted it above the pivot point cited lacked the volume conviction required after it was featured in the 7/22/10 mid-day report (read here).
>>> The latest Featured Stock Update with an annotated graph appeared on 7/22/2010. Click here.
View all notes |
Alert me of new notes |
CANSLIM.net Company Profile |
SEC |
Zacks Reports |
StockTalk |
News |
Chart |
Request a new note
C
A N
S L
I M
|
NETL
-
NASDAQ
Netlogic Microsystems
ELECTRONICS - Semiconductor - Memory Chips
|
$32.80
|
-0.43
-1.29% |
$33.62
|
2,347,176
179.28% of 50 DAV
50 DAV is 1,309,200
|
$35.00
-6.29%
|
7/28/2010
|
$33.44
|
PP = $35.10
|
|
MB = $36.86
|
Most Recent Note - 7/28/2010 12:54:55 PM
Y - Within close striking distance of less than -5% from its 52 week high, working on the right side of a 12-week cup shaped pattern without yet forming a proper handle. It faces no remaining resistance due to overhead supply. Volume and volatility often increase near earnings news. Noted in recent mid-day reports - "Earnings news is expected on Wednesday. The 2 latest quarterly comparisons showed much better sales and earnings increases, but prior quarterly comparisons were negative and below the guidelines of the investment system. Based on weak technical action it was dropped from the Featured Stocks list on 7/11/08, and it subsequently fell from $31.73 to as low as $7.21 before rebounding impressively."
>>> The latest Featured Stock Update with an annotated graph appeared on 6/2/2008. Click here.
View all notes |
Alert me of new notes |
CANSLIM.net Company Profile |
SEC |
Zacks Reports |
StockTalk |
News |
Chart |
Request a new note
C
A N
S L
I M
|
Symbol/Exchange
Company Name
Industry Group |
PRICE |
CHANGE
(%Change) |
Day High |
Volume
(% DAV)
(% 50 day avg vol) |
52 Wk Hi
% From Hi |
Featured
Date |
Price
Featured |
Pivot Featured |
|
Max Buy |
ROVI
-
NASDAQ
Rovi Corp
COMPUTER SOFTWARE andamp; SERVICES - Security Software andamp; Services
|
$42.25
|
-1.35
-3.10% |
$43.58
|
1,054,959
83.09% of 50 DAV
50 DAV is 1,269,600
|
$44.85
-5.80%
|
6/3/2010
|
$38.70
|
PP = $40.16
|
|
MB = $42.17
|
Most Recent Note - 7/28/2010 4:24:35 PM
G - Loss today on slightly higher but still "below average" volume while slumping near its "max buy" level. Earnings news is due Thursday 7/29/10 after the close. Support is defined by prior resistance in the $40 area and its 50 DMA line.
>>> The latest Featured Stock Update with an annotated graph appeared on 7/21/2010. Click here.
View all notes |
Alert me of new notes |
CANSLIM.net Company Profile |
SEC |
Zacks Reports |
StockTalk |
News |
Chart |
Request a new note
C
A N
S L
I M
|
THOR
-
NASDAQ
Thoratec Corp
HEALTH SERVICES - Medical Instruments and Supplies
|
$42.84
|
-0.78
-1.79% |
$43.90
|
789,507
80.76% of 50 DAV
50 DAV is 977,600
|
$47.93
-10.62%
|
6/3/2010
|
$44.38
|
PP = $45.35
|
|
MB = $47.62
|
Most Recent Note - 7/28/2010 4:30:23 PM
G - This high-ranked Medical Products has slumped under its 50 DMA line, and its color code is changed to green again. It has not produced a constructive gain with above average volume since peaking on 6/16/10. Earnings news is due after the close on Thursday 7/29/10.
>>> The latest Featured Stock Update with an annotated graph appeared on 7/16/2010. Click here.
View all notes |
Alert me of new notes |
CANSLIM.net Company Profile |
SEC |
Zacks Reports |
StockTalk |
News |
Chart |
Request a new note
C
A N
S L
I M
|
ULTA
-
NASDAQ
Ulta Salon Cosm & Frag
SPECIALTY RETAIL - Specialty Retail, Other
|
$24.61
|
-0.06
-0.24% |
$24.82
|
296,702
41.65% of 50 DAV
50 DAV is 712,300
|
$26.75
-8.00%
|
5/28/2010
|
$25.58
|
PP = $25.86
|
|
MB = $27.15
|
Most Recent Note - 7/27/2010 4:49:19 PM
G - Closed near the session low today, negatively reversing for a loss on light volume after a small gap up. It has not formed a sound new base since its June breakout attempt failed. Prior lows in the $22 area define the next support level just above its 200 DMA line.
>>> The latest Featured Stock Update with an annotated graph appeared on 7/19/2010. Click here.
View all notes |
Alert me of new notes |
CANSLIM.net Company Profile |
SEC |
Zacks Reports |
StockTalk |
News |
Chart |
Request a new note
C
A N
S L
I M
|
VIT
-
NYSE
Vanceinfo Tech Inc Ads
COMPUTER SOFTWARE and SERVICES - Business Software and Services
|
$25.03
|
-0.95
-3.66% |
$26.17
|
452,361
77.02% of 50 DAV
50 DAV is 587,300
|
$27.59
-9.28%
|
7/8/2010
|
$25.20
|
PP = $26.58
|
|
MB = $27.91
|
Most Recent Note - 7/28/2010 4:48:04 PM
Y - Today's 3rd consecutive loss has it pulling back to test support near its June high and an upward trendline, but slumping further below the pivot point cited in prior reports. It briefly matched its all-time high when it was featured in the 7/08/10 mid-day report (read here).
>>> The latest Featured Stock Update with an annotated graph appeared on 7/26/2010. Click here.
View all notes |
Alert me of new notes |
CANSLIM.net Company Profile |
SEC |
Zacks Reports |
StockTalk |
News |
Chart |
Request a new note
C
A N
S L
I M
|
|
|
|
THESE ARE NOT BUY RECOMMENDATIONS!
Comments contained in the body of this report are technical
opinions only. The material herein has been obtained
from sources believed to be reliable and accurate, however,
its accuracy and completeness cannot be guaranteed.
This site is not an investment advisor, hence it does
not endorse or recommend any securities or other investments.
Any recommendation contained in this report may not
be suitable for all investors and it is not to be deemed
an offer or solicitation on our part with respect to
the purchase or sale of any securities. All trademarks,
service marks and trade names appearing in this report
are the property of their respective owners, and are
likewise used for identification purposes only.
This report is a service available
only to active Paid Premium Members.
You may opt-out of receiving report notifications
at any time. Questions or comments may be submitted
by writing to Premium Membership Services 665 S.E. 10 Street, Suite 201 Deerfield Beach, FL 33441-5634 or by calling 1-800-965-8307
or 954-785-1121.
|
|
|


