You are not logged in.
This means you
CAN ONLY VIEW reports that were published prior to Monday, April 14, 2025.
You
MUST UPGRADE YOUR MEMBERSHIP if you want to see any current reports.
AFTER MARKET UPDATE - TUESDAY, JULY 28TH, 2009
Previous After Market Report Next After Market Report >>>
|
|
|
|
DOW |
-11.79 |
9,096.72 |
-0.13% |
|
Volume |
1,242,364,520 |
+19% |
|
Volume |
2,239,632,490 |
+2% |
|
NASDAQ |
+7.62 |
1,975.51 |
+0.39% |
|
Advancers |
1,443 |
46% |
|
Advancers |
1,476 |
52% |
|
S&P 500 |
-2.56 |
979.62 |
-0.26% |
|
Decliners |
1,553 |
50% |
|
Decliners |
1,217 |
43% |
|
Russell 2000 |
+1.07 |
551.95 |
+0.19% |
|
52 Wk Highs |
82 |
|
|
52 Wk Highs |
65 |
|
|
S&P 600 |
+0.54 |
292.34 |
+0.19% |
|
52 Wk Lows |
2 |
|
|
52 Wk Lows |
4 |
|
|
 |
High-Ranked Stock Index Stalled Under Prior Chart Highs
Kenneth J. Gruneisen - Passed the CAN SLIM® Master's Exam
The Nasdaq Composite Index posted its 14th gain in 15 sessions, meanwhile the other major indices ended with slight losses on Tuesday. The volume totals on the NYSE and on the Nasdaq exchange were reported higher than the prior session totals. Advancers were slightly outnumbered by decliners on the NYSE, yet advancers led by a narrow 7-to-6 ratio on the Nasdaq exchange. There were 26 high-ranked companies from the CANSLIM.net Leaders List that made a new 52-week high and appeared on the CANSLIM.net BreakOuts Page, down from the 37 issues that appeared on the prior session. However, on both exchanges new 52-week highs substantially outpaced new 52-week lows, while new lows remained in the single digits.
In the early going, worse-than-expected July consumer confidence data prompted selling pressure. The Consumer Confidence Index, reported at 46.6, made its second straight decline. That news seemed to outweigh the S&P/Case-Shiller Composite Index data indicating that the pace of falling home prices moderated in May for the first time since 2006. Better-than-expected earnings inspired leadership from the healthcare group after an upside forecast from Amgen (AMGN +2.72%), and upbeat earnings from Teva Pharmaceutical (TEVA +4.21%).
Fresh economic data the market could very likely react to on Wednesday's session includes durable goods orders data for June which is due before the opening bell, then weekly oil inventory data at 10:30 AM. The Fed also is set to release its latest Beige Book.
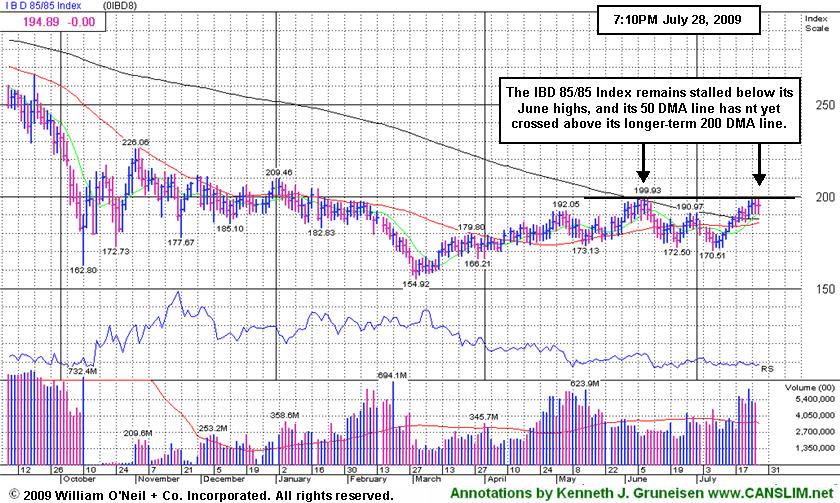
PICTURED: The IBD 85/85 Index is a great proxy for how high-ranked companies are performing overall. This index is currently stalled below its June highs, and its 50-day moving average (DMA) line has not yet crossed above its longer-term 200 DMA line.
|
 Kenneth J. Gruneisen started out as a licensed stockbroker in August 1987, a couple of months prior to the historic stock market crash that took the Dow Jones Industrial Average down -22.6% in a single day. He has published daily fact-based fundamental and technical analysis on high-ranked stocks online for two decades. Through FACTBASEDINVESTING.COM, Kenneth provides educational articles, news, market commentary, and other information regarding proven investment systems that work in good times and bad.
Comments contained in the body of this report are technical opinions only and are not necessarily those of Gruneisen Growth Corp. The material herein has been obtained from sources believed to be reliable and accurate, however, its accuracy and completeness cannot be guaranteed. Our firm, employees, and customers may effect transactions, including transactions contrary to any recommendation herein, or have positions in the securities mentioned herein or options with respect thereto. Any recommendation contained in this report may not be suitable for all investors and it is not to be deemed an offer or solicitation on our part with respect to the purchase or sale of any securities. |
|
 |
Healthcare Group Posts Standout Gains and Hits 2009 High
Kenneth J. Gruneisen - Passed the CAN SLIM® Master's Exam
The Healthcare Index ($HMO +6.51%) was a standout gainer and the Biotechnology Index ($BTK +1.30%) also rose. Modest gains from the Retail Index ($RLX +0.62%) and Semiconductor Index ($SOX +0.20%) helped offset weaker action elsewhere. Commodity-linked areas were some of Tuesday's worst laggard groups as the Gold & Silver Index ($XAU -4.02%) outpaced the Oil Services Index ($OSX -2.59%) and Integrated Oil Index ($XOI -1.36%) to the downside. Losses for the Broker/Dealer Index ($XBD -1.43%) and Networking Index ($NWX -1.35%) also weighed negatively on the major averages while the Internet Index ($IIX +0.06%) and Bank Index ($BKX +0.10%) eked out minimal gains on the session.
Charts courtesy www.stockcharts.com
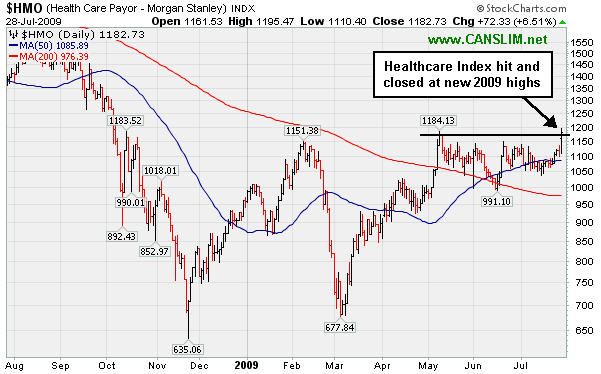
PICTURED: The Healthcare Index ($HMO +6.51%) was a standout gainer after encouraging news and guidance from a few high-profile firms in the medical industries.
| Oil Services |
$OSX |
170.23 |
-4.53 |
-2.59% |
+40.23% |
| Healthcare |
$HMO |
1,182.73 |
+72.33 |
+6.51% |
+23.18% |
| Integrated Oil |
$XOI |
962.40 |
-13.26 |
-1.36% |
-1.76% |
| Semiconductor |
$SOX |
303.25 |
+0.61 |
+0.20% |
+42.93% |
| Networking |
$NWX |
195.46 |
-2.67 |
-1.35% |
+35.84% |
| Internet |
$IIX |
203.33 |
+0.13 |
+0.06% |
+52.00% |
| Broker/Dealer |
$XBD |
105.53 |
-1.53 |
-1.43% |
+36.22% |
| Retail |
$RLX |
349.80 |
+2.16 |
+0.62% |
+25.26% |
| Gold & Silver |
$XAU |
142.92 |
-5.98 |
-4.02% |
+15.40% |
| Bank |
$BKX |
38.52 |
+0.04 |
+0.10% |
-13.09% |
| Biotech |
$BTK |
879.30 |
+11.29 |
+1.30% |
+35.87% |
|
|
|
 |
Caution and Discipline Suggested After Extensive Gains
Kenneth J. Gruneisen - Passed the CAN SLIM® Master's Exam
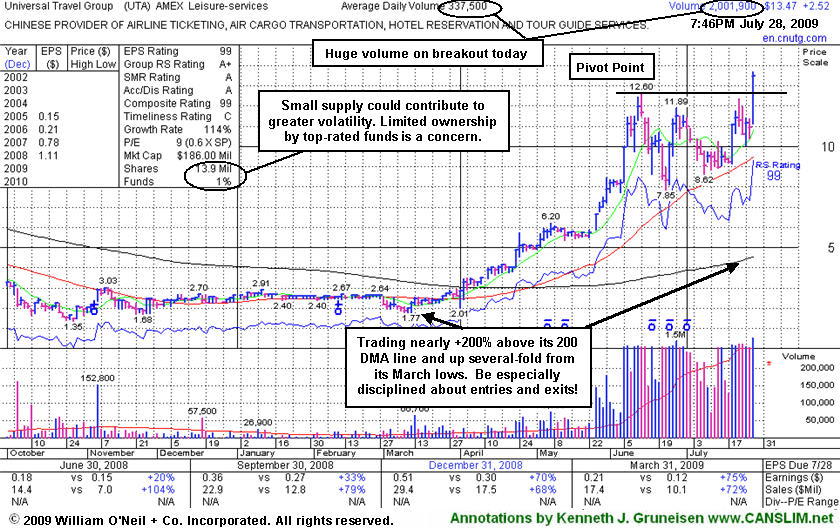
Universal Travel Group (UTA +23.01%), a Chinese provider of airline tickets and travel related services gapped up today, rising from a choppy 6-week base above its 50-day moving average line with a considerable gain on very heavy volume nearly 6 times its average daily trading total. The strong action prompted it to be featured in yellow with pivot point and max buy levels noted in the 7/28/09 mid-day breakouts report (read here). Keep in mind the considerable many-fold run it has already had from its March lows, and the fact that it is trading almost +200% above its 200-day moving average line. Those are very good reasons for investors to be especially disciplined about making proper entries and exits, so members should avoid chasing it more than +5% above its pivot point, and as always, strictly limit losses if any stock falls more than -7% from your buy point. After such a big one-day gain it could very easily consolidate in the near term. Subsequent deterioration leading to any closes back under its prior high closes would raise concerns by negating its latest bullish breakout.
|
|
|
Color Codes Explained :
Y - Better candidates highlighted by our
staff of experts.
G - Previously featured
in past reports as yellow but may no longer be buyable under the
guidelines.
***Last / Change / Volume quote data in this table corresponds with the timestamp on the note***
Symbol/Exchange
Company Name
Industry Group |
Last |
Chg. |
Vol
% DAV |
Date Featured |
Price Featured |
Latest Pivot Point
Featured |
Status |
| Latest Max Buy Price |
CPLA
- NASDAQ
Capella Education Co
DIVERSIFIED SERVICES - Education and Training Services
|
$62.10
|
+2.32
|
742,063
353% DAV
210,090
|
7/9/2009
(Date
Featured) |
$59.69
(Price
Featured) |
PP = $62.06 |
Y |
| MB = $65.16 |
Most Recent Note - 7/28/2009 4:21:04 PM
Y - Gapped up today after reporting solid results for the quarter ended June 30, 2009, with a +21% increase in sales revenues (accelerating) and +51% earnings per share. Technically, it traded more than the +50% above average volume guideline as it rose above its pivot point, triggering a buy signal, yet it closed in the middle of its intra-day trading range after encountering some profit-taking pressure. Featured in yellow in the 7/09/09 Mid-Day BreakOuts Report (read here). The group has shown some leadership, yet currently has a D- and 13 for Relative Strength Rating/Ranks. CPLA is a high-ranked leader in the Commercial Services-Schools Group. Its small supply of only 13.9 million shares in the float could contribute to greater price volatility in the event of institutional accumulation or distribution. The number of top-rated funds owning an interest rose from 91 in Sept '08, to 135 as of March '09, which is reassuring with respect to the I criteria. It has a very good earnings history that satisfies the C & A criteria, while recent quarters showed steady sales revenues increases in the +17-18% range.
>>> The latest Featured Stock Update with an annotated graph appeared on 7/20/2009. click here.
|
|
C
A
S
I |
News |
Chart |
SEC
View all notes Alert
me of new notes
Company
Profile
|
GMCR
- NASDAQ
Green Mtn Coffee Roastrs
FOOD & BEVERAGE - Processed & Packaged Goods
|
$67.74
|
-0.01
|
823,366
N/A
|
7/17/2009
(Date
Featured) |
$60.15
(Price
Featured) |
PP = $63.79 |
G |
| MB = $66.98 |
Most Recent Note - 7/28/2009 12:51:45 PM
G - Quietly consolidating in a tight range the past few sessions, stubbornly hovering near all-time highs. Prior highs in the $62-63 area are initial chart support to watch above its 50 DMA line. Do not be confused by the 3:2 stock split effective 6/09/09. GMCR traded up more than +168% since appearing with an annotated graph under the headline "It May Soon Be Time To Go Green" when featured in the January 2009 CANSLIM.net News (read here).
>>> The latest Featured Stock Update with an annotated graph appeared on 7/16/2009. click here.
|
|
C
A
S
I |
News |
Chart |
SEC
View all notes Alert
me of new notes
Company
Profile
|
HMSY
- NASDAQ
H M S Holdings Corp
COMPUTER SOFTWARE & SERVICES - Healthcare Information Service
|
$41.25
|
+0.62
|
283,965
89% DAV
317,370
|
2/20/2009
(Date
Featured) |
$34.08
(Price
Featured) |
PP = $38.38 |
G |
| MB = $40.30 |
Most Recent Note - 7/28/2009 4:22:56 PM
G - Quietly rising since its positive reversal on 7/24/09 after a brief pullback below its "max buy" level. This high-ranked Commercial Services - Healthcare firm previously tested prior highs in the $38 area -a very important initial support level that also coincides with its 50 DMA line. A gap up gain on 6/16/09 with heavy volume triggered a technical buy signal.
>>> The latest Featured Stock Update with an annotated graph appeared on 7/24/2009. click here.
|
|
C
A
S
I |
News |
Chart |
SEC
View all notes Alert
me of new notes
Company
Profile
|
NTES
- NASDAQ
Netease Inc Adr
INTERNET - Internet Information Providers
|
$41.70
|
+0.51
|
1,989,760
78% DAV
2,540,121
|
7/17/2009
(Date
Featured) |
$39.29
(Price
Featured) |
PP = $38.74 |
G |
| MB = $40.68 |
Most Recent Note - 7/28/2009 4:28:00 PM
G - Today's gain on lighter volume ended a 3 session losing streak. Prior chart highs in the $38 area are an important support level to watch. A recent series of 10 consecutive gains was capped off with a considerable gain on 7/22/09 with very heavy volume that lifted it well above its max buy level. It got extended from its latest base. On 7/17/09 it broke out from a 5-week flat base with +44% above average volume behind its gain. First featured at $26.75 in the 3/31/09 CANSLIM.net Mid-Day Breakouts Report (read here). This high-ranked Chinese Internet - Content firm was also summarized in greater detail including an annotated graph in the April 2009 issue of CANSLIM.net News (read here).
>>> The latest Featured Stock Update with an annotated graph appeared on 7/23/2009. click here.
|
|
C
A
S
I |
News |
Chart |
SEC
View all notes Alert
me of new notes
Company
Profile
|
NVEC
- NASDAQ
N V E Corp
ELECTRONICS - Semiconductor - Specialized
|
$54.05
|
-0.75
|
105,513
N/A
|
3/13/2009
(Date
Featured) |
$33.85
(Price
Featured) |
PP = $49.60 |
G |
| MB = $52.08 |
Most Recent Note - 7/28/2009 4:29:36 PM
G - Pulled back today for a second loss on near average volume, yet still trading above its max buy level. Featured in the 7/23/09 Mid-Day BreakOuts Report (read here) after it gapped up for a considerable gain on heavy volume following news of stronger sales revenues (+41%) and solid earnings increases for the quarter ended June 30, 2009. The technical action was described as a "breakaway gap" from a valid ascending base. Patience may allow for shares to be accumulated on pullbacks, and prior highs are now an important support level. A prior breakout from what was also called an ascending base pattern failed as a wave of distribution smacked it down to support at its 50 DMA line. Quarterly sales revenues in the 6 million dollar range are still rather minuscule, leaving concerns.
>>> The latest Featured Stock Update with an annotated graph appeared on 7/17/2009. click here.
|
|
C
A
S
I |
News |
Chart |
SEC
View all notes Alert
me of new notes
Company
Profile
|
SNDA
-
|
$49.48
|
-2.91
|
2,767,624
N/A
|
5/31/2009
(Date
Featured) |
$57.62
(Price
Featured) |
PP = $65.10 |
G |
| MB = $68.36 |
Most Recent Note - 7/28/2009 4:03:06 PM
G - Gapped down again today after the prior session's violation of its 50 DMA line, clearly a distribution day that hurt its outlook. Technically, it also dipped under its June low ($49.73) intra-day, where deterioration raises more serious concerns and triggers additional sell signals. Detailed analysis was included when recently featured in the June 2009 issue of CANSLIM.net News. Be sure to review the "What to Look Out For" section and entire detailed summary - read here).
>>> The latest Featured Stock Update with an annotated graph appeared on 7/27/2009. click here.
|
|
C
A
S
I |
News |
Chart |
SEC
View all notes Alert
me of new notes
Company
Profile
|
SYNA
- NASDAQ
Synaptics Inc
COMPUTER SOFTWARE & SERVICES - Information Technology Service
|
$36.22
|
+0.21
|
1,305,721
90% DAV
1,451,962
|
5/18/2009
(Date
Featured) |
$32.58
(Price
Featured) |
PP = $34.52 |
G |
| MB = $36.25 |
Most Recent Note - 7/28/2009 4:15:53 PM
G - Gain today on lighter volume after the prior session's gap up gain with above average volume and close just above its 50 DMA line helped its outlook. First featured in yellow in the May 18, 2009 mid-day report (read here). The number of top-rated funds owning its shares rose from 123 in June '08 to 210 in June '09, which is good news concerning the I criteria. Its annual earnings (the A criteria) history showed a dowturn in 2006, leaving concerns, but it followed that up with strong growth the next 2 years. Its small supply of shares (the S criteria) outstanding could contribute to especially great volatility in the event of institutional accumulation or distribution.
>>> The latest Featured Stock Update with an annotated graph appeared on 7/22/2009. click here.
|
|
C
A
S
I |
News |
Chart |
SEC
View all notes Alert
me of new notes
Company
Profile
|
TNDM
- NASDAQ
Tandem Diabetes Care Inc
TELECOMMUNICATIONS - Wireless Communications
|
$30.11
|
+0.94
|
381,585
40% DAV
950,296
|
3/2/2009
(Date
Featured) |
$18.89
(Price
Featured) |
PP = $29.85 |
G |
| MB = $31.34 |
Most Recent Note - 7/28/2009 4:17:47 PM
G - Positive reversal today after a small gap down and consolidation near its 50 DMA line, building on a choppy base since its June 2nd high of $32.57 was reached. Subsequent deterioration below that short-term average and recent lows would raise concerns and trigger sell signals. It traded up as much as +72.42% since first featured at $18.89 in the 3/02/09 Mid-Day BreakOuts Report (read here).
>>> The latest Featured Stock Update with an annotated graph appeared on 7/21/2009. click here.
|
|
C
A
S
I |
News |
Chart |
SEC
View all notes Alert
me of new notes
Company
Profile
|
UTA
-
|
$13.47
|
+2.52
|
2,002,786
575% DAV
348,193
|
7/28/2009
(Date
Featured) |
$12.87
(Price
Featured) |
PP = $12.70 |
Y |
| MB = $13.34 |
Most Recent Note - 7/28/2009 4:34:34 PM
Y - Chinese provider of airline tickets and travel related services gapped up today, rising from a choppy 6-week base with a considerable gain on very heavy volume. The strong action prompted it to be featured in yellow with pivot point and max buy levels noted in the 7/28/09 mid-day breakouts report (read here).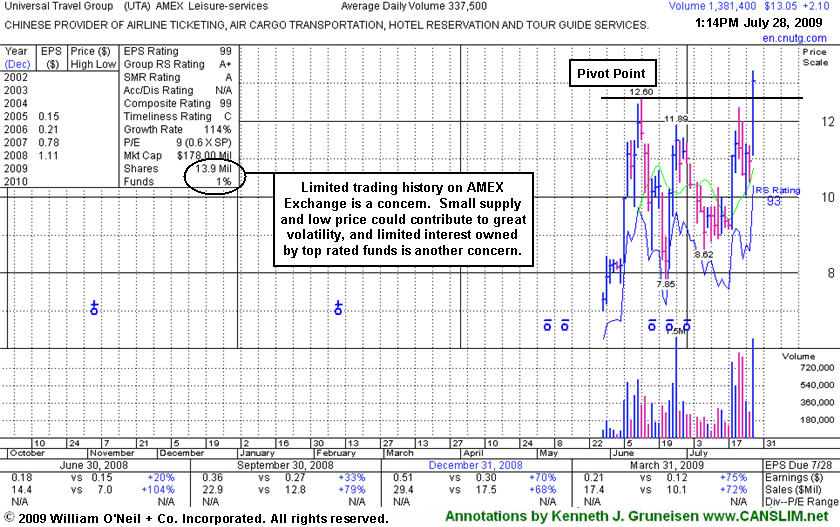
>>> The latest Featured Stock Update with an annotated graph appeared on 7/28/2009. click here.
|
|
C
A
S
I |
News |
Chart |
SEC
View all notes Alert
me of new notes
Company
Profile
|
|
|
|
THESE ARE NOT BUY RECOMMENDATIONS!
Comments contained in the body of this report are technical
opinions only. The material herein has been obtained
from sources believed to be reliable and accurate, however,
its accuracy and completeness cannot be guaranteed.
This site is not an investment advisor, hence it does
not endorse or recommend any securities or other investments.
Any recommendation contained in this report may not
be suitable for all investors and it is not to be deemed
an offer or solicitation on our part with respect to
the purchase or sale of any securities. All trademarks,
service marks and trade names appearing in this report
are the property of their respective owners, and are
likewise used for identification purposes only.
This report is a service available
only to active Paid Premium Members.
You may opt-out of receiving report notifications
at any time. Questions or comments may be submitted
by writing to Premium Membership Services 665 S.E. 10 Street, Suite 201 Deerfield Beach, FL 33441-5634 or by calling 1-800-965-8307
or 954-785-1121.
|
|
|

