You are not logged in.
This means you
CAN ONLY VIEW reports that were published prior to Monday, April 14, 2025.
You
MUST UPGRADE YOUR MEMBERSHIP if you want to see any current reports.
AFTER MARKET UPDATE - MONDAY, JULY 27TH, 2009
Previous After Market Report Next After Market Report >>>
|
|
|
|
DOW |
+15.27 |
9,108.51 |
+0.17% |
|
Volume |
1,043,248,160 |
+2% |
|
Volume |
2,187,831,280 |
-3% |
|
NASDAQ |
+1.93 |
1,967.89 |
+0.10% |
|
Advancers |
1,936 |
62% |
|
Advancers |
1,521 |
54% |
|
S&P 500 |
+2.92 |
982.18 |
+0.30% |
|
Decliners |
1,062 |
34% |
|
Decliners |
1,169 |
41% |
|
Russell 2000 |
+2.42 |
550.88 |
+0.44% |
|
52 Wk Highs |
97 |
|
|
52 Wk Highs |
86 |
|
|
S&P 600 |
+0.84 |
291.80 |
+0.29% |
|
52 Wk Lows |
1 |
|
|
52 Wk Lows |
5 |
|
|
 |
Major Averages End Choppy Session With Small Gains
Kenneth J. Gruneisen - Passed the CAN SLIM® Master's Exam
The volume total on the NYSE was reported slightly higher while the Nasdaq exchange reported lighter volume than the prior session total. Advancers led decliners on the NYSE by almost a 2-to-1 ratio, but advancers led by a narrower 5-to-4 ratio on the Nasdaq exchange. There were 37 high-ranked companies from the CANSLIM.net Leaders List that made a new 52-week high and appeared on the CANSLIM.net BreakOuts Page, up from the 28 issues that appeared on the prior session. On both exchanges new 52-week highs substantially outpaced new 52-week lows - the latter of which was reported in the single digits.
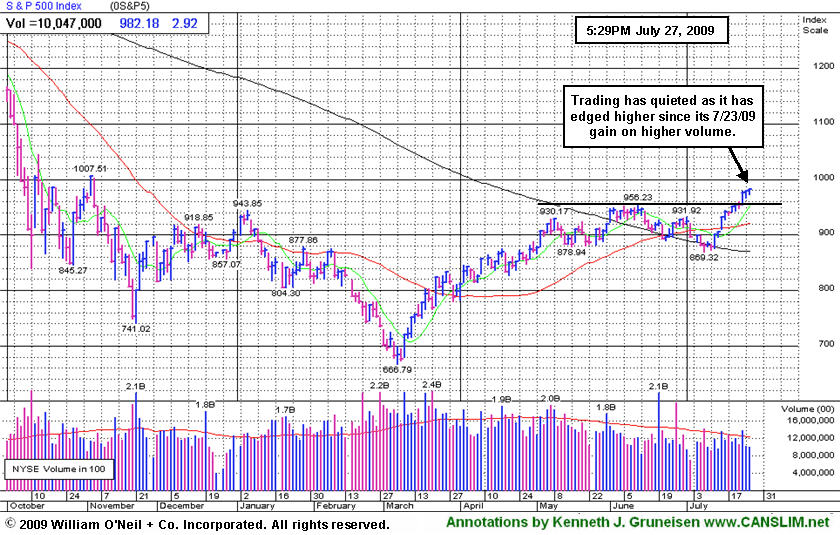
The major averages spent much of Monday's session in the red, but stocks rose with news that new home sales during June spiked 11% to hit a better-than-expected annualized rate of 384,000. That was their highest rate since November, helping the supply of unsold homes shrink to 8.8 months from 10.2 months in May. Enthusiasm over the new home sales report didn't last very long.
The stock market's rally was supported by strength among bank and financial sector stocks, a group that is viewed as an important leading indicator that has repeatedly been mentioned in this commentary. Many major banks have already reported their quarterly results, so there were no big news headlines to which one might attribute the strength. The Wall Street Journal reported that second quarter lending was down nearly -3% among 15 large U.S. banks, providing evidence suggesting that many banks are still being very cautious about putting their money to work.Watching the market reaction to earnings reports and guidance is critical during earnings season, as always.
PICTURED: The volume has quieted, yet the benchmark S&P 500 Index it has edged higher since its 7/23/09 gain on higher volume for new 2009 highs.
|
 Kenneth J. Gruneisen started out as a licensed stockbroker in August 1987, a couple of months prior to the historic stock market crash that took the Dow Jones Industrial Average down -22.6% in a single day. He has published daily fact-based fundamental and technical analysis on high-ranked stocks online for two decades. Through FACTBASEDINVESTING.COM, Kenneth provides educational articles, news, market commentary, and other information regarding proven investment systems that work in good times and bad.
Comments contained in the body of this report are technical opinions only and are not necessarily those of Gruneisen Growth Corp. The material herein has been obtained from sources believed to be reliable and accurate, however, its accuracy and completeness cannot be guaranteed. Our firm, employees, and customers may effect transactions, including transactions contrary to any recommendation herein, or have positions in the securities mentioned herein or options with respect thereto. Any recommendation contained in this report may not be suitable for all investors and it is not to be deemed an offer or solicitation on our part with respect to the purchase or sale of any securities. |
|
 |
Bank Index Rises Above 200 Day Average
Kenneth J. Gruneisen - Passed the CAN SLIM® Master's Exam
Financial stocks helped underpin the major averages' gains, with a solid gains from the Bank Index ($BKX +3.11%) and Broker/Dealer Index ($XBD +1.87%). Meanwhile, the Retail Index ($RLX -1.07%) was one of Monday's worst laggards while losses in the Healthcare Index ($HMO -0.81%) and modest declines for the Gold & Silver Index ($XAU -0.40%) and Oil Services Index ($OSX -0.31%) weighed on the market. The Integrated Oil Index ($XOI +0.68%) posted a small gain, The Networking Index ($NWX -0.72%) and Internet Index ($IIX -0.30%) ended modestly lower while small gains for the Biotechnology Index ($BTK +0.40%) and Semiconductor Index ($SOX +0.58%) helped offset the weakness.
Charts courtesy www.stockcharts.com
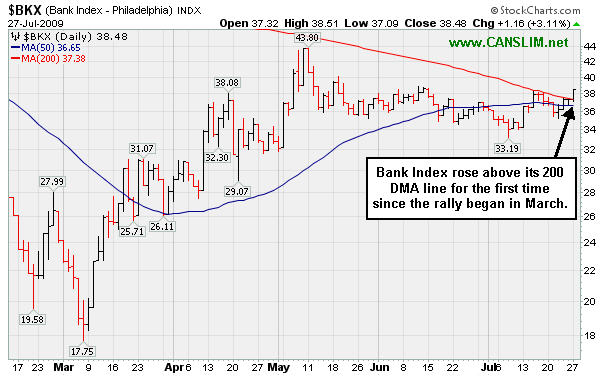
PICTURED: The Bank Index ($BKX +3.11%) was a standout gainer on Monday, trading above its 200-day moving average (DMA) line for the first time since the rally began in March.
| Oil Services |
$OSX |
174.76 |
-0.55 |
-0.31% |
+43.97% |
| Healthcare |
$HMO |
1,110.40 |
-9.03 |
-0.81% |
+15.64% |
| Integrated Oil |
$XOI |
975.66 |
+6.58 |
+0.68% |
-0.41% |
| Semiconductor |
$SOX |
302.64 |
+1.76 |
+0.58% |
+42.64% |
| Networking |
$NWX |
198.13 |
-1.44 |
-0.72% |
+37.70% |
| Internet |
$IIX |
203.20 |
-0.62 |
-0.30% |
+51.90% |
| Broker/Dealer |
$XBD |
107.06 |
+1.97 |
+1.87% |
+38.20% |
| Retail |
$RLX |
347.64 |
-3.75 |
-1.07% |
+24.49% |
| Gold & Silver |
$XAU |
148.90 |
-0.60 |
-0.40% |
+20.23% |
| Bank |
$BKX |
38.48 |
+1.16 |
+3.11% |
-13.18% |
| Biotech |
$BTK |
868.01 |
+3.48 |
+0.40% |
+34.12% |
|
|
|
 |
Distributional Pressure Hurts Shanda's Outlook
Kenneth J. Gruneisen - Passed the CAN SLIM® Master's Exam
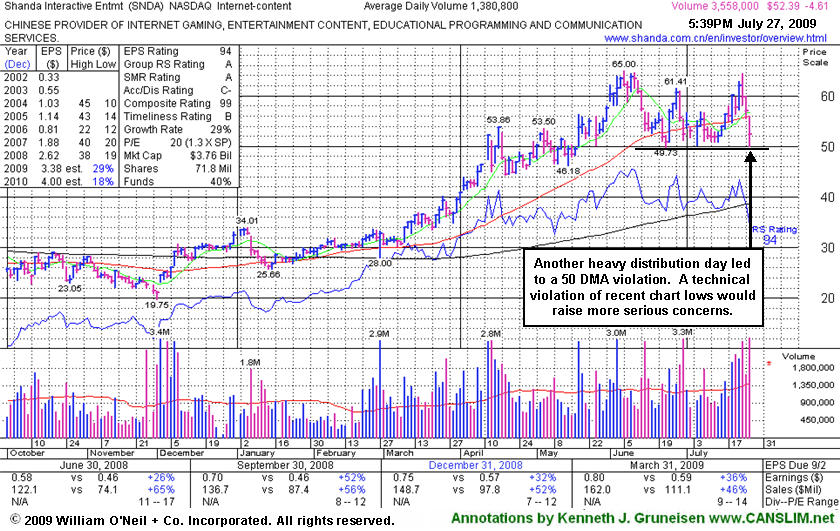
Shanda Interactive Ent Ltd (SNDA -$4.61 or -8.09% to $52.39) gapped down today and violated its 50-day moving average (DMA) line, another clear distribution day that hurts its outlook. When it was recently approaching its all-time highs, a new pivot point was noted and its color code was changed to yellow in the 7/22/09 Mid-Day Breakouts Report (read here). However, that has been followed by three damaging losses in a row. Technically, deterioration under its June low ($49.73) raise more serious concerns and trigger additional sell signals, especially if volume swells behind more damaging losses. Losses on heavy volume in recent weeks were noted as they signaled distributional pressure. For its outlook to improve it needs gains to lift it back above its short-term average. After featured in the June 2009 issue of CANSLIM.net News (read here), SNDA quickly got too extended from a proper buy point. Its outlook now grows increasingly questionable the longer and deeper it slumps into its prior base below it previous chart highs in the $53 area.
|
|
|
Color Codes Explained :
Y - Better candidates highlighted by our
staff of experts.
G - Previously featured
in past reports as yellow but may no longer be buyable under the
guidelines.
***Last / Change / Volume quote data in this table corresponds with the timestamp on the note***
Symbol/Exchange
Company Name
Industry Group |
Last |
Chg. |
Vol
% DAV |
Date Featured |
Price Featured |
Latest Pivot Point
Featured |
Status |
| Latest Max Buy Price |
CPLA
- NASDAQ
Capella Education Co
DIVERSIFIED SERVICES - Education and Training Services
|
$59.78
|
-1.72
|
280,003
133% DAV
210,090
|
7/9/2009
(Date
Featured) |
$59.69
(Price
Featured) |
PP = $62.06 |
Y |
| MB = $65.16 |
Most Recent Note - 7/27/2009 5:07:51 PM
Y - Today was its third loss in a row, and volume picked up late in the session to above average levels. To trigger a technical buy signal, volume should meet or exceeded the +50% above average volume guideline as a stock rises above its pivot point. Featured in yellow in the 7/09/09 Mid-Day BreakOuts Report (read here). The group has shown some leadership, yet currently has a D- for a Relative Strength Rating. CPLA is a high-ranked leader in the Commercial Services-Schools Group. Its small supply of only 13.9 million shares in the float could contribute to greater price volatility in the event of institutional accumulation or distribution. The number of top-rated funds owning an interest rose from 91 in Sept '08, to 132 as of March '09, which is reassuring with respect to the I criteria. It has a very good earnings history that satisfies the C & A criteria, while recent quarters showed steady sales revenues increases in the +17-18% range.
>>> The latest Featured Stock Update with an annotated graph appeared on 7/20/2009. click here.
|
|
C
A
S
I |
News |
Chart |
SEC
View all notes Alert
me of new notes
Company
Profile
|
GMCR
- NASDAQ
Green Mtn Coffee Roastrs
FOOD & BEVERAGE - Processed & Packaged Goods
|
$67.30
|
-1.35
|
658,828
51% DAV
1,284,461
|
7/17/2009
(Date
Featured) |
$60.15
(Price
Featured) |
PP = $63.79 |
G |
| MB = $66.98 |
Most Recent Note - 7/27/2009 2:30:33 PM
G - Quietly consolidating near all-time highs, its prior chart highs in the $62-63 area are initial support to watch above its 50 DMA line. Do not be confused by the 3:2 stock split effective 6/09/09. GMCR traded up more than +168% since appearing with an annotated graph under the headline "It May Soon Be Time To Go Green" when featured in the January 2009 CANSLIM.net News (read here).
>>> The latest Featured Stock Update with an annotated graph appeared on 7/16/2009. click here.
|
|
C
A
S
I |
News |
Chart |
SEC
View all notes Alert
me of new notes
Company
Profile
|
HMSY
- NASDAQ
H M S Holdings Corp
COMPUTER SOFTWARE & SERVICES - Healthcare Information Service
|
$40.47
|
-0.10
|
164,635
52% DAV
317,370
|
2/20/2009
(Date
Featured) |
$34.08
(Price
Featured) |
PP = $38.38 |
G |
| MB = $40.30 |
Most Recent Note - 7/27/2009 2:32:35 PM
G - Quietly consolidating today following a positive reversal on 7/24/09 after a brief pullback below its "max buy" level. This high-ranked Commercial Services - Healthcare firm previously tested prior highs in the $38 area -a very important initial support level that also coincides with its 50 DMA line. A gap up gain on 6/16/09 with heavy volume triggered a technical buy signal.
>>> The latest Featured Stock Update with an annotated graph appeared on 7/24/2009. click here.
|
|
C
A
S
I |
News |
Chart |
SEC
View all notes Alert
me of new notes
Company
Profile
|
NTES
- NASDAQ
Netease Inc Adr
INTERNET - Internet Information Providers
|
$41.19
|
-0.99
|
2,756,643
109% DAV
2,540,121
|
7/17/2009
(Date
Featured) |
$39.29
(Price
Featured) |
PP = $38.74 |
G |
| MB = $40.68 |
Most Recent Note - 7/27/2009 5:10:35 PM
G - Down today, falling for a 3rd straight session on near average volume following a streak of 10 consecutive gains capped off with a considerable gain on 7/22/09 with very heavy volume that lifted it well above its max buy level. It got extended from its latest base. On 7/17/09 it broke out from a 5-week flat base with +44% above average volume behind its gain. First featured at $26.75 in the 3/31/09 CANSLIM.net Mid-Day Breakouts Report (read here). This high-ranked Chinese Internet - Content firm was also summarized in greater detail including an annotated graph in the April 2009 issue of CANSLIM.net News (read here).
>>> The latest Featured Stock Update with an annotated graph appeared on 7/23/2009. click here.
|
|
C
A
S
I |
News |
Chart |
SEC
View all notes Alert
me of new notes
Company
Profile
|
NVEC
- NASDAQ
N V E Corp
ELECTRONICS - Semiconductor - Specialized
|
$54.71
|
-1.76
|
72,501
N/A
|
3/13/2009
(Date
Featured) |
$33.85
(Price
Featured) |
PP = $49.60 |
G |
| MB = $52.08 |
Most Recent Note - 7/27/2009 1:04:18 PM
G - Pulling back today, yet still trading above its max buy level. Featured in the 7/23/09 Mid-Day BreakOuts Report (read here) after it gapped up for a considerable gain on heavy volume following news of stronger sales revenues (+41%) and solid earnings increases for the quarter ended June 30, 2009. The technical action was described as a "breakaway gap" from a valid ascending base. Patience may allow for shares to be accumulated on pullbacks, and prior highs are now an important support level. A prior breakout from what was also called an ascending base pattern failed as a wave of distribution smacked it down to support at its 50 DMA line. Quarterly sales revenues in the 6 million dollar range are still rather minuscule, leaving concerns.
>>> The latest Featured Stock Update with an annotated graph appeared on 7/17/2009. click here.
|
|
C
A
S
I |
News |
Chart |
SEC
View all notes Alert
me of new notes
Company
Profile
|
SNDA
-
|
$50.65
|
-6.35
|
2,636,965
191% DAV
1,379,502
|
5/31/2009
(Date
Featured) |
$57.62
(Price
Featured) |
PP = $65.10 |
G |
| MB = $68.36 |
Most Recent Note - 7/27/2009 2:17:42 PM
G - Gapped down today and violated its 50 DMA line, clearly a distribution day that hurts its outlook. Technically, deterioration under its June low ($49.73) raise more serious concerns and trigger additional sell signals. Detailed analysis was included when recently featured in the June 2009 issue of CANSLIM.net News. Be sure to review the "What to Look Out For" section and entire detailed summary - read here).
>>> The latest Featured Stock Update with an annotated graph appeared on 7/27/2009. click here.
|
|
C
A
S
I |
News |
Chart |
SEC
View all notes Alert
me of new notes
Company
Profile
|
SYNA
- NASDAQ
Synaptics Inc
COMPUTER SOFTWARE & SERVICES - Information Technology Service
|
$36.01
|
+1.22
|
2,033,740
140% DAV
1,451,962
|
5/18/2009
(Date
Featured) |
$32.58
(Price
Featured) |
PP = $34.52 |
G |
| MB = $36.25 |
Most Recent Note - 7/27/2009 5:13:45 PM
G - Gapped up today and closed just above its 50 DMA line with a gain on above average volume, which helps its outlook. First featured in yellow in the May 18, 2009 mid-day report (read here). The number of top-rated funds owning its shares rose from 123 in June '08 to 201 in March '09, which is good news concerning the I criteria. Its annual earnings (the A criteria) history showed a dowturn in 2006, leaving concerns, but it followed that up with strong growth the next 2 years. Its small supply of shares (the S criteria) outstanding could contribute to especially great volatility in the event of institutional accumulation or distribution.
>>> The latest Featured Stock Update with an annotated graph appeared on 7/22/2009. click here.
|
|
C
A
S
I |
News |
Chart |
SEC
View all notes Alert
me of new notes
Company
Profile
|
TNDM
- NASDAQ
Tandem Diabetes Care Inc
TELECOMMUNICATIONS - Wireless Communications
|
$29.17
|
-1.30
|
609,660
64% DAV
950,296
|
3/2/2009
(Date
Featured) |
$18.89
(Price
Featured) |
PP = $29.85 |
G |
| MB = $31.34 |
Most Recent Note - 7/27/2009 5:14:54 PM
G - Consolidating near its 50 DMA line, building on a choppy base since its June 2nd high of $32.57 was reached. Subsequent deterioration below that short-term average and recent lows would raise concerns and trigger sell signals. It traded up as much as +72.42% since first featured at $18.89 in the 3/02/09 Mid-Day BreakOuts Report (read here).
>>> The latest Featured Stock Update with an annotated graph appeared on 7/21/2009. click here.
|
|
C
A
S
I |
News |
Chart |
SEC
View all notes Alert
me of new notes
Company
Profile
|
|
|
|
THESE ARE NOT BUY RECOMMENDATIONS!
Comments contained in the body of this report are technical
opinions only. The material herein has been obtained
from sources believed to be reliable and accurate, however,
its accuracy and completeness cannot be guaranteed.
This site is not an investment advisor, hence it does
not endorse or recommend any securities or other investments.
Any recommendation contained in this report may not
be suitable for all investors and it is not to be deemed
an offer or solicitation on our part with respect to
the purchase or sale of any securities. All trademarks,
service marks and trade names appearing in this report
are the property of their respective owners, and are
likewise used for identification purposes only.
This report is a service available
only to active Paid Premium Members.
You may opt-out of receiving report notifications
at any time. Questions or comments may be submitted
by writing to Premium Membership Services 665 S.E. 10 Street, Suite 201 Deerfield Beach, FL 33441-5634 or by calling 1-800-965-8307
or 954-785-1121.
|
|
|

