You are not logged in.
This means you
CAN ONLY VIEW reports that were published prior to Monday, April 14, 2025.
You
MUST UPGRADE YOUR MEMBERSHIP if you want to see any current reports.
AFTER MARKET UPDATE - FRIDAY, JULY 26TH, 2013
Previous After Market Report Next After Market Report >>>
|
|
|
|
DOW |
+3.22 |
15,558.83 |
+0.02% |
|
Volume |
597,212,870 |
-12% |
|
Volume |
1,652,933,080 |
-19% |
|
NASDAQ |
+7.97 |
3,613.16 |
+0.22% |
|
Advancers |
1,409 |
46% |
|
Advancers |
944 |
36% |
|
S&P 500 |
+1.40 |
1,691.65 |
+0.08% |
|
Decliners |
1,562 |
51% |
|
Decliners |
1,539 |
59% |
|
Russell 2000 |
-5.67 |
1,048.51 |
-0.54% |
|
52 Wk Highs |
104 |
|
|
52 Wk Highs |
141 |
|
|
S&P 600 |
-3.20 |
588.67 |
-0.54% |
|
52 Wk Lows |
43 |
|
|
52 Wk Lows |
20 |
|
|
 |
Indices Quietly Hovering Near 2013 Highs
Kenneth J. Gruneisen - Passed the CAN SLIM® Master's Exam
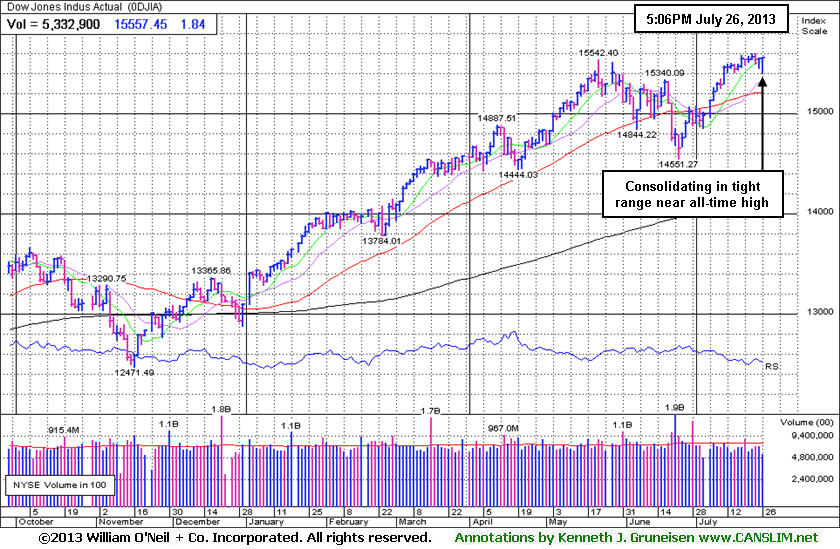
For the week, the Dow Jones Industrial Average added less than +0.1%, the S&P 500 Index was virtually unchanged and the Nasdaq Composite Index advanced +0.7%. The major averages finished little changed on Friday. Volume totals were reported lighter than the prior session totals on the NYSE and on the Nasdaq exchange. Decliners led advancers by a 3-2 margin on the Nasdaq exchange and by about a narrower 8-7 margin on the NYSE. There were 54 high-ranked companies from the CANSLIM.net Leaders List made new 52-week highs and appeared on the CANSLIM.net BreakOuts Page, down from the prior session total of 65 stocks. The list of stocks hitting new 52-week highs outnumbered new 52-week lows on both the NYSE and the Nasdaq exchange. There were gains for 5 of the 12 high-ranked companies currently included on the Featured Stocks Page.
Stocks recovered from their early lows as investors prepared for next week's FOMC meeting and non-farm payrolls report. Consumer sentiment hit a six year high, however most sectors on the S&P ended lower, led by a decline in telecom stocks.
On the earnings front, Starbucks Corp (SBUX +7.61%) rallied after the company posted earnings ahead of analysts' expectations and raised their full-year forecast. Shares of Gilead Sciences Inc (GILD +2.81%) also finished higher as the drug maker reported revenues ahead of estimates. On the downside, travel website Expedia Inc (EXPE -27.38%) fell following their disappointing profit tally. Online gaming company Zynga Inc (ZNGA -14.0%) felll after warning of weaker-than-expected current quarter earnings and announcing that it halted development of its U.S. online gambling business.
Turning to fixed income markets, Treasuries were modestly higher along the curve. The benchmark 10-year note was up 3/32 to yield 2.57% and the 30-year bond gained 13/32 to yield 3.62%.
The market (M criteria) has flashed substantial strength and leadership. Now in a confirmed rally, odds are considered favorable for investors' success with new buying efforts. Investors should be disciplined and selective while looking to be proactive and focused exclusively on the individual leaders best matching the winning models of the fact-based investment system. Study the companies on the CANSLIM.net Featured Stocks Page - a page showing the most action-worthy candidates' latest notes and links to additional resources including detailed analysis with data-packed graphs which are annotated by a Certified expert. The Premium Member Homepage - includes "dynamic archives" to all prior pay reports published. Watch for an announcement via email concerning the next WEBCAST.
PICTURED: The Dow Jones Industrial Average is consolidating in a tight range near its all-time high with an +18.7% year-to-date.
|
 Kenneth J. Gruneisen started out as a licensed stockbroker in August 1987, a couple of months prior to the historic stock market crash that took the Dow Jones Industrial Average down -22.6% in a single day. He has published daily fact-based fundamental and technical analysis on high-ranked stocks online for two decades. Through FACTBASEDINVESTING.COM, Kenneth provides educational articles, news, market commentary, and other information regarding proven investment systems that work in good times and bad.
Comments contained in the body of this report are technical opinions only and are not necessarily those of Gruneisen Growth Corp. The material herein has been obtained from sources believed to be reliable and accurate, however, its accuracy and completeness cannot be guaranteed. Our firm, employees, and customers may effect transactions, including transactions contrary to any recommendation herein, or have positions in the securities mentioned herein or options with respect thereto. Any recommendation contained in this report may not be suitable for all investors and it is not to be deemed an offer or solicitation on our part with respect to the purchase or sale of any securities. |
|
 |
Financial, Tech, and Energy-Related Groups Lost Ground
Kenneth J. Gruneisen - Passed the CAN SLIM® Master's Exam
Financial shares edged lower on Friday as the Broker/Dealer Index ($XBD -0.82%) and Bank Index ($BKX -0.33%) lost ground. The Networking Index ($NWX -1.59%) led the tech sector lower while the Semiconductor Index ($SOX -0.90%) and Internet Index ($IIX -0.41%) each suffered smaller losses and the Biotechnology Index ($BTK -0.04%) finished flat. Energy-related shares were weaker as the Oil Services Index ($OSX -1.09%) and Integrated Oil Index ($XOI -0.31%) lost ground. Defensive groups were mixed as the Healthcare Index ($HMO -1.40%) fell and the Gold & Silver Index ($XAU +0.94%) posted a gain.
Charts courtesy www.stockcharts.com
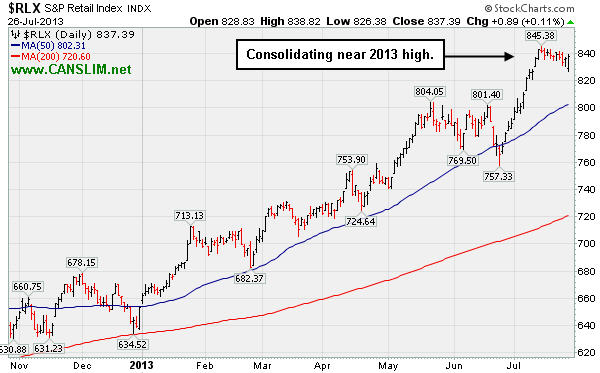
PICTURED: The Retail Index ($RLX +0.11%) eked out a tiny gain while hovering in a tight range near its 2013 high.
| Oil Services |
$OSX |
262.79 |
-2.89 |
-1.09% |
+19.36% |
| Healthcare |
$HMO |
3,396.43 |
-48.38 |
-1.40% |
+35.09% |
| Integrated Oil |
$XOI |
1,404.13 |
-4.30 |
-0.31% |
+13.07% |
| Semiconductor |
$SOX |
473.12 |
-4.28 |
-0.90% |
+23.19% |
| Networking |
$NWX |
282.23 |
-4.57 |
-1.59% |
+24.58% |
| Internet |
$IIX |
404.71 |
-1.67 |
-0.41% |
+23.76% |
| Broker/Dealer |
$XBD |
133.94 |
-1.11 |
-0.82% |
+41.99% |
| Retail |
$RLX |
837.39 |
+0.89 |
+0.11% |
+28.23% |
| Gold & Silver |
$XAU |
100.88 |
+0.94 |
+0.94% |
-39.08% |
| Bank |
$BKX |
65.98 |
-0.22 |
-0.33% |
+28.67% |
| Biotech |
$BTK |
2,144.05 |
-0.89 |
-0.04% |
+38.59% |
|
|
|
 |
Powering to New High Territory With Volume Driven Gains
Kenneth J. Gruneisen - Passed the CAN SLIM® Master's Exam
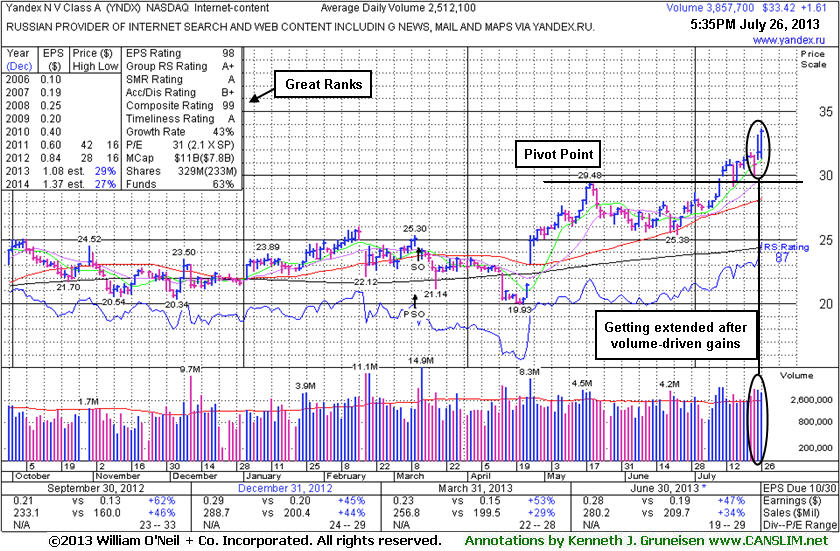
Yandex (YNDX +$1.61 or +5.06% to $33.42) spiked to another new 52-week high with a 2nd consecutive volume-driven gain, getting more extended from its previous base. Disciplined investors do not chase stocks more than +5% above their pivot point. Doing so increases the chance that an ordinary pullback may trigger the strict sell rules which limit losses when any stock falls more than -7% from their purchase price.
YNDX was highlighted in yellow with pivot point ($29.58) cited based on its 5/20/13 high plus 10 cents and an annotated weekly graph was included in the 7/10/13 mid-day report (read here) and it appeared in the FSU section that evening with an annotated graph under the headline, "Finished Near Pivot Point With Solid Volume-Driven Gain". Then it gapped up and rallied above the $30 threshold the next day with another volume-driven gain clinching a proper technical buy signal. When consolidating it found support above prior highs in the $28-29 area which defined initial support to watch.
The company has shown strong quarterly sales revenues and earnings increases through Jun '13 versus the year ago periods. It has earned high ranks and maintained a strong quarterly and annual earnings history (C and A criteria). The number of top-rated funds owning its shares rose from 276 in Sep '12 to 431 in Jun '13, a reassuring sign concerning the I criteria. The Internet - Content group has recently shown leadership and it currently has the highest possible A+ Group Relative Strength Rating, a reassuring sign concerning the L criteria of the fact-based investment system.
|
|
|
Color Codes Explained :
Y - Better candidates highlighted by our
staff of experts.
G - Previously featured
in past reports as yellow but may no longer be buyable under the
guidelines.
***Last / Change / Volume data in this table is the closing quote data***
Symbol/Exchange
Company Name
Industry Group |
PRICE |
CHANGE
(%Change) |
Day High |
Volume
(% DAV)
(% 50 day avg vol) |
52 Wk Hi
% From Hi |
Featured
Date |
Price
Featured |
Pivot Featured |
|
Max Buy |
AMBA
-
NASDAQ
Ambarella Inc
ELECTRONICS - Semiconductor - Specialized
|
$18.36
|
-0.10
-0.54% |
$18.46
|
313,097
26.05% of 50 DAV
50 DAV is 1,201,900
|
$19.44
-5.55%
|
7/15/2013
|
$17.87
|
PP = $18.68
|
|
MB = $19.61
|
Most Recent Note - 7/24/2013 6:26:04 PM
Y - Pulled back below its pivot point today with a 2nd consecutive loss backed by lighter than average volume. It broke out from its latest base pattern on 7/17/13 with +65% above average volume triggering a new (or add-on) technical buy signal.
>>> The latest Featured Stock Update with an annotated graph appeared on 7/17/2013. Click here.
View all notes |
Alert me of new notes |
CANSLIM.net Company Profile |
SEC |
Zacks Reports |
StockTalk |
News |
Chart |
Request a new note
C
A N
S L
I M


|
CELG
-
NASDAQ
Celgene Corp
DRUGS - Drug Manufacturers - Major
|
$143.94
|
+3.29
2.34% |
$144.15
|
3,914,580
132.81% of 50 DAV
50 DAV is 2,947,600
|
$140.79
2.24%
|
7/11/2013
|
$133.25
|
PP = $131.92
|
|
MB = $138.52
|
Most Recent Note - 7/25/2013 5:52:53 PM
Y - Rallied today for a solid gain and a best-ever close with average volume. Found support when consolidating above prior highs following its "breakaway gap".
>>> The latest Featured Stock Update with an annotated graph appeared on 7/11/2013. Click here.
View all notes |
Alert me of new notes |
CANSLIM.net Company Profile |
SEC |
Zacks Reports |
StockTalk |
News |
Chart |
Request a new note
C
A N
S L
I M
|
FLT
-
NYSE
Fleetcor Technologies
DIVERSIFIED SERVICES - Business/Management Services
|
$90.46
|
+2.85
3.25% |
$90.92
|
587,325
77.62% of 50 DAV
50 DAV is 756,700
|
$89.75
0.79%
|
5/29/2013
|
$86.02
|
PP = $85.66
|
|
MB = $89.94
|
 Most Recent Note - 7/26/2013 5:04:34 PM
G- Rallied for a new all-time high today with a gain lacking great volume conviction. Found support near its 50 DMA during its latest consolidation.
>>> The latest Featured Stock Update with an annotated graph appeared on 7/18/2013. Click here.
View all notes |
Alert me of new notes |
CANSLIM.net Company Profile |
SEC |
Zacks Reports |
StockTalk |
News |
Chart |
Request a new note
C
A N
S L
I M
|
LOPE
-
NASDAQ
Grand Canyon Education
DIVERSIFIED SERVICES - Education and; Training Services
|
$35.74
|
-0.25
-0.69% |
$35.99
|
282,612
66.70% of 50 DAV
50 DAV is 423,700
|
$36.45
-1.95%
|
6/19/2013
|
$31.47
|
PP = $34.17
|
|
MB = $35.88
|
Most Recent Note - 7/24/2013 6:28:19 PM
Y - Reversed into the red for a loss with above average volume, ending just below its "max buy" level . Prior highs in the $34 area define initial support above its 50 DMA line. Reports its second quarter results after market close on Tuesday, July 30, 2013.
>>> The latest Featured Stock Update with an annotated graph appeared on 7/19/2013. Click here.
View all notes |
Alert me of new notes |
CANSLIM.net Company Profile |
SEC |
Zacks Reports |
StockTalk |
News |
Chart |
Request a new note
C
A N
S L
I M
|
PCLN
-
NASDAQ
Priceline.Com Inc
INTERNET - Internet Software and Services
|
$900.08
|
-11.92
-1.31% |
$907.25
|
1,020,314
145.26% of 50 DAV
50 DAV is 702,400
|
$926.40
-2.84%
|
7/8/2013
|
$878.28
|
PP = $847.43
|
|
MB = $889.80
|
Most Recent Note - 7/26/2013 12:52:52 PM
G - Small gap down today erased the prior gain. Extended from its prior base, consolidating in a tight range near its high. Prior highs in the $847 area define support to watch on pullbacks. See the latest FSU analysis for more details and a new annotated graph.
>>> The latest Featured Stock Update with an annotated graph appeared on 7/25/2013. Click here.
View all notes |
Alert me of new notes |
CANSLIM.net Company Profile |
SEC |
Zacks Reports |
StockTalk |
News |
Chart |
Request a new note
C
A N
S L
I M
|
Symbol/Exchange
Company Name
Industry Group |
PRICE |
CHANGE
(%Change) |
Day High |
Volume
(% DAV)
(% 50 day avg vol) |
52 Wk Hi
% From Hi |
Featured
Date |
Price
Featured |
Pivot Featured |
|
Max Buy |
PRLB
-
NYSE
Proto Labs Inc
MANUFACTURING - Small Tools and Accessories
|
$64.03
|
-0.31
-0.48% |
$64.44
|
115,937
26.93% of 50 DAV
50 DAV is 430,500
|
$67.40
-5.00%
|
6/17/2013
|
$59.37
|
PP = $59.94
|
|
MB = $62.94
|
Most Recent Note - 7/26/2013 5:06:02 PM
G - Still holding its ground in a tight rage with volume totals cooling. Prior highs and its 50 DMA line define important support.
>>> The latest Featured Stock Update with an annotated graph appeared on 7/15/2013. Click here.
View all notes |
Alert me of new notes |
CANSLIM.net Company Profile |
SEC |
Zacks Reports |
StockTalk |
News |
Chart |
Request a new note
C
A N
S L
I M
|
RRTS
-
NYSE
Roadrunner Trans Systems
TRANSPORTATION - Air Delivery and Freight Service
|
$30.38
|
+0.54
1.81% |
$30.41
|
117,512
76.81% of 50 DAV
50 DAV is 153,000
|
$30.50
-0.39%
|
4/3/2013
|
$22.77
|
PP = $23.75
|
|
MB = $24.94
|
Most Recent Note - 7/22/2013 6:02:05 PM
G - Perched near its 52-week high with volume totals cooling while extended from any sound base. Reports results for the Jun '13 quarter on Wednesday, July 31, 2013 after market close. See the latest FSU analysis for more details and a new annotated graph.
>>> The latest Featured Stock Update with an annotated graph appeared on 7/22/2013. Click here.
View all notes |
Alert me of new notes |
CANSLIM.net Company Profile |
SEC |
Zacks Reports |
StockTalk |
News |
Chart |
Request a new note
C
A N
S L
I M
|
SFUN
-
NYSE
Soufun Hldgs Ltd Ads A
INTERNET - Internet Information Providers
|
$36.29
|
+4.12
12.81% |
$36.43
|
1,157,958
382.67% of 50 DAV
50 DAV is 302,600
|
$33.03
9.87%
|
7/16/2013
|
$29.54
|
PP = $27.90
|
|
MB = $29.30
|
Most Recent Note - 7/26/2013 12:54:39 PM
G - Rallying for a 4th consecutive gain with ever-increasing volume and hitting new all-time highs, getting more extended from its latest base. Prior highs in the $28-29 area define initial support to watch.
>>> The latest Featured Stock Update with an annotated graph appeared on 7/16/2013. Click here.
View all notes |
Alert me of new notes |
CANSLIM.net Company Profile |
SEC |
Zacks Reports |
StockTalk |
News |
Chart |
Request a new note
C
A N
S L
I M
|
SSNC
-
NASDAQ
S S & C Technologies
COMPUTER SOFTWARE and SERVICES - Application Software
|
$35.59
|
-1.20
-3.26% |
$36.60
|
617,594
158.40% of 50 DAV
50 DAV is 389,900
|
$38.47
-7.49%
|
7/11/2013
|
$35.80
|
PP = $34.54
|
|
MB = $36.27
|
Most Recent Note - 7/26/2013 6:07:04 PM
Y - Loss today with above average volume was a sign of distributional pressure. Color code is changed to yellow after slumping below its "max buy" level. Prior highs in the $34 area define initial support to watch above its 50 DMA line.
>>> The latest Featured Stock Update with an annotated graph appeared on 7/12/2013. Click here.
View all notes |
Alert me of new notes |
CANSLIM.net Company Profile |
SEC |
Zacks Reports |
StockTalk |
News |
Chart |
Request a new note
C
A N
S L
I M
|
SSYS
-
NASDAQ
Stratasys Ltd
COMPUTER HARDWARE - Computer Peripherals
|
$88.15
|
-1.40
-1.56% |
$89.73
|
371,750
49.67% of 50 DAV
50 DAV is 748,400
|
$96.44
-8.60%
|
7/8/2013
|
$91.44
|
PP = $95.00
|
|
MB = $99.75
|
Most Recent Note - 7/25/2013 5:57:02 PM
Y - Rallied from its 50 DMA line today with a gain backed by light volume. Relative Strength Rating has slumped to 75, below the 80+ minimum guideline for buy candidates while consolidating above support at its 50 DMA line. See the latest FSU analysis for more details and an annotated graph.
>>> The latest Featured Stock Update with an annotated graph appeared on 7/24/2013. Click here.
View all notes |
Alert me of new notes |
CANSLIM.net Company Profile |
SEC |
Zacks Reports |
StockTalk |
News |
Chart |
Request a new note
C
A N
S L
I M
|
Symbol/Exchange
Company Name
Industry Group |
PRICE |
CHANGE
(%Change) |
Day High |
Volume
(% DAV)
(% 50 day avg vol) |
52 Wk Hi
% From Hi |
Featured
Date |
Price
Featured |
Pivot Featured |
|
Max Buy |
VRX
-
NYSE
Valeant Pharmaceuticals
DRUGS - Drug Manufacturers - Other
|
$91.96
|
-0.03
-0.03% |
$92.01
|
457,134
22.64% of 50 DAV
50 DAV is 2,019,300
|
$96.25
-4.46%
|
4/30/2013
|
$60.24
|
PP = $76.66
|
|
MB = $80.49
|
Most Recent Note - 7/23/2013 5:47:13 PM
Y- Volume totals have been cooling while consolidating near 52-week high after completing a new Public Offering on 6/18/13 following recent M&A news. Formed a cup-with-handle base over the past 8 weeks, however no new pivot point is being cited. Concerns were raised by its Mar '13 earnings report with only a +14% earnings increase, below the +25% minimum guideline (C criteria) for buy candidates. See latest FSU analysis for more details and a new annotated graph.
>>> The latest Featured Stock Update with an annotated graph appeared on 7/23/2013. Click here.
View all notes |
Alert me of new notes |
CANSLIM.net Company Profile |
SEC |
Zacks Reports |
StockTalk |
News |
Chart |
Request a new note
C
A N
S L
I M
|
YNDX
-
NASDAQ
Yandex N V Class A
INTERNET - Internet Information Providers
|
$33.42
|
+1.61
5.06% |
$33.66
|
3,858,727
153.61% of 50 DAV
50 DAV is 2,512,100
|
$33.15
0.81%
|
7/10/2013
|
$29.29
|
PP = $29.59
|
|
MB = $31.07
|
Most Recent Note - 7/26/2013 5:07:51 PM
G - Hit another new 52-week high with a 2nd consecutive volume-driven gain, getting extended. Prior highs in the $28-29 area define near-term support to watch.
>>> The latest Featured Stock Update with an annotated graph appeared on 7/26/2013. Click here.
View all notes |
Alert me of new notes |
CANSLIM.net Company Profile |
SEC |
Zacks Reports |
StockTalk |
News |
Chart |
Request a new note
C
A N
S L
I M
|
|
|
|
THESE ARE NOT BUY RECOMMENDATIONS!
Comments contained in the body of this report are technical
opinions only. The material herein has been obtained
from sources believed to be reliable and accurate, however,
its accuracy and completeness cannot be guaranteed.
This site is not an investment advisor, hence it does
not endorse or recommend any securities or other investments.
Any recommendation contained in this report may not
be suitable for all investors and it is not to be deemed
an offer or solicitation on our part with respect to
the purchase or sale of any securities. All trademarks,
service marks and trade names appearing in this report
are the property of their respective owners, and are
likewise used for identification purposes only.
This report is a service available
only to active Paid Premium Members.
You may opt-out of receiving report notifications
at any time. Questions or comments may be submitted
by writing to Premium Membership Services 665 S.E. 10 Street, Suite 201 Deerfield Beach, FL 33441-5634 or by calling 1-800-965-8307
or 954-785-1121.
|
|
|

