You are not logged in.
This means you
CAN ONLY VIEW reports that were published prior to Monday, April 14, 2025.
You
MUST UPGRADE YOUR MEMBERSHIP if you want to see any current reports.
AFTER MARKET UPDATE - THURSDAY, JULY 25TH, 2013
Previous After Market Report Next After Market Report >>>
|
|
|
|
DOW |
+13.37 |
15,555.61 |
+0.09% |
|
Volume |
680,613,890 |
+0% |
|
Volume |
2,031,345,010 |
+17% |
|
NASDAQ |
+25.59 |
3,605.19 |
+0.71% |
|
Advancers |
1,723 |
55% |
|
Advancers |
1,653 |
64% |
|
S&P 500 |
+4.31 |
1,690.25 |
+0.26% |
|
Decliners |
1,307 |
42% |
|
Decliners |
843 |
32% |
|
Russell 2000 |
+10.35 |
1,054.18 |
+0.99% |
|
52 Wk Highs |
151 |
|
|
52 Wk Highs |
220 |
|
|
S&P 600 |
+5.07 |
591.87 |
+0.86% |
|
52 Wk Lows |
112 |
|
|
52 Wk Lows |
18 |
|
|
 |
Major Averages Overcame Weakness to Finish Higher
Kenneth J. Gruneisen - Passed the CAN SLIM® Master's Exam
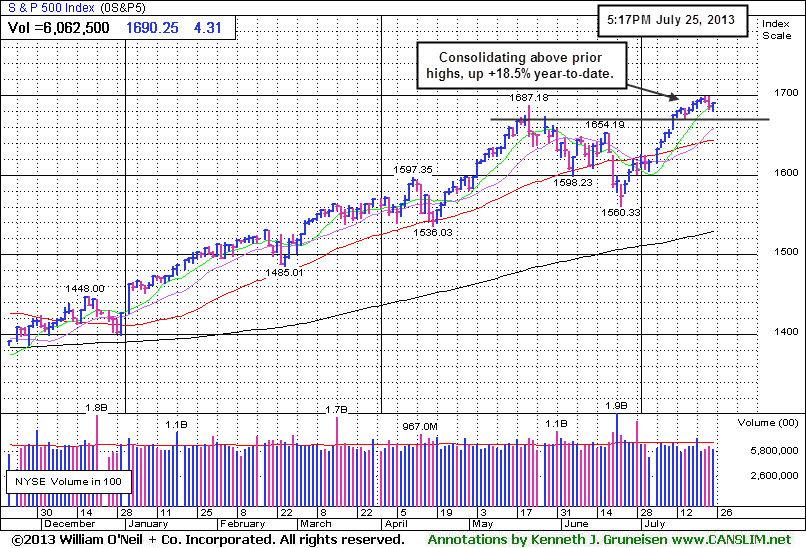
On Thursday stocks overcame early weakness and the Dow Jones Industrial Average advanced 13 points to 15,555 after being down by as many as 86 points earlier. Volume totals were reported higher than the prior session totals on the NYSE and on the Nasdaq exchange, a hint that institutional buying demand picked up. Breadth was positive as advancers led decliners by a 2-1 margin on the Nasdaq exchange and by about a 3-2 margin on the NYSE. There were 65 high-ranked companies from the CANSLIM.net Leaders List made new 52-week highs and appeared on the CANSLIM.net BreakOuts Page, down from the prior session total of 76 stocks. The list of stocks hitting new 52-week highs outnumbered new 52-week lows on both the NYSE and the Nasdaq exchange. There were gains for 6 of the 12 high-ranked companies currently included on the Featured Stocks Page.
Stocks were choppy from the opening bell as investors digested a batch of mixed economic reports and corporate earnings. Looking at the data, weekly jobless claims were largely in-line with expectations, rising to 343,000 in the prior week. On the upside, June durable goods orders exceeded expectations and rose +4.2%.
Eight of the 10 sectors on the S&P ended higher, led by gains in material stocks. Shares of Newmont Mining Corp (NEM +1.1%) as gold prices advanced +0.8% to $1,330 an ounce. On the earnings front, Facebook Inc (FB +29.6%) spiked higher after posting quarterly results that topped analysts' expectations. Also on the upside, Qualcomm Inc (QCOM +3.3%) and Dow Chemical Corp (DOW +1.8%) rose following their better-than-anticipated profit tallies.
Turning to fixed income markets, Treasuries were little changed along the curve. The benchmark 10-year note was up 3/32 to yield 2.58% and the 30-year bond gave up 1/16 of a point to yield 3.65%.
The market (M criteria) has flashed substantial strength and leadership. Now in a confirmed rally, odds are considered favorable for investors' success with new buying efforts. Investors should be disciplined and selective while looking to be proactive and focused exclusively on the individual leaders best matching the winning models of the fact-based investment system. Study the companies on the CANSLIM.net Featured Stocks Page - a page showing the most action-worthy candidates' latest notes and links to additional resources including detailed analysis with data-packed graphs which are annotated by a Certified expert. The Premium Member Homepage - includes "dynamic archives" to all prior pay reports published. Watch for an announcement via email concerning the next WEBCAST.
PICTURED: The S&P 500 Index is consolidating above prior highs and up +18.5% year-to-date.
|
 Kenneth J. Gruneisen started out as a licensed stockbroker in August 1987, a couple of months prior to the historic stock market crash that took the Dow Jones Industrial Average down -22.6% in a single day. He has published daily fact-based fundamental and technical analysis on high-ranked stocks online for two decades. Through FACTBASEDINVESTING.COM, Kenneth provides educational articles, news, market commentary, and other information regarding proven investment systems that work in good times and bad.
Comments contained in the body of this report are technical opinions only and are not necessarily those of Gruneisen Growth Corp. The material herein has been obtained from sources believed to be reliable and accurate, however, its accuracy and completeness cannot be guaranteed. Our firm, employees, and customers may effect transactions, including transactions contrary to any recommendation herein, or have positions in the securities mentioned herein or options with respect thereto. Any recommendation contained in this report may not be suitable for all investors and it is not to be deemed an offer or solicitation on our part with respect to the purchase or sale of any securities. |
|
 |
Tech, Broker/Dealer, Retail, and Gold & Silver Indexes Rose
Kenneth J. Gruneisen - Passed the CAN SLIM® Master's Exam
The Networking Index ($NWX +1.25%) and the Internet Index ($IIX +1.63%) led the tech sector higher while the Semiconductor Index ($SOX +0.57%) and the Biotechnology Index ($BTK +0.28%) posted smaller gains. The Retail Index ($RLX +0.38%) also edged higher. Financial shares were mixed as the Broker/Dealer Index ($XBD +0.70%) posted a gain but the Bank Index ($BKX -0.27%) edged lower. Energy-related shares were mixed as the Oil Services Index ($OSX -0.36%) edged lower and the Integrated Oil Index ($XOI +0.57%) posted a small gain. Defensive groups were also mixed as the Gold & Silver Index ($XAU +1.04%) rose, but the Healthcare Index ($HMO -0.97%) was a laggard as it lost ground.
Charts courtesy www.stockcharts.com
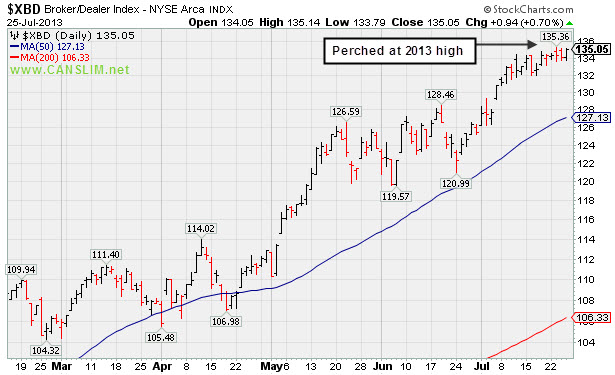
PICTURED: The Broker/Dealer Index ($XBD +0.70%) posted a gain and it is perched at its 2013 high.
| Oil Services |
$OSX |
265.68 |
-0.95 |
-0.36% |
+20.68% |
| Healthcare |
$HMO |
3,444.81 |
-33.65 |
-0.97% |
+37.02% |
| Integrated Oil |
$XOI |
1,408.43 |
+7.99 |
+0.57% |
+13.42% |
| Semiconductor |
$SOX |
477.40 |
+2.71 |
+0.57% |
+24.30% |
| Networking |
$NWX |
286.80 |
+3.54 |
+1.25% |
+26.59% |
| Internet |
$IIX |
406.37 |
+6.51 |
+1.63% |
+24.27% |
| Broker/Dealer |
$XBD |
135.05 |
+0.94 |
+0.70% |
+43.17% |
| Retail |
$RLX |
836.50 |
+3.15 |
+0.38% |
+28.09% |
| Gold & Silver |
$XAU |
99.94 |
+1.03 |
+1.04% |
-39.65% |
| Bank |
$BKX |
66.20 |
-0.18 |
-0.27% |
+29.10% |
| Biotech |
$BTK |
2,144.94 |
+6.09 |
+0.28% |
+38.65% |
|
|
|
 |
Still Consolidating Well Above Prior Highs
Kenneth J. Gruneisen - Passed the CAN SLIM® Master's Exam
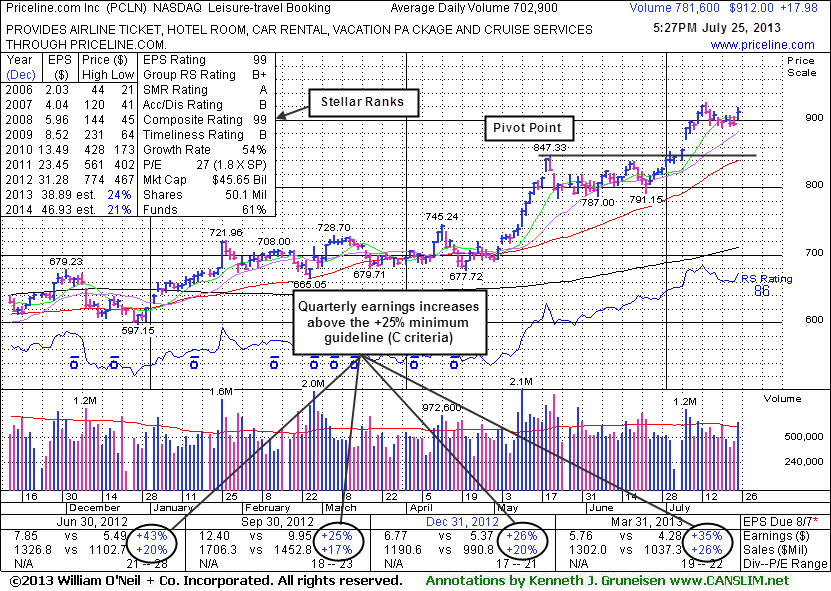
Priceline.com Inc. (PCLN +$17.98 or +2.01% to $912.00) posted a gain today with above average volume. It has been consolidating in a tight range well above prior highs in the $847 area which define initial support to watch on pullbacks. PCLN was last shown in the FSU section on 7/09/13 with an annotated graph under the headline, "Posted 10th Consecutive Gain, Getting Extended From Base", as it rallied above its "max buy" level to new 52-week and all-time highs.
The Leisure - Travel Booking firm has earned stellar ranks. Keep in mind that it is due to report earnings on August 8th. Volume and volatility often increase near earnings news. The company reported earnings +35% on +26% sales revenues for the latest quarter ended March 31, 2013 versus the year ago period, maintaining a strong earnings history that satisfies both the C and A criteria.
Keep in mind, the investment system's biggest winning models were typically held by at least a few mutual funds and attracting many others. However, once a stock is very heavily owned by a long list of mutual funds, as is now the case with PCLN, investors should be especially cautious and alert for any technical sell signals or fundamental disappointments which could prompt a rush for the exits. The number of top-rated funds owning its shares rose from 1,528 in Sep '12 to 1,639 in Jun '13, and increasing interest is an encouraging sign concerning the I criteria.
|
|
|
Color Codes Explained :
Y - Better candidates highlighted by our
staff of experts.
G - Previously featured
in past reports as yellow but may no longer be buyable under the
guidelines.
***Last / Change / Volume data in this table is the closing quote data***
Symbol/Exchange
Company Name
Industry Group |
PRICE |
CHANGE
(%Change) |
Day High |
Volume
(% DAV)
(% 50 day avg vol) |
52 Wk Hi
% From Hi |
Featured
Date |
Price
Featured |
Pivot Featured |
|
Max Buy |
AMBA
-
NASDAQ
Ambarella Inc
ELECTRONICS - Semiconductor - Specialized
|
$18.46
|
+0.22
1.21% |
$18.65
|
360,295
29.33% of 50 DAV
50 DAV is 1,228,500
|
$19.44
-5.04%
|
7/15/2013
|
$17.87
|
PP = $18.68
|
|
MB = $19.61
|
Most Recent Note - 7/24/2013 6:26:04 PM
Y - Pulled back below its pivot point today with a 2nd consecutive loss backed by lighter than average volume. It broke out from its latest base pattern on 7/17/13 with +65% above average volume triggering a new (or add-on) technical buy signal.
>>> The latest Featured Stock Update with an annotated graph appeared on 7/17/2013. Click here.
View all notes |
Alert me of new notes |
CANSLIM.net Company Profile |
SEC |
Zacks Reports |
StockTalk |
News |
Chart |
Request a new note
C
A N
S L
I M


|
CELG
-
NASDAQ
Celgene Corp
DRUGS - Drug Manufacturers - Major
|
$140.65
|
+4.66
3.43% |
$140.79
|
3,050,560
102.98% of 50 DAV
50 DAV is 2,962,200
|
$138.77
1.35%
|
7/11/2013
|
$133.25
|
PP = $131.92
|
|
MB = $138.52
|
 Most Recent Note - 7/25/2013 5:52:53 PM
Y - Rallied today for a solid gain and a best-ever close with average volume. Found support when consolidating above prior highs following its "breakaway gap".
>>> The latest Featured Stock Update with an annotated graph appeared on 7/11/2013. Click here.
View all notes |
Alert me of new notes |
CANSLIM.net Company Profile |
SEC |
Zacks Reports |
StockTalk |
News |
Chart |
Request a new note
C
A N
S L
I M
|
FLT
-
NYSE
Fleetcor Technologies
DIVERSIFIED SERVICES - Business/Management Services
|
$87.61
|
-0.13
-0.15% |
$88.64
|
480,783
62.84% of 50 DAV
50 DAV is 765,100
|
$89.75
-2.38%
|
5/29/2013
|
$86.02
|
PP = $85.66
|
|
MB = $89.94
|
Most Recent Note - 7/18/2013 5:51:55 PM
G- Recently found support near its 50 DMA line with gains lacking volume conviction. Prior low ($80.28 on 6/21/13) defines the next important near-term support where a violation would raise more serious concerns. See the latest FSU analysis for more details and a new annotated graph.
>>> The latest Featured Stock Update with an annotated graph appeared on 7/18/2013. Click here.
View all notes |
Alert me of new notes |
CANSLIM.net Company Profile |
SEC |
Zacks Reports |
StockTalk |
News |
Chart |
Request a new note
C
A N
S L
I M
|
LOPE
-
NASDAQ
Grand Canyon Education
DIVERSIFIED SERVICES - Education and; Training Services
|
$35.99
|
+0.62
1.75% |
$36.01
|
233,439
53.49% of 50 DAV
50 DAV is 436,400
|
$36.45
-1.26%
|
6/19/2013
|
$31.47
|
PP = $34.17
|
|
MB = $35.88
|
Most Recent Note - 7/24/2013 6:28:19 PM
Y - Reversed into the red for a loss with above average volume, ending just below its "max buy" level . Prior highs in the $34 area define initial support above its 50 DMA line. Reports its second quarter results after market close on Tuesday, July 30, 2013.
>>> The latest Featured Stock Update with an annotated graph appeared on 7/19/2013. Click here.
View all notes |
Alert me of new notes |
CANSLIM.net Company Profile |
SEC |
Zacks Reports |
StockTalk |
News |
Chart |
Request a new note
C
A N
S L
I M
|
PCLN
-
NASDAQ
Priceline.Com Inc
INTERNET - Internet Software and Services
|
$912.00
|
+17.98
2.01% |
$919.39
|
776,759
110.51% of 50 DAV
50 DAV is 702,900
|
$926.40
-1.55%
|
7/8/2013
|
$878.28
|
PP = $847.43
|
|
MB = $889.80
|
Most Recent Note - 7/25/2013 5:50:22 PM
G - Posted a gain today with above average volume. Extended from its prior base. Prior highs in the $847 area define support to watch on pullbacks. See the latest FSU analysis for more details and a new annotated graph.
>>> The latest Featured Stock Update with an annotated graph appeared on 7/25/2013. Click here.
View all notes |
Alert me of new notes |
CANSLIM.net Company Profile |
SEC |
Zacks Reports |
StockTalk |
News |
Chart |
Request a new note
C
A N
S L
I M
|
Symbol/Exchange
Company Name
Industry Group |
PRICE |
CHANGE
(%Change) |
Day High |
Volume
(% DAV)
(% 50 day avg vol) |
52 Wk Hi
% From Hi |
Featured
Date |
Price
Featured |
Pivot Featured |
|
Max Buy |
PRLB
-
NYSE
Proto Labs Inc
MANUFACTURING - Small Tools and Accessories
|
$64.34
|
+0.92
1.45% |
$64.40
|
182,811
41.91% of 50 DAV
50 DAV is 436,200
|
$67.40
-4.54%
|
6/17/2013
|
$59.37
|
PP = $59.94
|
|
MB = $62.94
|
Most Recent Note - 7/19/2013 5:55:47 PM
G - Still holding its ground in a tight rage with volume totals cooling. Prior highs near $59 coincide with its 50 DMA line defining important support.
>>> The latest Featured Stock Update with an annotated graph appeared on 7/15/2013. Click here.
View all notes |
Alert me of new notes |
CANSLIM.net Company Profile |
SEC |
Zacks Reports |
StockTalk |
News |
Chart |
Request a new note
C
A N
S L
I M
|
RRTS
-
NYSE
Roadrunner Trans Systems
TRANSPORTATION - Air Delivery and Freight Service
|
$29.84
|
-0.03
-0.10% |
$30.04
|
50,349
32.19% of 50 DAV
50 DAV is 156,400
|
$30.50
-2.16%
|
4/3/2013
|
$22.77
|
PP = $23.75
|
|
MB = $24.94
|
Most Recent Note - 7/22/2013 6:02:05 PM
G - Perched near its 52-week high with volume totals cooling while extended from any sound base. Reports results for the Jun '13 quarter on Wednesday, July 31, 2013 after market close. See the latest FSU analysis for more details and a new annotated graph.
>>> The latest Featured Stock Update with an annotated graph appeared on 7/22/2013. Click here.
View all notes |
Alert me of new notes |
CANSLIM.net Company Profile |
SEC |
Zacks Reports |
StockTalk |
News |
Chart |
Request a new note
C
A N
S L
I M
|
SFUN
-
NYSE
Soufun Hldgs Ltd Ads A
INTERNET - Internet Information Providers
|
$32.17
|
+1.66
5.44% |
$32.25
|
431,330
142.26% of 50 DAV
50 DAV is 303,200
|
$33.03
-2.60%
|
7/16/2013
|
$29.54
|
PP = $27.90
|
|
MB = $29.30
|
Most Recent Note - 7/25/2013 5:54:10 PM
G - Rallied with above average volume for a 3rd consecutive gain and its 2nd best close. It is extended from its latest base. Prior highs in the $28-29 area define initial support to watch.
>>> The latest Featured Stock Update with an annotated graph appeared on 7/16/2013. Click here.
View all notes |
Alert me of new notes |
CANSLIM.net Company Profile |
SEC |
Zacks Reports |
StockTalk |
News |
Chart |
Request a new note
C
A N
S L
I M
|
SSNC
-
NASDAQ
S S & C Technologies
COMPUTER SOFTWARE and SERVICES - Application Software
|
$36.79
|
+0.19
0.52% |
$36.86
|
331,570
85.26% of 50 DAV
50 DAV is 388,900
|
$38.47
-4.37%
|
7/11/2013
|
$35.80
|
PP = $34.54
|
|
MB = $36.27
|
Most Recent Note - 7/25/2013 5:55:52 PM
G - Posted a gain with average volume, trading just above its "max buy" level. Prior highs in the $34 area define initial support to watch on pullbacks.
>>> The latest Featured Stock Update with an annotated graph appeared on 7/12/2013. Click here.
View all notes |
Alert me of new notes |
CANSLIM.net Company Profile |
SEC |
Zacks Reports |
StockTalk |
News |
Chart |
Request a new note
C
A N
S L
I M
|
SSYS
-
NASDAQ
Stratasys Ltd
COMPUTER HARDWARE - Computer Peripherals
|
$89.55
|
+2.88
3.32% |
$89.58
|
313,112
39.24% of 50 DAV
50 DAV is 797,900
|
$96.44
-7.14%
|
7/8/2013
|
$91.44
|
PP = $95.00
|
|
MB = $99.75
|
Most Recent Note - 7/25/2013 5:57:02 PM
Y - Rallied from its 50 DMA line today with a gain backed by light volume. Relative Strength Rating has slumped to 75, below the 80+ minimum guideline for buy candidates while consolidating above support at its 50 DMA line. See the latest FSU analysis for more details and an annotated graph.
>>> The latest Featured Stock Update with an annotated graph appeared on 7/24/2013. Click here.
View all notes |
Alert me of new notes |
CANSLIM.net Company Profile |
SEC |
Zacks Reports |
StockTalk |
News |
Chart |
Request a new note
C
A N
S L
I M
|
Symbol/Exchange
Company Name
Industry Group |
PRICE |
CHANGE
(%Change) |
Day High |
Volume
(% DAV)
(% 50 day avg vol) |
52 Wk Hi
% From Hi |
Featured
Date |
Price
Featured |
Pivot Featured |
|
Max Buy |
VRX
-
NYSE
Valeant Pharmaceuticals
DRUGS - Drug Manufacturers - Other
|
$91.99
|
+0.66
0.72% |
$92.04
|
1,074,905
53.05% of 50 DAV
50 DAV is 2,026,300
|
$96.25
-4.43%
|
4/30/2013
|
$60.24
|
PP = $76.66
|
|
MB = $80.49
|
Most Recent Note - 7/23/2013 5:47:13 PM
Y- Volume totals have been cooling while consolidating near 52-week high after completing a new Public Offering on 6/18/13 following recent M&A news. Formed a cup-with-handle base over the past 8 weeks, however no new pivot point is being cited. Concerns were raised by its Mar '13 earnings report with only a +14% earnings increase, below the +25% minimum guideline (C criteria) for buy candidates. See latest FSU analysis for more details and a new annotated graph.
>>> The latest Featured Stock Update with an annotated graph appeared on 7/23/2013. Click here.
View all notes |
Alert me of new notes |
CANSLIM.net Company Profile |
SEC |
Zacks Reports |
StockTalk |
News |
Chart |
Request a new note
C
A N
S L
I M
|
YNDX
-
NASDAQ
Yandex N V Class A
INTERNET - Internet Information Providers
|
$31.81
|
+0.95
3.08% |
$33.15
|
4,414,293
178.67% of 50 DAV
50 DAV is 2,470,700
|
$31.82
-0.03%
|
7/10/2013
|
$29.29
|
PP = $29.59
|
|
MB = $31.07
|
Most Recent Note - 7/25/2013 2:21:45 PM
G - Color code is changed to green as it gapped up today and hit a new 52-week high, rallying above its "max buy" level. Prior highs in the $28-29 area define near-term support to watch.
>>> The latest Featured Stock Update with an annotated graph appeared on 7/10/2013. Click here.
View all notes |
Alert me of new notes |
CANSLIM.net Company Profile |
SEC |
Zacks Reports |
StockTalk |
News |
Chart |
Request a new note
C
A N
S L
I M
|
|
|
|
THESE ARE NOT BUY RECOMMENDATIONS!
Comments contained in the body of this report are technical
opinions only. The material herein has been obtained
from sources believed to be reliable and accurate, however,
its accuracy and completeness cannot be guaranteed.
This site is not an investment advisor, hence it does
not endorse or recommend any securities or other investments.
Any recommendation contained in this report may not
be suitable for all investors and it is not to be deemed
an offer or solicitation on our part with respect to
the purchase or sale of any securities. All trademarks,
service marks and trade names appearing in this report
are the property of their respective owners, and are
likewise used for identification purposes only.
This report is a service available
only to active Paid Premium Members.
You may opt-out of receiving report notifications
at any time. Questions or comments may be submitted
by writing to Premium Membership Services 665 S.E. 10 Street, Suite 201 Deerfield Beach, FL 33441-5634 or by calling 1-800-965-8307
or 954-785-1121.
|
|
|

